Races in Northdale, Florida (FL) Detailed Stats
Data:
Races - White alone (%)
Races - White alone (% change since 2000)
Races - Black alone (%)
Races - Black alone (% change since 2000)
Races - American Indian alone (%)
Races - American Indian alone (% change since 2000)
Races - Asian alone (%)
Races - Asian alone (% change since 2000)
Races - Hispanic (%)
Races - Hispanic (% change since 2000)
Races - Native Hawaiian and Other Pacific Islander alone (%)
Races - Native Hawaiian and Other Pacific Islander alone (% change since 2000)
Races - Two or more races(%)
Races - Two or more races(% change since 2000)
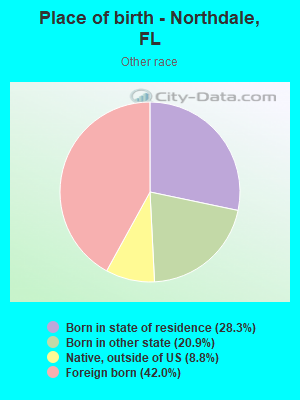
Races - Other race alone (%)
Races - Other race alone (% change since 2000)
Racial diversity
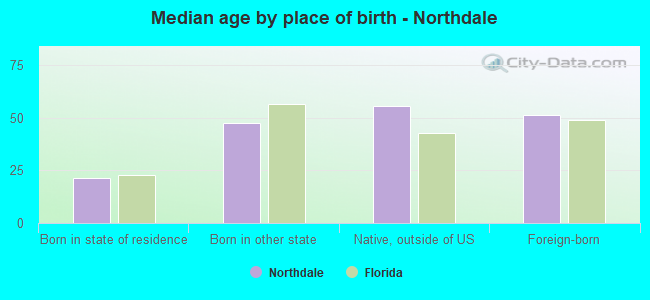
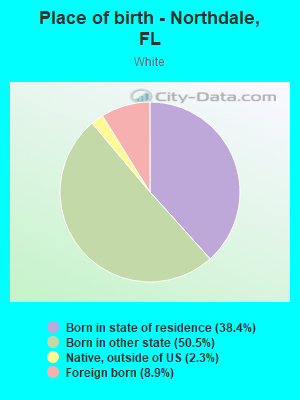
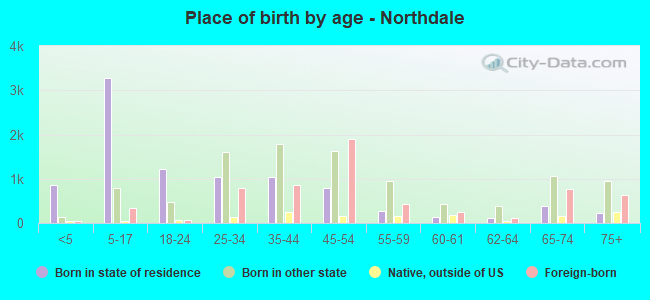
Place of birth - Born in state of residence (%)
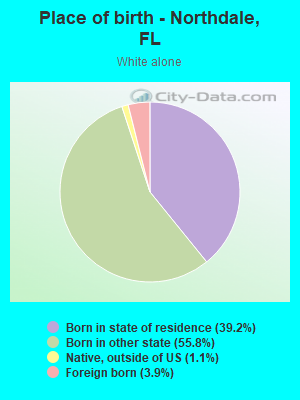
Place of birth - Born in state of residence (%) - White
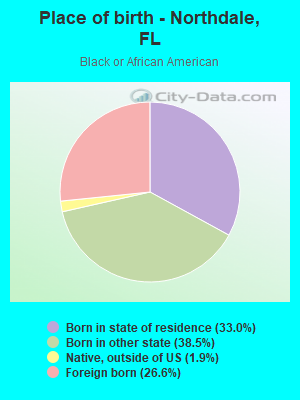
Place of birth - Born in state of residence (%) - Black or African American
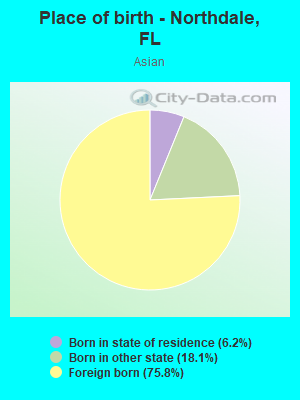
Place of birth - Born in state of residence (%) - Asian
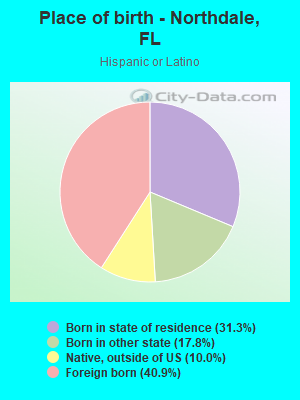
Place of birth - Born in state of residence (%) - Hispanic or Latino
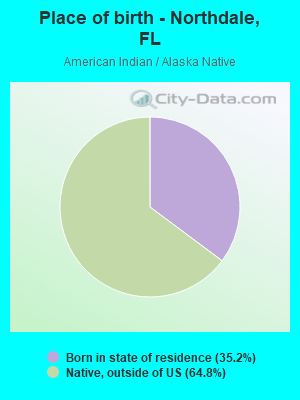
Place of birth - Born in state of residence (%) - American Indian and Alaska Native
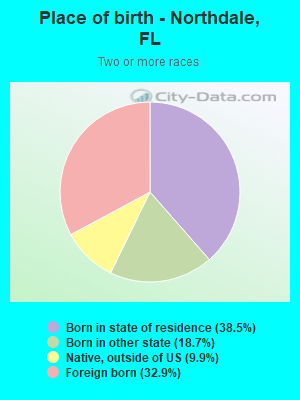
Place of birth - Born in state of residence (%) - Multirace
Place of birth - Born in state of residence (%) - Other Race
Place of birth - Born in other state (%)
Place of birth - Born in other state (%) - White
Place of birth - Born in other state (%) - Black or African American
Place of birth - Born in other state (%) - Asian
Place of birth - Born in other state (%) - Hispanic or Latino
Place of birth - Born in other state (%) - American Indian and Alaska Native
Place of birth - Born in other state (%) - Multirace
Place of birth - Born in other state (%) - Other Race
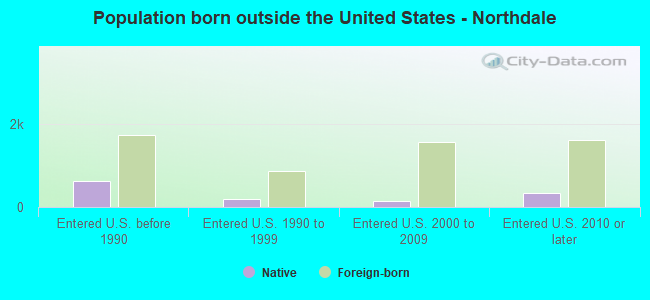
Place of birth - Native, outside of US (%)
Place of birth - Native, outside of US (%) - White
Place of birth - Native, outside of US (%) - Black or African American
Place of birth - Native, outside of US (%) - Asian
Place of birth - Native, outside of US (%) - Hispanic or Latino
Place of birth - Native, outside of US (%) - American Indian and Alaska Native
Place of birth - Native, outside of US (%) - Multirace
Place of birth - Native, outside of US (%) - Other Race
Place of birth - Foreign born (%)
Place of birth - Foreign born (%) - White
Place of birth - Foreign born (%) - Black or African American
Place of birth - Foreign born (%) - Asian
Place of birth - Foreign born (%) - Hispanic or Latino
Place of birth - Foreign born (%) - American Indian and Alaska Native
Place of birth - Foreign born (%) - Multirace
Place of birth - Foreign born (%) - Other Race
Residents speaking English at home (%)
Residents speaking English at home - Born in the United States (%)
Residents speaking English at home - Native, born elsewhere (%)
Residents speaking English at home - Foreign born (%)
Residents speaking Spanish at home (%)
Residents speaking Spanish at home - Born in the United States (%)
Residents speaking Spanish at home - Native, born elsewhere (%)
Residents speaking Spanish at home - Foreign born (%)
Residents speaking other language at home (%)
Residents speaking other language at home - Born in the United States (%)
Residents speaking other language at home - Native, born elsewhere (%)
Residents speaking other language at home - Foreign born (%)
Marital status - Never married (%)
Marital status - Now married (%)
Marital status - Separated (%)
Marital status - Widowed (%)
Marital status - Divorced (%)
Ancestries Reported - Arab (%)
Ancestries Reported - Czech (%)
Ancestries Reported - Danish (%)
Ancestries Reported - Dutch (%)
Ancestries Reported - English (%)
Ancestries Reported - French (%)
Ancestries Reported - French Canadian (%)
Ancestries Reported - German (%)
Ancestries Reported - Greek (%)
Ancestries Reported - Hungarian (%)
Ancestries Reported - Irish (%)
Ancestries Reported - Italian (%)
Ancestries Reported - Lithuanian (%)
Ancestries Reported - Norwegian (%)
Ancestries Reported - Polish (%)
Ancestries Reported - Portuguese (%)
Ancestries Reported - Russian (%)
Ancestries Reported - Scotch-Irish (%)
Ancestries Reported - Scottish (%)
Ancestries Reported - Slovak (%)
Ancestries Reported - Subsaharan African (%)
Ancestries Reported - Swedish (%)
Ancestries Reported - Swiss (%)
Ancestries Reported - Ukrainian (%)
Ancestries Reported - United States (%)
Ancestries Reported - Welsh (%)
Ancestries Reported - West Indian (%)
Ancestries Reported - Other (%)
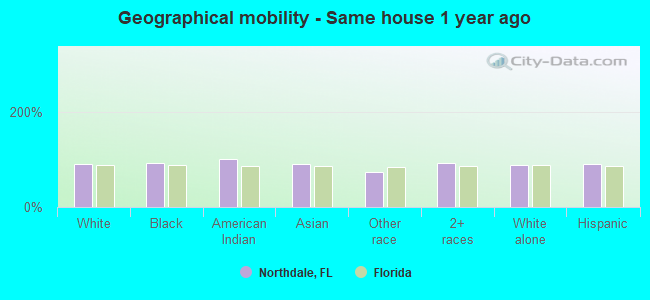
Geographical mobility - Same house 1 year ago (%)
Geographical mobility - Same house 1 year ago (%) - White
Geographical mobility - Same house 1 year ago (%) - Black or African American
Geographical mobility - Same house 1 year ago (%) - Asian
Geographical mobility - Same house 1 year ago (%) - Hispanic or Latino
Geographical mobility - Same house 1 year ago (%) - American Indian and Alaska Native
Geographical mobility - Same house 1 year ago (%) - Multirace
Geographical mobility - Same house 1 year ago (%) - Other Race
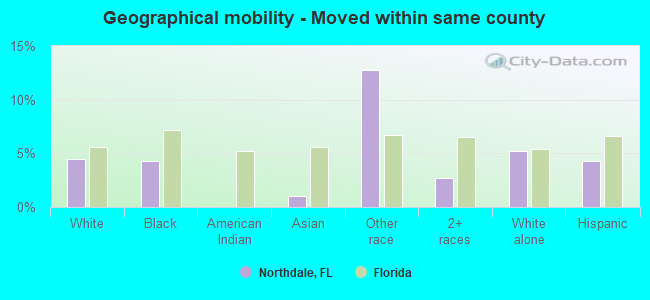
Geographical mobility - Moved within same county (%)
Geographical mobility - Moved within same county (%) - White
Geographical mobility - Moved within same county (%) - Black or African American
Geographical mobility - Moved within same county (%) - Asian
Geographical mobility - Moved within same county (%) - Hispanic or Latino
Geographical mobility - Moved within same county (%) - American Indian and Alaska Native
Geographical mobility - Moved within same county (%) - Multirace
Geographical mobility - Moved within same county (%) - Other Race
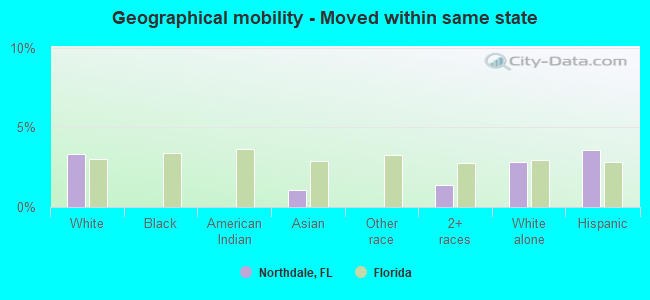
Geographical mobility - Moved from different county within same state (%)
Geographical mobility - Moved from different county within same state (%) - White
Geographical mobility - Moved from different county within same state (%) - Black or African American
Geographical mobility - Moved from different county within same state (%) - Asian
Geographical mobility - Moved from different county within same state (%) - Hispanic or Latino
Geographical mobility - Moved from different county within same state (%) - American Indian and Alaska Native
Geographical mobility - Moved from different county within same state (%) - Multirace
Geographical mobility - Moved from different county within same state (%) - Other Race
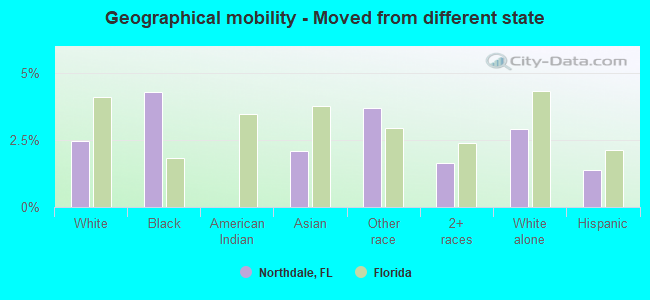
Geographical mobility - Moved from different state (%)
Geographical mobility - Moved from different state (%) - White
Geographical mobility - Moved from different state (%) - Black or African American
Geographical mobility - Moved from different state (%) - Asian
Geographical mobility - Moved from different state (%) - Hispanic or Latino
Geographical mobility - Moved from different state (%) - American Indian and Alaska Native
Geographical mobility - Moved from different state (%) - Multirace
Geographical mobility - Moved from different state (%) - Other Race
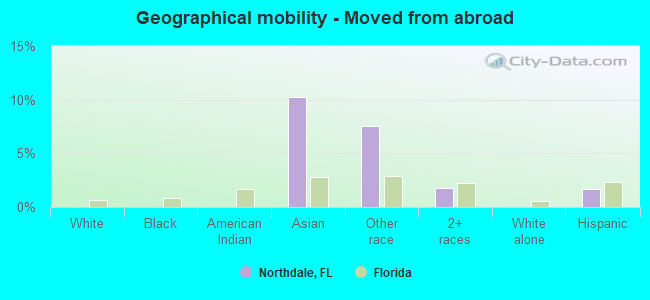
Geographical mobility - Moved from abroad (%)
Geographical mobility - Moved from abroad (%) - White
Geographical mobility - Moved from abroad (%) - Black or African American
Geographical mobility - Moved from abroad (%) - Asian
Geographical mobility - Moved from abroad (%) - Hispanic or Latino
Geographical mobility - Moved from abroad (%) - American Indian and Alaska Native
Geographical mobility - Moved from abroad (%) - Multirace
Geographical mobility - Moved from abroad (%) - Other Race
Place of birth for the foreign-born population - Ireland (%)
Place of birth for the foreign-born population - Denmark (%)
Place of birth for the foreign-born population - Norway (%)
Place of birth for the foreign-born population - Sweden (%)
Place of birth for the foreign-born population - United Kingdom (%)
Place of birth for the foreign-born population - England (%)
Place of birth for the foreign-born population - Scotland (%)
Place of birth for the foreign-born population - Other Northern Europe (%)
Place of birth for the foreign-born population - Austria (%)
Place of birth for the foreign-born population - Belgium (%)
Place of birth for the foreign-born population - France (%)
Place of birth for the foreign-born population - Germany (%)
Place of birth for the foreign-born population - Netherlands (%)
Place of birth for the foreign-born population - Switzerland (%)
Place of birth for the foreign-born population - Other Western Europe (%)
Place of birth for the foreign-born population - Greece (%)
Place of birth for the foreign-born population - Italy (%)
Place of birth for the foreign-born population - Portugal (%)
Place of birth for the foreign-born population - Spain (%)
Place of birth for the foreign-born population - Other Southern Europe (%)
Place of birth for the foreign-born population - Albania (%)
Place of birth for the foreign-born population - Belarus (%)
Place of birth for the foreign-born population - Bosnia and Herzegovina (%)
Place of birth for the foreign-born population - Bulgaria (%)
Place of birth for the foreign-born population - Croatia (%)
Place of birth for the foreign-born population - Czechoslovakia (%)
Place of birth for the foreign-born population - Hungary (%)
Place of birth for the foreign-born population - Latvia (%)
Place of birth for the foreign-born population - Lithuania (%)
Place of birth for the foreign-born population - North Macedonia (Macedonia) (%)
Place of birth for the foreign-born population - Moldova (%)
Place of birth for the foreign-born population - Poland (%)
Place of birth for the foreign-born population - Romania (%)
Place of birth for the foreign-born population - Russia (%)
Place of birth for the foreign-born population - Serbia (%)
Place of birth for the foreign-born population - Ukraine (%)
Place of birth for the foreign-born population - Other Eastern Europe (%)
Place of birth for the foreign-born population - China (%)
Place of birth for the foreign-born population - Hong Kong (%)
Place of birth for the foreign-born population - Taiwan (%)
Place of birth for the foreign-born population - Japan (%)
Place of birth for the foreign-born population - Korea (%)
Place of birth for the foreign-born population - Other Eastern Asia (%)
Place of birth for the foreign-born population - Afghanistan (%)
Place of birth for the foreign-born population - Bangladesh (%)
Place of birth for the foreign-born population - India (%)
Place of birth for the foreign-born population - Iran (%)
Place of birth for the foreign-born population - Kazakhstan (%)
Place of birth for the foreign-born population - Nepal (%)
Place of birth for the foreign-born population - Pakistan (%)
Place of birth for the foreign-born population - Sri Lanka (%)
Place of birth for the foreign-born population - Uzbekistan (%)
Place of birth for the foreign-born population - Other South Central Asia (%)
Place of birth for the foreign-born population - Burma (%)
Place of birth for the foreign-born population - Cambodia (%)
Place of birth for the foreign-born population - Indonesia (%)
Place of birth for the foreign-born population - Laos (%)
Place of birth for the foreign-born population - Malaysia (%)
Place of birth for the foreign-born population - Philippines (%)
Place of birth for the foreign-born population - Singapore (%)
Place of birth for the foreign-born population - Thailand (%)
Place of birth for the foreign-born population - Vietnam (%)
Place of birth for the foreign-born population - Other South Eastern Asia (%)
Place of birth for the foreign-born population - Armenia (%)
Place of birth for the foreign-born population - Iraq (%)
Place of birth for the foreign-born population - Israel (%)
Place of birth for the foreign-born population - Jordan (%)
Place of birth for the foreign-born population - Kuwait (%)
Place of birth for the foreign-born population - Lebanon (%)
Place of birth for the foreign-born population - Saudi Arabia (%)
Place of birth for the foreign-born population - Syria (%)
Place of birth for the foreign-born population - Turkey (%)
Place of birth for the foreign-born population - Yemen (%)
Place of birth for the foreign-born population - Other Western Asia (%)
Place of birth for the foreign-born population - Eritrea (%)
Place of birth for the foreign-born population - Ethiopia (%)
Place of birth for the foreign-born population - Kenya (%)
Place of birth for the foreign-born population - Somalia (%)
Place of birth for the foreign-born population - Uganda (%)
Place of birth for the foreign-born population - Zimbabwe (%)
Place of birth for the foreign-born population - Other Eastern Africa (%)
Place of birth for the foreign-born population - Cameroon (%)
Place of birth for the foreign-born population - Congo (%)
Place of birth for the foreign-born population - Democratic Republic of Congo (Zaire) (%)
Place of birth for the foreign-born population - Other Middle Africa (%)
Place of birth for the foreign-born population - Egypt (%)
Place of birth for the foreign-born population - Morocco (%)
Place of birth for the foreign-born population - Sudan (%)
Place of birth for the foreign-born population - Other Northern Africa (%)
Place of birth for the foreign-born population - South Africa (%)
Place of birth for the foreign-born population - Other Southern Africa (%)
Place of birth for the foreign-born population - Cabo Verde (%)
Place of birth for the foreign-born population - Ghana (%)
Place of birth for the foreign-born population - Liberia (%)
Place of birth for the foreign-born population - Nigeria (%)
Place of birth for the foreign-born population - Senegal (%)
Place of birth for the foreign-born population - Sierra Leone (%)
Place of birth for the foreign-born population - Other Western Africa (%)
Place of birth for the foreign-born population - Australia (%)
Place of birth for the foreign-born population - New Zealand (%)
Place of birth for the foreign-born population - Fiji (%)
Place of birth for the foreign-born population - Micronesia (%)
Place of birth for the foreign-born population - Bahamas (%)
Place of birth for the foreign-born population - Barbados (%)
Place of birth for the foreign-born population - Cuba (%)
Place of birth for the foreign-born population - Dominica (%)
Place of birth for the foreign-born population - Dominican Republic (%)
Place of birth for the foreign-born population - Grenada (%)
Place of birth for the foreign-born population - Haiti (%)
Place of birth for the foreign-born population - Jamaica (%)
Place of birth for the foreign-born population - St. Vincent and the Grenadines (%)
Place of birth for the foreign-born population - Trinidad and Tobago (%)
Place of birth for the foreign-born population - West Indies (%)
Place of birth for the foreign-born population - Other Caribbean (%)
Place of birth for the foreign-born population - Belize (%)
Place of birth for the foreign-born population - Costa Rica (%)
Place of birth for the foreign-born population - El Salvador (%)
Place of birth for the foreign-born population - Guatemala (%)
Place of birth for the foreign-born population - Honduras (%)
Place of birth for the foreign-born population - Mexico (%)
Place of birth for the foreign-born population - Nicaragua (%)
Place of birth for the foreign-born population - Panama (%)
Place of birth for the foreign-born population - Other Central America (%)
Place of birth for the foreign-born population - Argentina (%)
Place of birth for the foreign-born population - Bolivia (%)
Place of birth for the foreign-born population - Brazil (%)
Place of birth for the foreign-born population - Chile (%)
Place of birth for the foreign-born population - Colombia (%)
Place of birth for the foreign-born population - Ecuador (%)
Place of birth for the foreign-born population - Guyana (%)
Place of birth for the foreign-born population - Peru (%)
Place of birth for the foreign-born population - Uruguay (%)
Place of birth for the foreign-born population - Venezuela (%)
Place of birth for the foreign-born population - Other South America (%)
Place of birth for the foreign-born population - Canada (%)
Place of birth for the foreign-born population - Other Northern America (%)
Place of birth for the foreign-born population - Other (%)
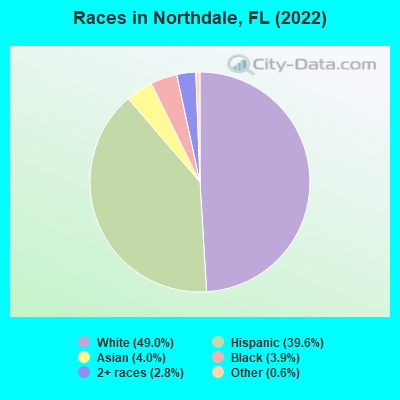
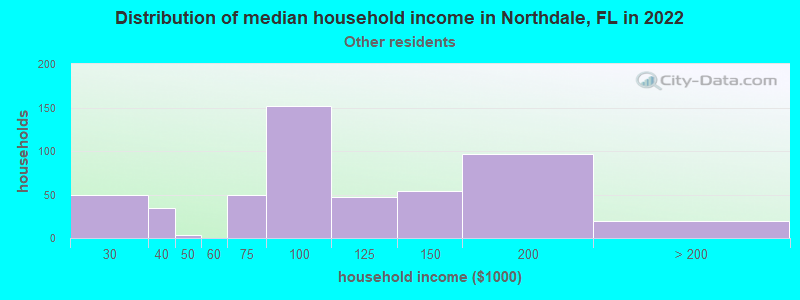
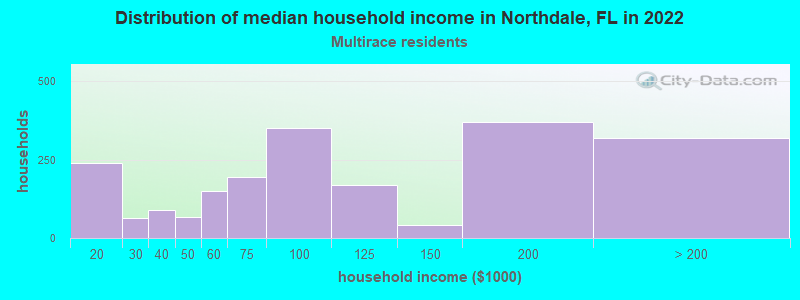
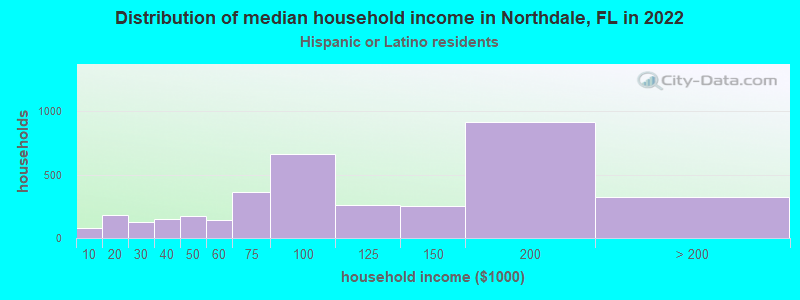
According to 2022 data, the most numerous races in Northdale, FL are White alone (13,155 residents), Hispanic (10,654 residents), and Black alone (1,061 residents). 68.0% of Northdale residents speak English at home.
Race distribution in Northdale 13,155 49.0% White alone 10,654 39.6% Hispanic 1,068 4.0% Asian alone 1,061 3.9% Black alone 742 2.8% Two or more races 163 0.6% Other race alone
2000 2022
10,458,509 65.4% White alone 2,682,715 16.8% Hispanic 2,264,268 14.2% Black alone 261,693 1.6% Asian alone 236,954 1.5% Two or more races 42,358 0.3% American Indian alone 28,994 0.2% Other race alone 6,887 0.04% Native Hawaiian and Other
11,309,403 50.8% White alone 6,025,039 27.1% Hispanic 3,241,015 14.6% Black alone 861,630 3.9% Two or more races 623,692 2.8% Asian alone 152,054 0.7% Other race alone 22,504 0.1% American Indian alone 9,486 0.04% Native Hawaiian and Other
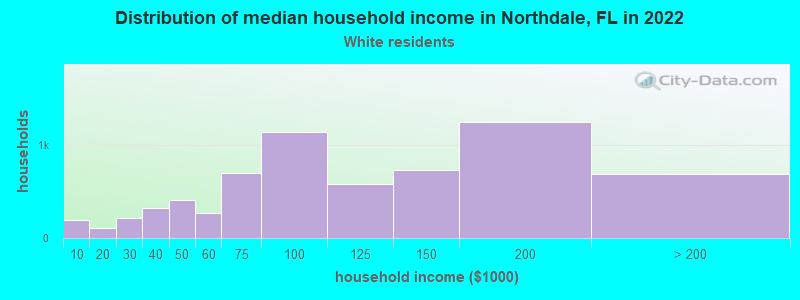
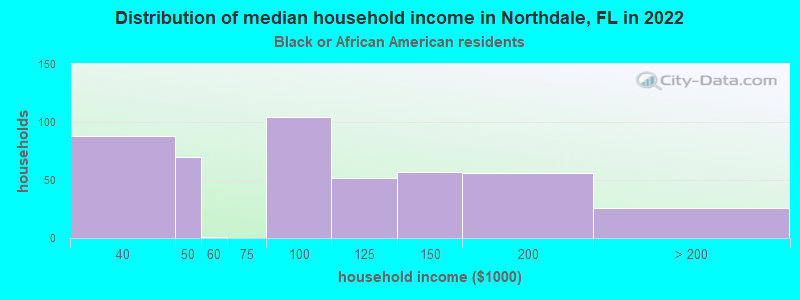
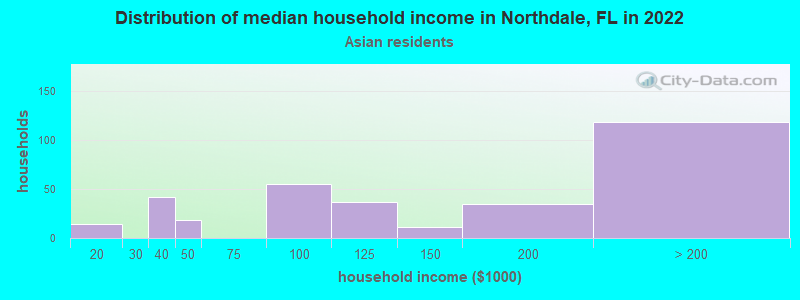
Income and house value in Northdale Median household income in 2022 $94,844 White non-Hispanic householders$102,510 Black householders$120,545 Asian householders$100,988 Some other race householders$84,974 Two or more races householders$98,417 Hispanic or Latino race householders
Median age by race in Northdale
44.5 Median age for White residents45.3 43.6 38.8 Median age for Black or African American residents46.0 32.4 -670,487,105.3 Median age for American Indian / Alaska Native residents-676,245,210.1 -655,399,060.4 35.4 Median age for Asian residents42.6 33.6 -848,484,847.6 Median age for Native Hawaiian / Pacific Islander residents-776,729,559.0 -490,118,576.6 40.4 Median age for Other race residents31.9 45.3 35.3 Median age for Two or more races residents34.1 38.2 42.6 Median age for White alone residents43.5 42.4 42.3 Median age for Hispanic or Latino residents42.0 42.7
Owner/renter occupied households by race in Northdale
House owners and renters - White residents 4,963 75.4% Owner occupied1,617 24.6% Renter occupiedHouse owners and renters - Black or African American residents 224 50.3% Owner occupied221 49.7% Renter occupiedHouse owners and renters - Asian residents 295 87.1% Owner occupied44 12.9% Renter occupiedHouse owners and renters - Other race residents 286 55.0% Owner occupied234 45.0% Renter occupiedHouse owners and renters - Two or more races residents 1,410 69.2% Owner occupied626 30.8% Renter occupiedHouse owners and renters - White alone residents 4,069 76.2% Owner occupied1,270 23.8% Renter occupiedHouse owners and renters - Hispanic or Latino residents 2,387 67.1% Owner occupied1,169 32.9% Renter occupied
Language usage in Northdale
English speakers - Total 68.0% of residents of Northdale speak English at home.
27.4% of residents speak Spanish at home 4,122 58.2% Speak English very well2,956 41.8% Speak English less than very well4.1% of residents speak other language at home 645 61.4% Speak English very well405 38.6% Speak English less than very well
English speakers - Born in the United States 89.1% of residents of Northdale speak English at home.
10.2% of residents speak Spanish at home 895 87.7% Speak English very well126 12.3% Speak English less than very well0.7% of residents speak other language at home 74 100.0% Speak English very well
English speakers - Native, born elsewhere 32.4% of residents of Northdale speak English at home.
66.0% of residents speak Spanish at home 512 61.2% Speak English very well324 38.8% Speak English less than very well
English speakers - Foreign-born 20.5% of residents of Northdale speak English at home.
66.7% of residents speak Spanish at home 1,623 39.6% Speak English very well2,476 60.4% Speak English less than very well12.5% of residents speak other language at home 366 47.8% Speak English very well400 52.2% Speak English less than very well
White (Caucasian) - Speak only English Native:
91.7% (12,735)Foreign-born:
25.9% (363)
White (Caucasian) - Speak another language Native:
7.1% (985)Foreign-born:
72.3% (1,013)
Black or African American - Speak only English Native:
99.3% (747)Foreign-born:
67.5% (196)
Black or African American - Speak another language Native:
0.9% (7)Foreign-born:
32.1% (93)
Asian - Speak only English Native:
71.8% (172)Foreign-born:
59.3% (487)
Asian - Speak another language Native:
24.0% (57)Foreign-born:
41.8% (343)
Other race - Speak only English Native:
47.6% (525)Foreign-born:
8.9% (73)
Other race - Speak another language Native:
53.5% (590)Foreign-born:
90.3% (743)
Two or more races - Speak only English Native:
62.7% (2,379)Foreign-born:
5.2% (104)
Two or more races - Speak another language Native:
36.5% (1,385)Foreign-born:
95.5% (1,893)
White alone - Speak only English Native:
96.7% (11,693)Foreign-born:
57.1% (293)
White alone - Speak another language Native:
3.2% (392)Foreign-born:
44.7% (229)
Hispanic or Latino - Speak only English Native:
54.8% (3,290)Foreign-born:
5.1% (221)
Hispanic or Latino - Speak another language Native:
47.5% (2,850)Foreign-born:
94.9% (4,143)
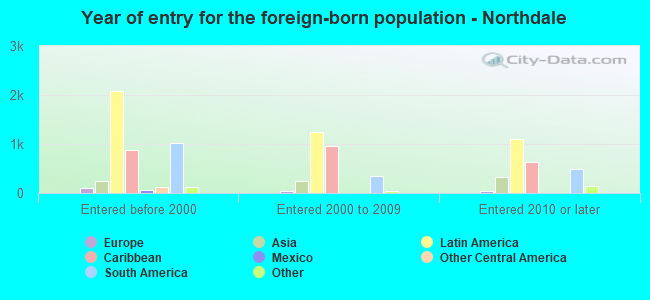
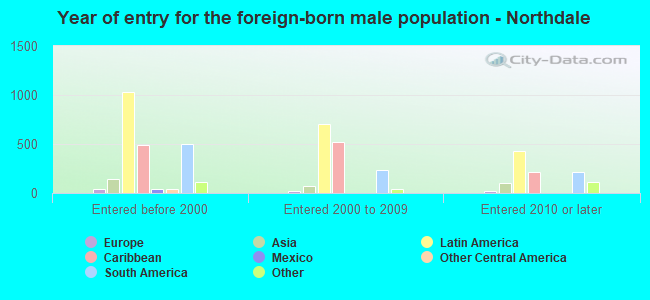
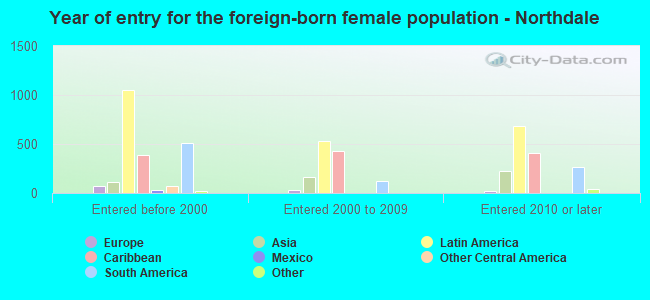
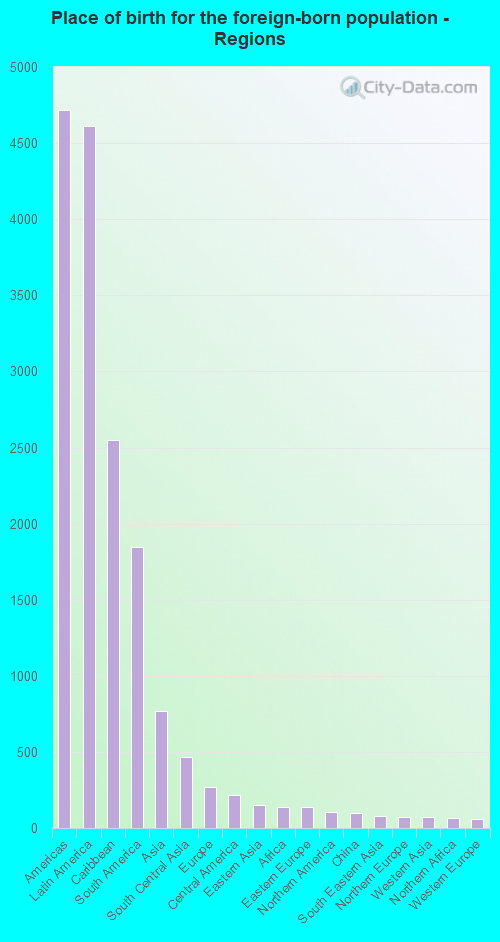
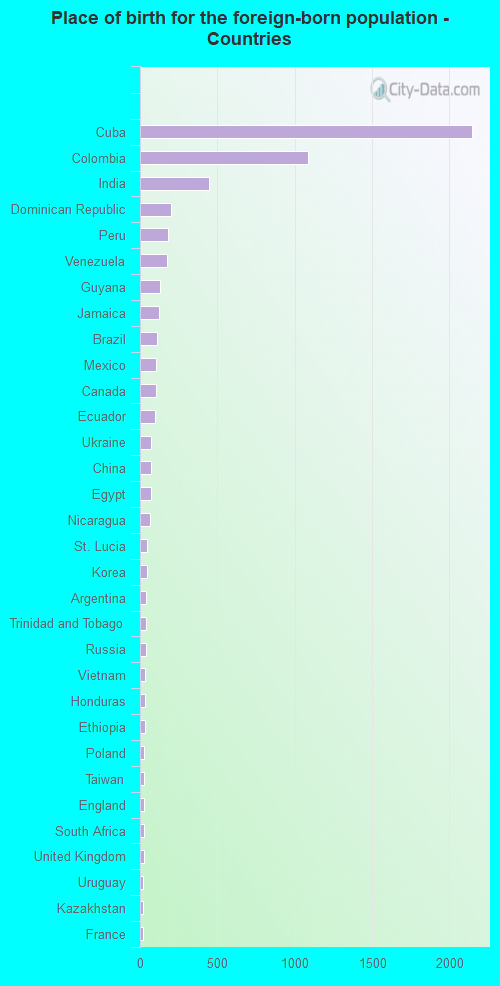
Foreign-born residents in Northdale
Marital status for residents in Northdale Marital status - White (Caucasian) population 15 years and over
Males 27.9% Never married59.1% Now married1.2% Separated4.1% Widowed7.7% DivorcedFemales 22.4% Never married57.2% Now married0.1% Separated8.7% Widowed11.6% DivorcedWomen who gave birth in the past 12 months Now married:
89.5% (167)Unmarried:
10.5% (20)
Women who did not give birth in the past 12 months Now married:
49.5% (1,651)Unmarried:
50.5% (1,683)
Marital status - Black or African American population 15 years and over
Males 47.0% Never married42.0% Now married1.7% Separated7.0% Widowed2.4% DivorcedFemales 36.1% Never married30.2% Now married2.0% Separated13.9% Widowed17.8% DivorcedWomen who did not give birth in the past 12 months Now married:
16.9% (44)Unmarried:
83.1% (216)
Marital status - Asian population 15 years and over
Males 15.5% Never married80.5% Now married0.0% Separated0.0% Widowed4.0% DivorcedFemales 13.9% Never married69.4% Now married3.1% Separated7.9% Widowed5.6% DivorcedWomen who gave birth in the past 12 months Now married:
100.0% (59)Unmarried:
0.0% (0)
Women who did not give birth in the past 12 months Now married:
72.4% (213)Unmarried:
27.6% (81)
Marital status - Other race population 15 years and over
Males 34.0% Never married42.7% Now married2.9% Separated1.0% Widowed19.3% DivorcedFemales 23.3% Never married27.4% Now married19.9% Separated4.3% Widowed25.0% DivorcedWomen who gave birth in the past 12 months Now married:
100.0% (16)Unmarried:
0.0% (0)
Women who did not give birth in the past 12 months Now married:
36.6% (147)Unmarried:
63.4% (254)
Marital status - Two or more races population 15 years and over
Males 35.0% Never married57.3% Now married0.0% Separated0.5% Widowed7.2% DivorcedFemales 34.2% Never married36.7% Now married2.6% Separated13.0% Widowed13.4% DivorcedWomen who gave birth in the past 12 months Now married:
100.0% (41)Unmarried:
0.0% (0)
Women who did not give birth in the past 12 months Now married:
40.3% (677)Unmarried:
59.7% (1,004)
Marital status - White alone, not Hispanic / Latino population 15 years and over
Males 30.1% Never married57.5% Now married0.3% Separated3.7% Widowed8.5% DivorcedFemales 24.8% Never married56.3% Now married0.2% Separated8.4% Widowed10.3% DivorcedWomen who gave birth in the past 12 months Now married:
89.0% (187)Unmarried:
11.0% (23)
Women who did not give birth in the past 12 months Now married:
49.3% (1,373)Unmarried:
50.7% (1,414)
Marital status - Hispanic or Latino population 15 years and over
Males 27.2% Never married58.3% Now married2.4% Separated3.6% Widowed8.4% DivorcedFemales 23.1% Never married46.5% Now married3.9% Separated10.6% Widowed16.0% DivorcedWomen who gave birth in the past 12 months Now married:
100.0% (39)Unmarried:
0.0% (0)
Women who did not give birth in the past 12 months Now married:
45.2% (1,109)Unmarried:
54.8% (1,343)
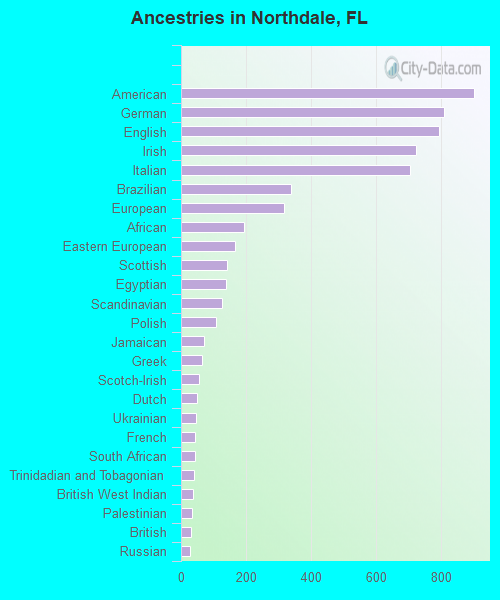
Ancestries in Northdale
904 6.4% American809 5.7% German796 5.6% English723 5.1% Irish705 5.0% Italian339 2.4% Brazilian316 2.2% European195 1.4% African166 1.2% Eastern European142 1.0% Scottish139 1.0% Egyptian126 0.9% Scandinavian107 0.8% Polish72 0.5% Jamaican66 0.5% Greek56 0.4% Scotch-Irish50 0.4% Dutch46 0.3% Ukrainian43 0.3% French43 0.3% South African39 0.3% Trinidadian and Tobagonian38 0.3% British West Indian35 0.2% Palestinian30 0.2% British28 0.2% Russian28 0.2% Northern European28 0.2% French Canadian26 0.2% Slavic22 0.2% Austrian21 0.1% Hungarian19 0.1% Slovene18 0.1% Norwegian15 0.1% Nigerian12 0.09% Lebanese12 0.09% Canadian9 0.06% Yugoslavian9 0.06% Arab8 0.06% Slovak8 0.06% Swedish5 0.04% Czech4 0.03% Danish4 0.03% Croatian
Geographical mobility in Northdale Same house 1 year ago 14,580 90.6% White (Caucasian)993 93.5% Black or African American22 100.0% American Indian / Alaska Native961 90.7% Asian1,414 72.7% Other race5,608 93.0% Two or more races11,664 89.3% White alone, not Hispanic / Latino9,499 89.8% Hispanic or LatinoMoved within same county 713 4.4% White / Caucasian45 4.3% Black or African American11 1.0% Asian248 12.7% Other race164 2.7% Two or more races685 5.2% White alone, not Hispanic / Latino451 4.3% Hispanic or LatinoMoved within same state 538 3.3% White / Caucasian12 1.1% Asian85 1.4% Two or more races371 2.8% White alone, not Hispanic / Latino379 3.6% Hispanic or LatinoMoved from different state 394 2.4% White / Caucasian45 4.3% Black or African American22 2.1% Asian72 3.7% Other race99 1.6% Two or more races381 2.9% White alone, not Hispanic / Latino146 1.4% Hispanic or LatinoMoved from abroad 1 0.0% White108 10.2% Asian147 7.6% Other race107 1.8% Two or more races2 0.0% White alone, not Hispanic / Latino180 1.7% Hispanic or Latino
Children Nativity (place of birth) in Northdale
Children under 6 years - Living with two parents Both parents native 699 100.0% NativeBoth parents foreign-born 153 66.6% Native77 33.4% Foreign-bornOne native, one foreign-born parent 117 100.0% NativeChildren under 6 years - Living with one parent Native parent 203 100.0% NativeForeign-born parent 23 100.0% NativeChildren 6 to 17 years - Living with two parents Both parents native 1,861 100.0% NativeBoth parents foreign-born 270 77.2% Native80 22.8% Foreign-bornOne native, one foreign-born parent 544 100.0% NativeChildren 6 to 17 years - Living with one parent Native parent 781 100.0% NativeForeign-born parent 222 59.1% Native154 40.9% Foreign-born
Grandparents responsible for own grandchildren in Northdale
Grandparents (30 to 59 years) White / Caucasian 179 100.0% Not responsible for grandchildrenAsian 26 100.0% Not responsible for grandchildrenOther race 4 100.0% Responsible for grandchildrenTwo or more races 21 23.9% Responsible for grandchildren66 76.1% Not responsible for grandchildrenWhite alone, not Hispanic / Latino 95 100.0% Not responsible for grandchildrenHispanic or Latino 21 17.4% Responsible for grandchildren98 82.6% Not responsible for grandchildrenGrandparents (60 years and over) White / Caucasian 64 32.5% Responsible for grandchildren133 67.5% Not responsible for grandchildrenAsian 6 100.0% Responsible for grandchildrenOther race 247 100.0% Not responsible for grandchildrenTwo or more races 7 4.0% Responsible for grandchildren168 96.0% Not responsible for grandchildrenWhite alone, not Hispanic / Latino 64 33.9% Responsible for grandchildren124 66.1% Not responsible for grandchildrenHispanic or Latino 10 2.9% Responsible for grandchildren332 97.1% Not responsible for grandchildren