Races in Northeast Umatilla, Oregon (OR) Detailed Stats
Ancestries, Foreign-born residents, place of birth
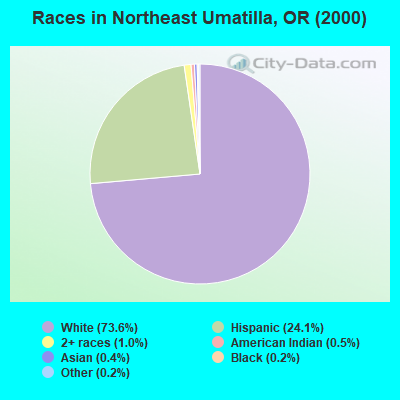
Race distribution in Northeast Umatilla

- 7,70473.6%White alone
- 2,51824.1%Hispanic
- 1061.0%Two or more races
- 510.5%American Indian alone
- 400.4%Asian alone
- 220.2%Black alone
- 200.2%Other race alone
- 70.07%Native Hawaiian and Other
Pacific Islander alone
2000
2022
-
- 2,857,61683.5%White alone
- 275,3148.0%Hispanic
- 100,3332.9%Asian alone
- 82,7332.4%Two or more races
- 53,3251.6%Black alone
- 40,1301.2%American Indian alone
- 7,3980.2%Native Hawaiian and Other
Pacific Islander alone - 4,5500.1%Other race alone

-
- 3,037,57171.6%White alone
- 609,53814.4%Hispanic
- 252,7446.0%Two or more races
- 191,2834.5%Asian alone
- 78,2281.8%Black alone
- 29,3990.7%American Indian alone
- 25,7310.6%Other race alone
- 15,6430.4%Native Hawaiian and Other
Pacific Islander alone

Income and house value in Northeast Umatilla
- Median household income in 2022
- $62,216White non-Hispanic householders
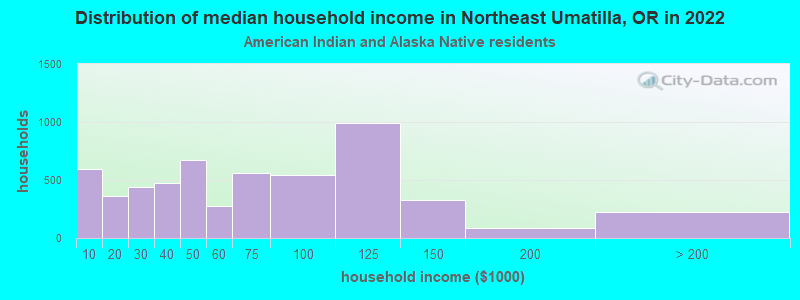
- $23,141American Indian and Alaska Native householders
- $99,184Some other race householders
- $36,626Two or more races householders
- $82,983Hispanic or Latino race householders
- Median 2022 house value
- $283,582White Non-Hispanic householders
- $245,125Some other race householders
- $185,094Two or more races householders
- $232,931Hispanic or Latino householders
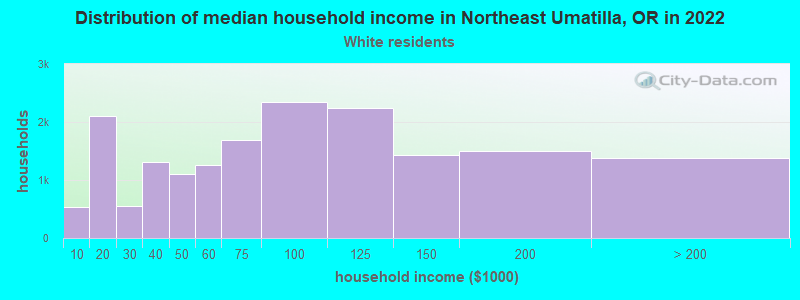
Household income for White non-Hispanic householders
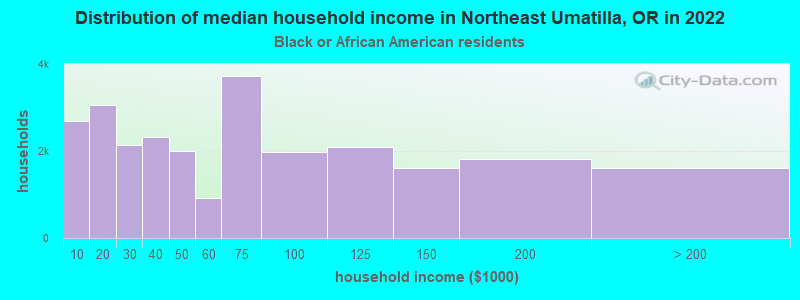
Household income for Black householders
Household income for American Indian and Alaska Native householders
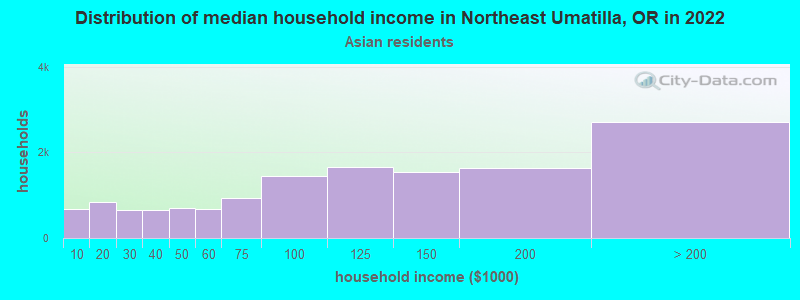
Household income for Asian householders
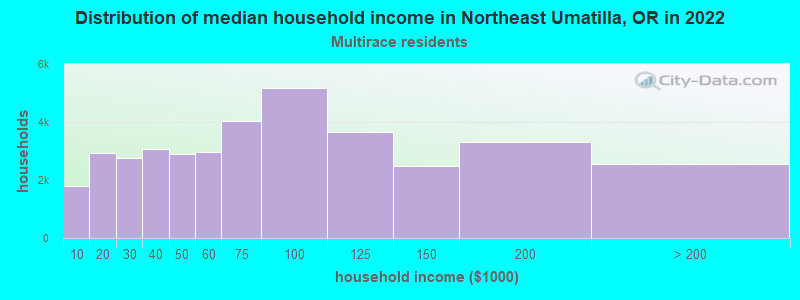
Household income for Two or more races householders
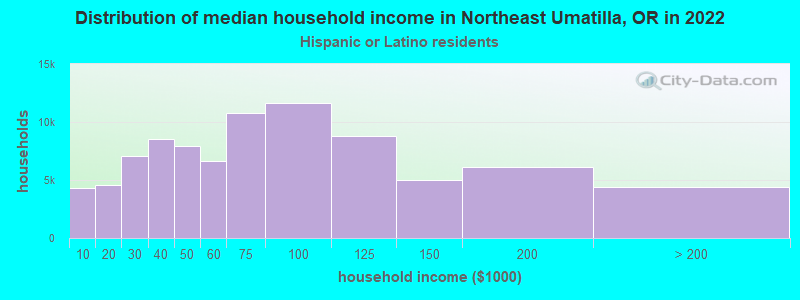
Household income for Hispanic or Latino race householders
Zip code: 97862