Races in Northeast Yakima, Washington (WA) Detailed Stats
Ancestries, Foreign-born residents, place of birth
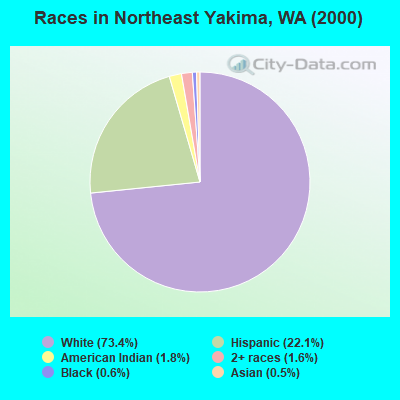
Race distribution in Northeast Yakima

- 4,80373.4%White alone
- 1,44922.1%Hispanic
- 1171.8%American Indian alone
- 1041.6%Two or more races
- 360.6%Black alone
- 330.5%Asian alone
- 20.03%Native Hawaiian and Other
Pacific Islander alone
2000
2022
-
- 4,652,49078.9%White alone
- 441,5097.5%Hispanic
- 319,4015.4%Asian alone
- 184,6313.1%Black alone
- 175,9263.0%Two or more races
- 85,3961.4%American Indian alone
- 22,7790.4%Native Hawaiian and Other
Pacific Islander alone - 11,9890.2%Other race alone

-
- 4,941,45663.5%White alone
- 1,093,31314.0%Hispanic
- 755,8329.7%Asian alone
- 523,4486.7%Two or more races
- 299,5373.8%Black alone
- 69,0240.9%American Indian alone
- 52,2310.7%Native Hawaiian and Other
Pacific Islander alone - 50,9450.7%Other race alone

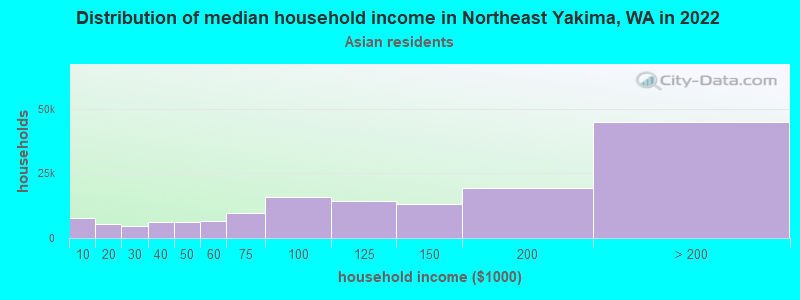
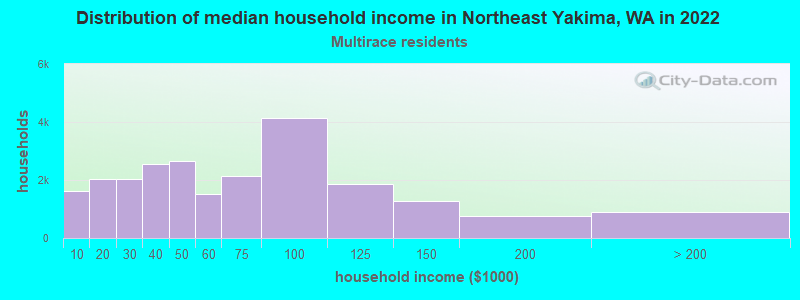
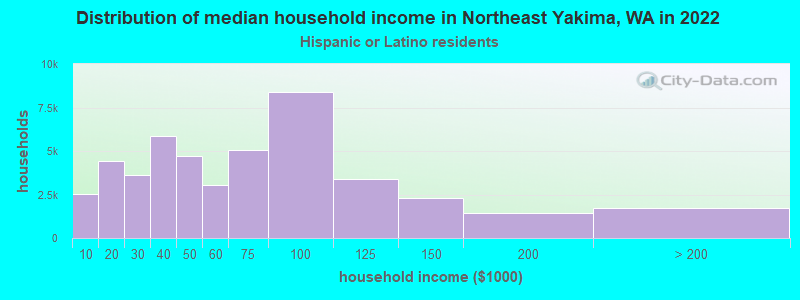
Income and house value in Northeast Yakima
- Median household income in 2022
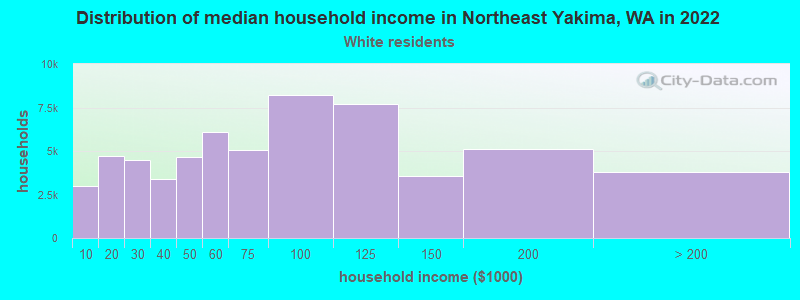
- $81,762White non-Hispanic householders
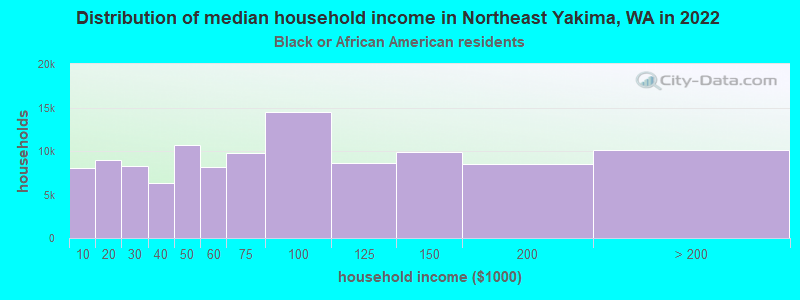
- $48,709Black householders
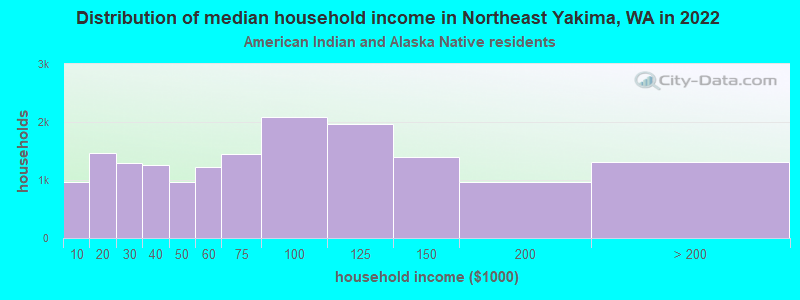
- $65,214American Indian and Alaska Native householders
- $130,919Asian householders
- $72,183Some other race householders
- $63,742Two or more races householders
- $74,694Hispanic or Latino race householders
- Median 2022 house value
- $391,511White Non-Hispanic householders
- $384,794Black or African American householders
- $237,873American Indian or Alaska Native householders
- $265,858Asian householders
- $272,294Some other race householders
- $485,820Two or more races householders
- $270,895Hispanic or Latino householders
Household income for White non-Hispanic householders
Household income for Black householders
Household income for American Indian and Alaska Native householders
Household income for Asian householders
Household income for Two or more races householders
Household income for Hispanic or Latino race householders
Zip code: 98936