Races in Northlake, Illinois (IL) Detailed Stats
Data:
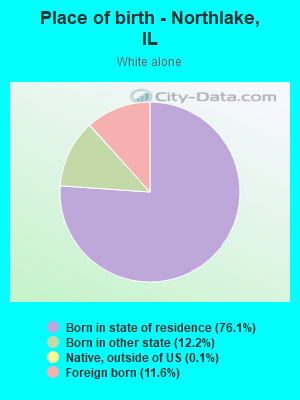
Races - White alone (%)
Races - White alone (% change since 2000)
Races - Black alone (%)
Races - Black alone (% change since 2000)
Races - American Indian alone (%)
Races - American Indian alone (% change since 2000)
Races - Asian alone (%)
Races - Asian alone (% change since 2000)
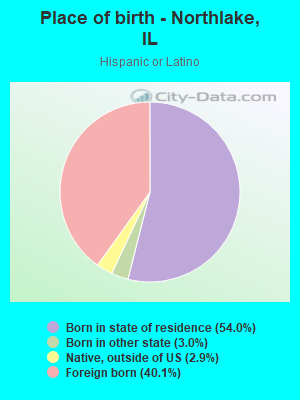
Races - Hispanic (%)
Races - Hispanic (% change since 2000)
Races - Native Hawaiian and Other Pacific Islander alone (%)
Races - Native Hawaiian and Other Pacific Islander alone (% change since 2000)
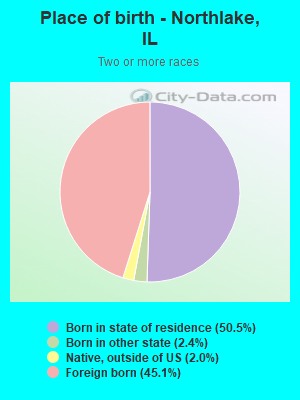
Races - Two or more races(%)
Races - Two or more races(% change since 2000)
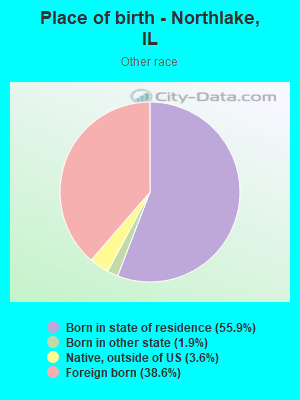
Races - Other race alone (%)
Races - Other race alone (% change since 2000)
Racial diversity
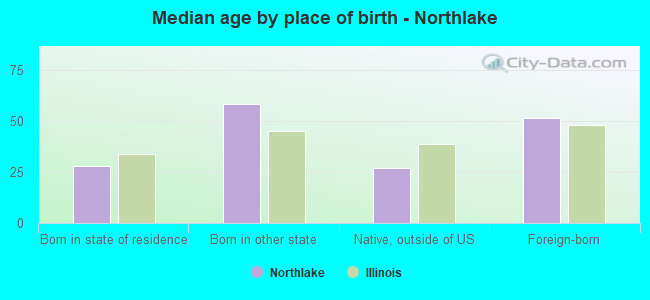
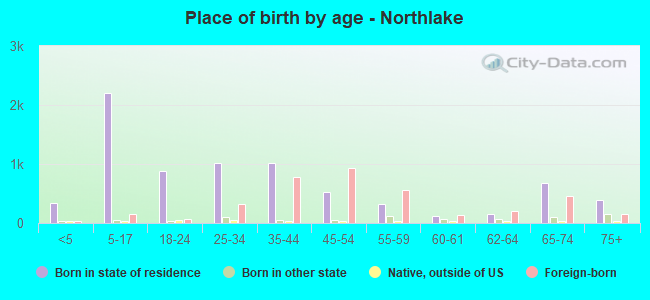
Place of birth - Born in state of residence (%)
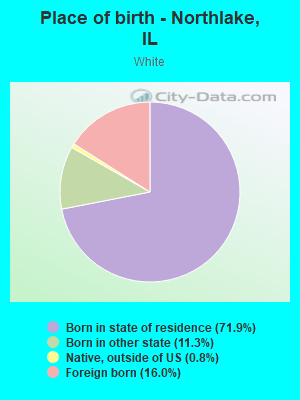
Place of birth - Born in state of residence (%) - White
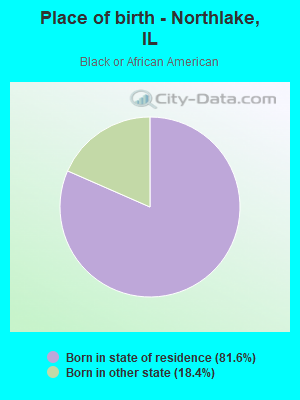
Place of birth - Born in state of residence (%) - Black or African American
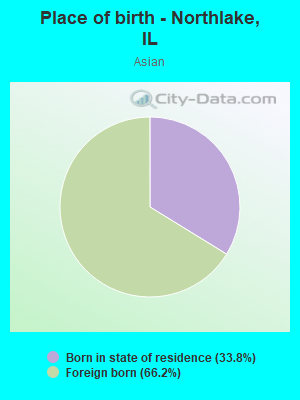
Place of birth - Born in state of residence (%) - Asian
Place of birth - Born in state of residence (%) - Hispanic or Latino
Place of birth - Born in state of residence (%) - American Indian and Alaska Native
Place of birth - Born in state of residence (%) - Multirace
Place of birth - Born in state of residence (%) - Other Race
Place of birth - Born in other state (%)
Place of birth - Born in other state (%) - White
Place of birth - Born in other state (%) - Black or African American
Place of birth - Born in other state (%) - Asian
Place of birth - Born in other state (%) - Hispanic or Latino
Place of birth - Born in other state (%) - American Indian and Alaska Native
Place of birth - Born in other state (%) - Multirace
Place of birth - Born in other state (%) - Other Race
Place of birth - Native, outside of US (%)
Place of birth - Native, outside of US (%) - White
Place of birth - Native, outside of US (%) - Black or African American
Place of birth - Native, outside of US (%) - Asian
Place of birth - Native, outside of US (%) - Hispanic or Latino
Place of birth - Native, outside of US (%) - American Indian and Alaska Native
Place of birth - Native, outside of US (%) - Multirace
Place of birth - Native, outside of US (%) - Other Race
Place of birth - Foreign born (%)
Place of birth - Foreign born (%) - White
Place of birth - Foreign born (%) - Black or African American
Place of birth - Foreign born (%) - Asian
Place of birth - Foreign born (%) - Hispanic or Latino
Place of birth - Foreign born (%) - American Indian and Alaska Native
Place of birth - Foreign born (%) - Multirace
Place of birth - Foreign born (%) - Other Race
Residents speaking English at home (%)
Residents speaking English at home - Born in the United States (%)
Residents speaking English at home - Native, born elsewhere (%)
Residents speaking English at home - Foreign born (%)
Residents speaking Spanish at home (%)
Residents speaking Spanish at home - Born in the United States (%)
Residents speaking Spanish at home - Native, born elsewhere (%)
Residents speaking Spanish at home - Foreign born (%)
Residents speaking other language at home (%)
Residents speaking other language at home - Born in the United States (%)
Residents speaking other language at home - Native, born elsewhere (%)
Residents speaking other language at home - Foreign born (%)
Marital status - Never married (%)
Marital status - Now married (%)
Marital status - Separated (%)
Marital status - Widowed (%)
Marital status - Divorced (%)
Ancestries Reported - Arab (%)
Ancestries Reported - Czech (%)
Ancestries Reported - Danish (%)
Ancestries Reported - Dutch (%)
Ancestries Reported - English (%)
Ancestries Reported - French (%)
Ancestries Reported - French Canadian (%)
Ancestries Reported - German (%)
Ancestries Reported - Greek (%)
Ancestries Reported - Hungarian (%)
Ancestries Reported - Irish (%)
Ancestries Reported - Italian (%)
Ancestries Reported - Lithuanian (%)
Ancestries Reported - Norwegian (%)
Ancestries Reported - Polish (%)
Ancestries Reported - Portuguese (%)
Ancestries Reported - Russian (%)
Ancestries Reported - Scotch-Irish (%)
Ancestries Reported - Scottish (%)
Ancestries Reported - Slovak (%)
Ancestries Reported - Subsaharan African (%)
Ancestries Reported - Swedish (%)
Ancestries Reported - Swiss (%)
Ancestries Reported - Ukrainian (%)
Ancestries Reported - United States (%)
Ancestries Reported - Welsh (%)
Ancestries Reported - West Indian (%)
Ancestries Reported - Other (%)
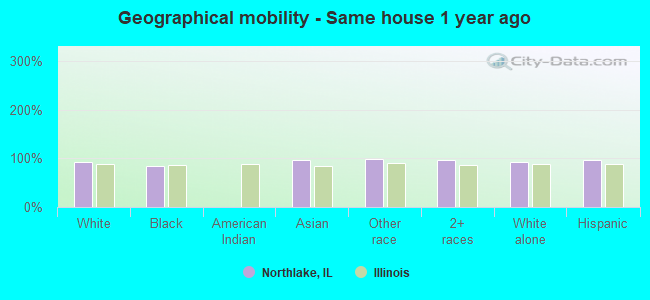
Geographical mobility - Same house 1 year ago (%)
Geographical mobility - Same house 1 year ago (%) - White
Geographical mobility - Same house 1 year ago (%) - Black or African American
Geographical mobility - Same house 1 year ago (%) - Asian
Geographical mobility - Same house 1 year ago (%) - Hispanic or Latino
Geographical mobility - Same house 1 year ago (%) - American Indian and Alaska Native
Geographical mobility - Same house 1 year ago (%) - Multirace
Geographical mobility - Same house 1 year ago (%) - Other Race
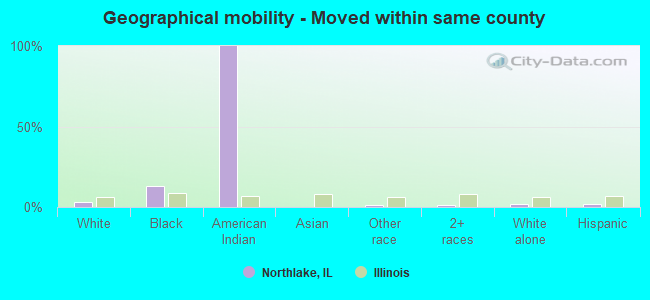
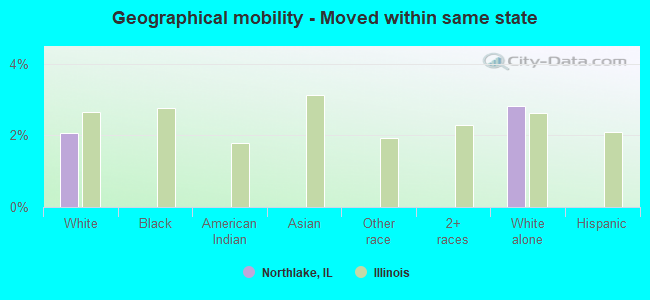
Geographical mobility - Moved within same county (%)
Geographical mobility - Moved within same county (%) - White
Geographical mobility - Moved within same county (%) - Black or African American
Geographical mobility - Moved within same county (%) - Asian
Geographical mobility - Moved within same county (%) - Hispanic or Latino
Geographical mobility - Moved within same county (%) - American Indian and Alaska Native
Geographical mobility - Moved within same county (%) - Multirace
Geographical mobility - Moved within same county (%) - Other Race
Geographical mobility - Moved from different county within same state (%)
Geographical mobility - Moved from different county within same state (%) - White
Geographical mobility - Moved from different county within same state (%) - Black or African American
Geographical mobility - Moved from different county within same state (%) - Asian
Geographical mobility - Moved from different county within same state (%) - Hispanic or Latino
Geographical mobility - Moved from different county within same state (%) - American Indian and Alaska Native
Geographical mobility - Moved from different county within same state (%) - Multirace
Geographical mobility - Moved from different county within same state (%) - Other Race
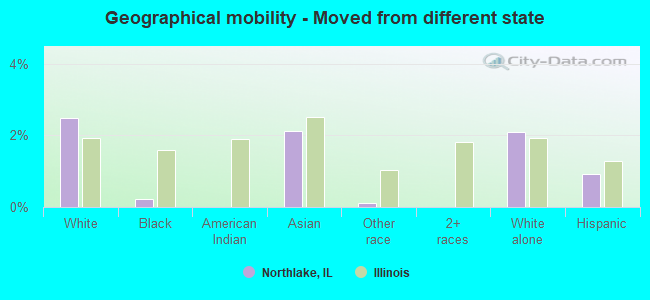
Geographical mobility - Moved from different state (%)
Geographical mobility - Moved from different state (%) - White
Geographical mobility - Moved from different state (%) - Black or African American
Geographical mobility - Moved from different state (%) - Asian
Geographical mobility - Moved from different state (%) - Hispanic or Latino
Geographical mobility - Moved from different state (%) - American Indian and Alaska Native
Geographical mobility - Moved from different state (%) - Multirace
Geographical mobility - Moved from different state (%) - Other Race
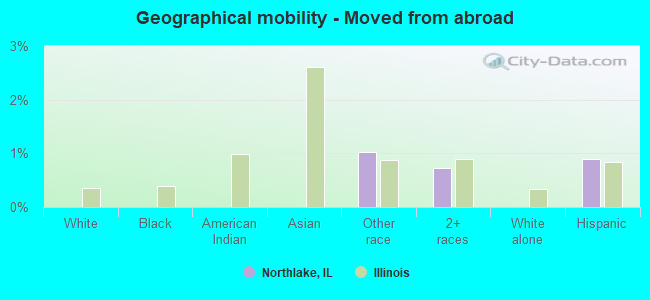
Geographical mobility - Moved from abroad (%)
Geographical mobility - Moved from abroad (%) - White
Geographical mobility - Moved from abroad (%) - Black or African American
Geographical mobility - Moved from abroad (%) - Asian
Geographical mobility - Moved from abroad (%) - Hispanic or Latino
Geographical mobility - Moved from abroad (%) - American Indian and Alaska Native
Geographical mobility - Moved from abroad (%) - Multirace
Geographical mobility - Moved from abroad (%) - Other Race
Place of birth for the foreign-born population - Ireland (%)
Place of birth for the foreign-born population - Denmark (%)
Place of birth for the foreign-born population - Norway (%)
Place of birth for the foreign-born population - Sweden (%)
Place of birth for the foreign-born population - United Kingdom (%)
Place of birth for the foreign-born population - England (%)
Place of birth for the foreign-born population - Scotland (%)
Place of birth for the foreign-born population - Other Northern Europe (%)
Place of birth for the foreign-born population - Austria (%)
Place of birth for the foreign-born population - Belgium (%)
Place of birth for the foreign-born population - France (%)
Place of birth for the foreign-born population - Germany (%)
Place of birth for the foreign-born population - Netherlands (%)
Place of birth for the foreign-born population - Switzerland (%)
Place of birth for the foreign-born population - Other Western Europe (%)
Place of birth for the foreign-born population - Greece (%)
Place of birth for the foreign-born population - Italy (%)
Place of birth for the foreign-born population - Portugal (%)
Place of birth for the foreign-born population - Spain (%)
Place of birth for the foreign-born population - Other Southern Europe (%)
Place of birth for the foreign-born population - Albania (%)
Place of birth for the foreign-born population - Belarus (%)
Place of birth for the foreign-born population - Bosnia and Herzegovina (%)
Place of birth for the foreign-born population - Bulgaria (%)
Place of birth for the foreign-born population - Croatia (%)
Place of birth for the foreign-born population - Czechoslovakia (%)
Place of birth for the foreign-born population - Hungary (%)
Place of birth for the foreign-born population - Latvia (%)
Place of birth for the foreign-born population - Lithuania (%)
Place of birth for the foreign-born population - North Macedonia (Macedonia) (%)
Place of birth for the foreign-born population - Moldova (%)
Place of birth for the foreign-born population - Poland (%)
Place of birth for the foreign-born population - Romania (%)
Place of birth for the foreign-born population - Russia (%)
Place of birth for the foreign-born population - Serbia (%)
Place of birth for the foreign-born population - Ukraine (%)
Place of birth for the foreign-born population - Other Eastern Europe (%)
Place of birth for the foreign-born population - China (%)
Place of birth for the foreign-born population - Hong Kong (%)
Place of birth for the foreign-born population - Taiwan (%)
Place of birth for the foreign-born population - Japan (%)
Place of birth for the foreign-born population - Korea (%)
Place of birth for the foreign-born population - Other Eastern Asia (%)
Place of birth for the foreign-born population - Afghanistan (%)
Place of birth for the foreign-born population - Bangladesh (%)
Place of birth for the foreign-born population - India (%)
Place of birth for the foreign-born population - Iran (%)
Place of birth for the foreign-born population - Kazakhstan (%)
Place of birth for the foreign-born population - Nepal (%)
Place of birth for the foreign-born population - Pakistan (%)
Place of birth for the foreign-born population - Sri Lanka (%)
Place of birth for the foreign-born population - Uzbekistan (%)
Place of birth for the foreign-born population - Other South Central Asia (%)
Place of birth for the foreign-born population - Burma (%)
Place of birth for the foreign-born population - Cambodia (%)
Place of birth for the foreign-born population - Indonesia (%)
Place of birth for the foreign-born population - Laos (%)
Place of birth for the foreign-born population - Malaysia (%)
Place of birth for the foreign-born population - Philippines (%)
Place of birth for the foreign-born population - Singapore (%)
Place of birth for the foreign-born population - Thailand (%)
Place of birth for the foreign-born population - Vietnam (%)
Place of birth for the foreign-born population - Other South Eastern Asia (%)
Place of birth for the foreign-born population - Armenia (%)
Place of birth for the foreign-born population - Iraq (%)
Place of birth for the foreign-born population - Israel (%)
Place of birth for the foreign-born population - Jordan (%)
Place of birth for the foreign-born population - Kuwait (%)
Place of birth for the foreign-born population - Lebanon (%)
Place of birth for the foreign-born population - Saudi Arabia (%)
Place of birth for the foreign-born population - Syria (%)
Place of birth for the foreign-born population - Turkey (%)
Place of birth for the foreign-born population - Yemen (%)
Place of birth for the foreign-born population - Other Western Asia (%)
Place of birth for the foreign-born population - Eritrea (%)
Place of birth for the foreign-born population - Ethiopia (%)
Place of birth for the foreign-born population - Kenya (%)
Place of birth for the foreign-born population - Somalia (%)
Place of birth for the foreign-born population - Uganda (%)
Place of birth for the foreign-born population - Zimbabwe (%)
Place of birth for the foreign-born population - Other Eastern Africa (%)
Place of birth for the foreign-born population - Cameroon (%)
Place of birth for the foreign-born population - Congo (%)
Place of birth for the foreign-born population - Democratic Republic of Congo (Zaire) (%)
Place of birth for the foreign-born population - Other Middle Africa (%)
Place of birth for the foreign-born population - Egypt (%)
Place of birth for the foreign-born population - Morocco (%)
Place of birth for the foreign-born population - Sudan (%)
Place of birth for the foreign-born population - Other Northern Africa (%)
Place of birth for the foreign-born population - South Africa (%)
Place of birth for the foreign-born population - Other Southern Africa (%)
Place of birth for the foreign-born population - Cabo Verde (%)
Place of birth for the foreign-born population - Ghana (%)
Place of birth for the foreign-born population - Liberia (%)
Place of birth for the foreign-born population - Nigeria (%)
Place of birth for the foreign-born population - Senegal (%)
Place of birth for the foreign-born population - Sierra Leone (%)
Place of birth for the foreign-born population - Other Western Africa (%)
Place of birth for the foreign-born population - Australia (%)
Place of birth for the foreign-born population - New Zealand (%)
Place of birth for the foreign-born population - Fiji (%)
Place of birth for the foreign-born population - Micronesia (%)
Place of birth for the foreign-born population - Bahamas (%)
Place of birth for the foreign-born population - Barbados (%)
Place of birth for the foreign-born population - Cuba (%)
Place of birth for the foreign-born population - Dominica (%)
Place of birth for the foreign-born population - Dominican Republic (%)
Place of birth for the foreign-born population - Grenada (%)
Place of birth for the foreign-born population - Haiti (%)
Place of birth for the foreign-born population - Jamaica (%)
Place of birth for the foreign-born population - St. Vincent and the Grenadines (%)
Place of birth for the foreign-born population - Trinidad and Tobago (%)
Place of birth for the foreign-born population - West Indies (%)
Place of birth for the foreign-born population - Other Caribbean (%)
Place of birth for the foreign-born population - Belize (%)
Place of birth for the foreign-born population - Costa Rica (%)
Place of birth for the foreign-born population - El Salvador (%)
Place of birth for the foreign-born population - Guatemala (%)
Place of birth for the foreign-born population - Honduras (%)
Place of birth for the foreign-born population - Mexico (%)
Place of birth for the foreign-born population - Nicaragua (%)
Place of birth for the foreign-born population - Panama (%)
Place of birth for the foreign-born population - Other Central America (%)
Place of birth for the foreign-born population - Argentina (%)
Place of birth for the foreign-born population - Bolivia (%)
Place of birth for the foreign-born population - Brazil (%)
Place of birth for the foreign-born population - Chile (%)
Place of birth for the foreign-born population - Colombia (%)
Place of birth for the foreign-born population - Ecuador (%)
Place of birth for the foreign-born population - Guyana (%)
Place of birth for the foreign-born population - Peru (%)
Place of birth for the foreign-born population - Uruguay (%)
Place of birth for the foreign-born population - Venezuela (%)
Place of birth for the foreign-born population - Other South America (%)
Place of birth for the foreign-born population - Canada (%)
Place of birth for the foreign-born population - Other Northern America (%)
Place of birth for the foreign-born population - Other (%)
Latest news about races in Northlake, IL collected exclusively by city-data.com from local newspapers, TV, and radio stations
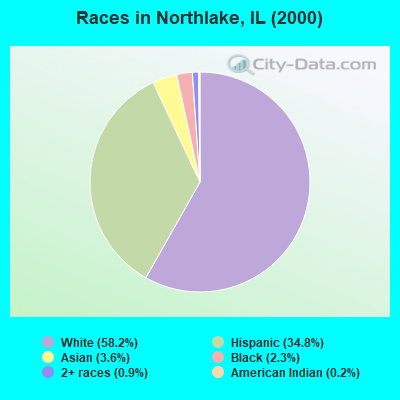
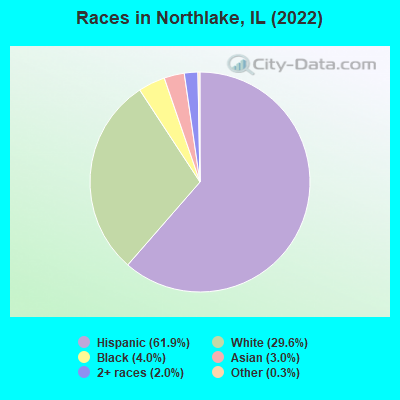
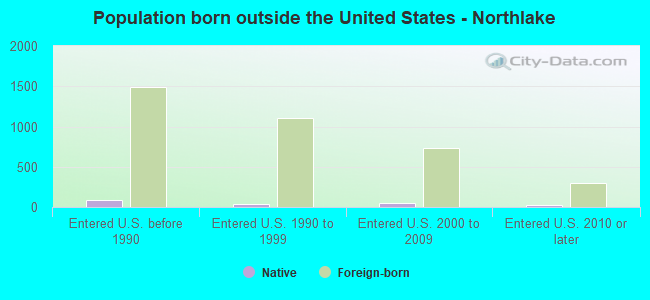
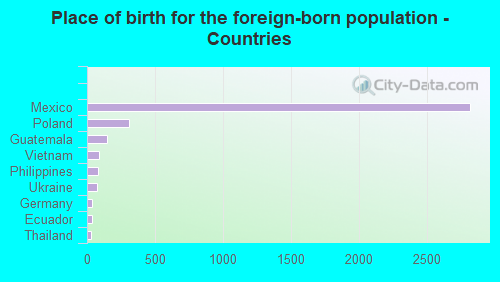
According to 2022 data, the most numerous races in Northlake, IL are White alone (3,670 residents), Hispanic (7,673 residents), and Black alone (498 residents). 42.1% of Northlake residents speak English at home. 30.2% of Northlake, IL residents are foreign-born (24.3% born in Latin America, 3.5% born in Europe), which is 53.6% greater than the foreign-born rate of 14.0% across the entire state of Illinois.
Race distribution in Northlake
2000 2022
8,424,140 67.8% White alone 1,856,152 14.9% Black alone 1,530,262 12.3% Hispanic 419,916 3.4% Asian alone 153,996 1.2% Two or more races 13,479 0.1% Other race alone 18,232 0.1% American Indian alone 3,116 0.03% Native Hawaiian and Other
7,356,301 58.5% White alone 2,299,726 18.3% Hispanic 1,660,423 13.2% Black alone 747,296 5.9% Asian alone 458,599 3.6% Two or more races 45,386 0.4% Other race alone 10,405 0.08% American Indian alone 3,896 0.03% Native Hawaiian and Other
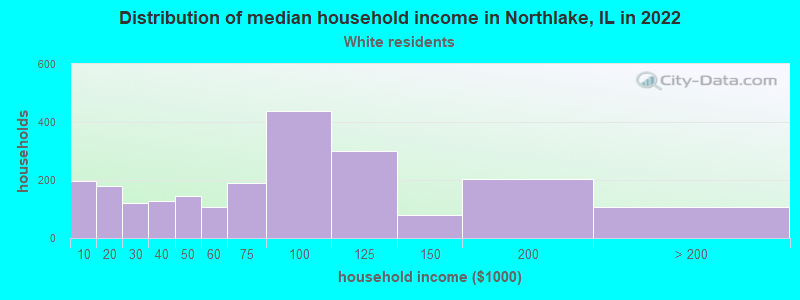
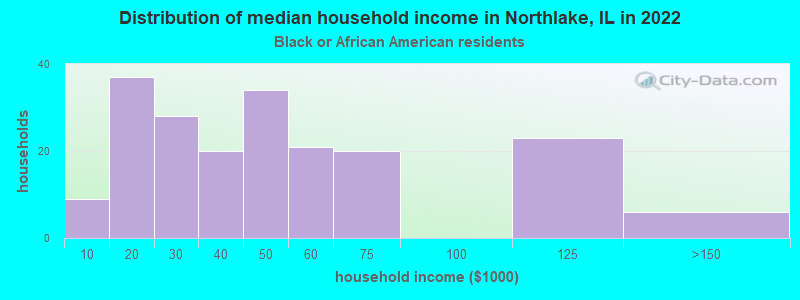
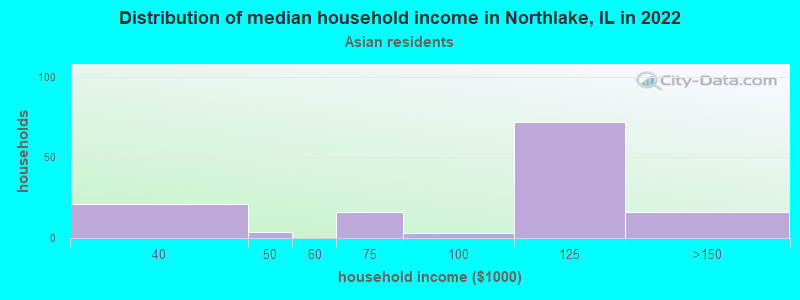
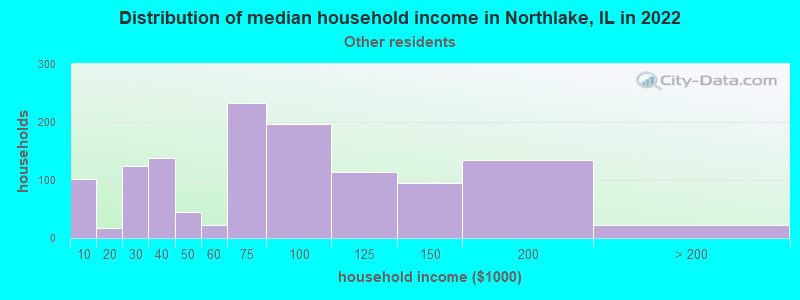
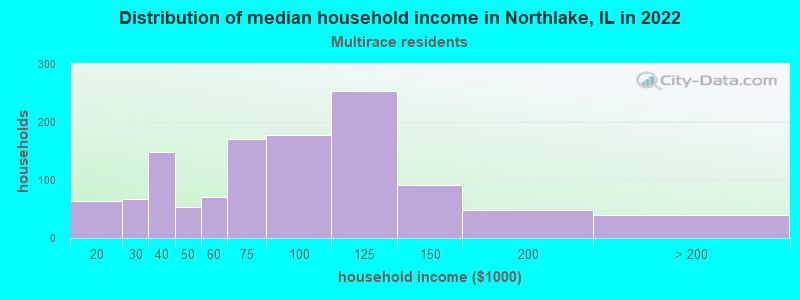
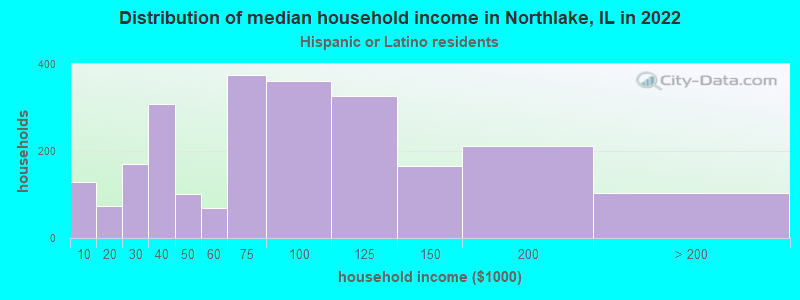
Income and house value in Northlake Median household income in 2022 $73,356 White non-Hispanic householders$39,111 Black householders$102,101 Asian householders$73,897 Some other race householders$80,618 Two or more races householders$73,637 Hispanic or Latino race householdersMedian 2022 house value $233,949 White Non-Hispanic householders $247,417 Asian householders$262,610 Some other race householders$237,402 Two or more races householders$247,071 Hispanic or Latino householders
Median age by race in Northlake
48.6 Median age for White residents49.6 46.7 55.5 Median age for Black or African American residents42.9 61.3 -680,473,372.1 Median age for American Indian / Alaska Native residents-736,736,736.0 -641,399,416.3 50.1 Median age for Asian residents60.1 49.8 -687,999,999.3 Median age for Native Hawaiian / Pacific Islander residents-918,721,460.3 -610,229,276.3 30.2 Median age for Other race residents28.6 31.0 40.0 Median age for Two or more races residents37.4 44.7 54.8 Median age for White alone residents54.2 56.6 33.3 Median age for Hispanic or Latino residents33.2 33.4
Owner/renter occupied households by race in Northlake
House owners and renters - White residents 1,536 70.5% Owner occupied643 29.5% Renter occupiedHouse owners and renters - Black or African American residents 26 13.1% Owner occupied174 86.9% Renter occupiedHouse owners and renters - Asian residents 145 96.8% Owner occupied5 3.2% Renter occupiedHouse owners and renters - Other race residents 804 62.1% Owner occupied491 37.9% Renter occupiedHouse owners and renters - Two or more races residents 911 76.3% Owner occupied283 23.7% Renter occupiedHouse owners and renters - White alone residents 1,226 67.5% Owner occupied589 32.5% Renter occupiedHouse owners and renters - Hispanic or Latino residents 1,699 69.9% Owner occupied731 30.1% Renter occupied
Language usage in Northlake
English speakers - Total 42.1% of residents of Northlake speak English at home.
50.2% of residents speak Spanish at home 3,256 53.7% Speak English very well2,812 46.3% Speak English less than very well8.1% of residents speak other language at home 541 55.1% Speak English very well441 44.9% Speak English less than very well
English speakers - Born in the United States 72.5% of residents of Northlake speak English at home.
23.3% of residents speak Spanish at home 140 76.5% Speak English very well43 23.5% Speak English less than very well3.3% of residents speak other language at home 26 100.0% Speak English less than very well
English speakers - Native, born elsewhere 53.7% of residents of Northlake speak English at home.
43.6% of residents speak Spanish at home 12 12.6% Speak English very well83 87.4% Speak English less than very well
English speakers - Foreign-born 2.8% of residents of Northlake speak English at home.
80.9% of residents speak Spanish at home 813 26.9% Speak English very well2,211 73.1% Speak English less than very well17.4% of residents speak other language at home 242 37.2% Speak English very well408 62.8% Speak English less than very well
White (Caucasian) - Speak only English Native:
78.5% (3,101)Foreign-born:
4.4% (34)
White (Caucasian) - Speak another language Native:
18.5% (731)Foreign-born:
94.8% (721)
Asian - Speak another language Native:
68.9% (87)Foreign-born:
100.0% (255)
Other race - Speak only English Native:
34.8% (861)Foreign-born:
2.8% (46)
Other race - Speak another language Native:
66.0% (1,632)Foreign-born:
97.4% (1,603)
Two or more races - Speak only English Native:
42.0% (768)Foreign-born:
2.3% (36)
Two or more races - Speak another language Native:
59.1% (1,080)Foreign-born:
97.7% (1,536)
White alone - Speak only English Native:
90.8% (2,927)Foreign-born:
7.1% (30)
White alone - Speak another language Native:
9.3% (301)Foreign-born:
93.8% (400)
Hispanic or Latino - Speak only English Native:
32.3% (1,406)Foreign-born:
1.8% (54)
Hispanic or Latino - Speak another language Native:
67.6% (2,940)Foreign-born:
98.6% (3,024)
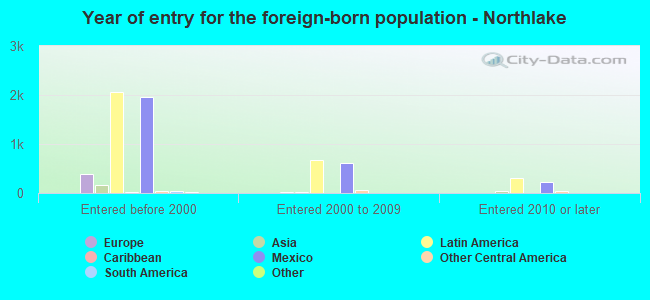
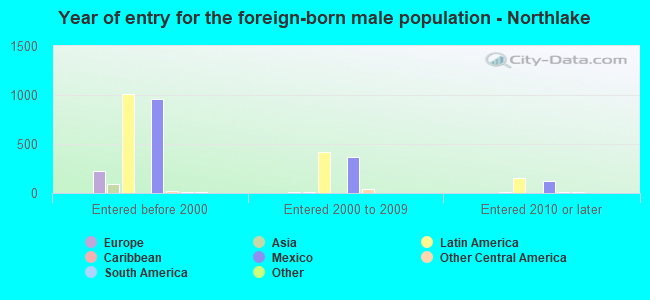
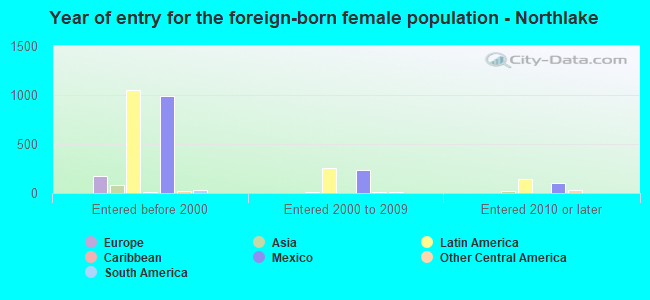
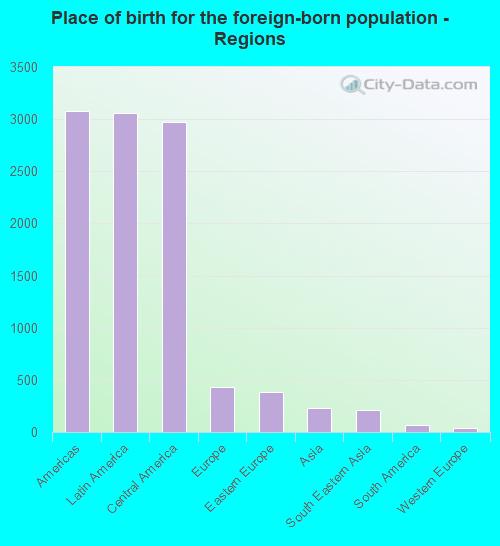
Foreign-born residents in Northlake 3,741 residents are foreign born (24.3% Latin America , 3.5% Europe ).
This city:
30.2%Illinois:
14.1%
Marital status for residents in Northlake Marital status - White (Caucasian) population 15 years and over
Males 31.4% Never married47.6% Now married0.6% Separated5.1% Widowed15.3% DivorcedFemales 32.2% Never married37.3% Now married3.7% Separated13.0% Widowed13.8% DivorcedWomen who gave birth in the past 12 months Now married:
100.0% (18)Unmarried:
0.0% (0)
Women who did not give birth in the past 12 months Now married:
41.7% (448)Unmarried:
58.3% (628)
Marital status - Black or African American population 15 years and over
Males 57.6% Never married8.3% Now married6.8% Separated1.5% Widowed25.8% DivorcedFemales 52.1% Never married16.1% Now married0.5% Separated23.4% Widowed7.8% DivorcedWomen who did not give birth in the past 12 months Now married:
4.3% (1)Unmarried:
95.7% (21)
Marital status - Asian population 15 years and over
Males 32.5% Never married65.6% Now married0.0% Separated0.0% Widowed1.8% DivorcedFemales 24.2% Never married59.6% Now married0.0% Separated4.5% Widowed11.8% DivorcedWomen who gave birth in the past 12 months Now married:
100.0% (5)Unmarried:
0.0% (0)
Women who did not give birth in the past 12 months Now married:
54.3% (52)Unmarried:
45.7% (43)
Marital status - Other race population 15 years and over
Males 59.7% Never married36.1% Now married0.0% Separated1.0% Widowed3.2% DivorcedFemales 49.7% Never married35.7% Now married0.7% Separated3.5% Widowed10.5% DivorcedWomen who did not give birth in the past 12 months Now married:
31.0% (442)Unmarried:
69.0% (985)
Marital status - Two or more races population 15 years and over
Males 30.1% Never married48.3% Now married12.6% Separated1.1% Widowed7.8% DivorcedFemales 26.6% Never married47.6% Now married3.9% Separated12.8% Widowed9.2% DivorcedWomen who gave birth in the past 12 months Now married:
100.0% (15)Unmarried:
0.0% (0)
Women who did not give birth in the past 12 months Now married:
55.7% (415)Unmarried:
44.3% (330)
Marital status - White alone, not Hispanic / Latino population 15 years and over
Males 29.0% Never married45.6% Now married0.8% Separated5.2% Widowed19.3% DivorcedFemales 28.6% Never married36.0% Now married4.2% Separated16.5% Widowed14.8% DivorcedWomen who did not give birth in the past 12 months Now married:
45.8% (353)Unmarried:
54.2% (418)
Marital status - Hispanic or Latino population 15 years and over
Males 44.8% Never married44.1% Now married4.4% Separated1.4% Widowed5.2% DivorcedFemales 42.4% Never married39.2% Now married1.9% Separated6.0% Widowed10.5% DivorcedWomen who gave birth in the past 12 months Now married:
100.0% (32)Unmarried:
0.0% (0)
Women who did not give birth in the past 12 months Now married:
36.5% (801)Unmarried:
63.5% (1,391)
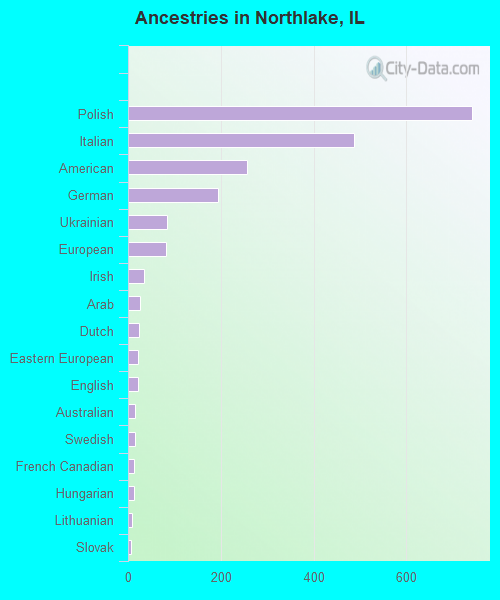
Ancestries in Northlake
741 8.8% Polish488 5.8% Italian256 3.1% American193 2.3% German83 1.0% Ukrainian81 1.0% European34 0.4% Irish26 0.3% Arab24 0.3% Dutch21 0.3% Eastern European21 0.3% English16 0.2% Australian15 0.2% Swedish13 0.2% French Canadian13 0.2% Hungarian8 0.10% Lithuanian7 0.08% Slovak2 0.02% Canadian2 0.02% Greek
Children Nativity (place of birth) in Northlake
Children under 6 years - Living with two parents Both parents foreign-born 62 100.0% NativeOne native, one foreign-born parent 114 100.0% NativeChildren under 6 years - Living with one parent Native parent 259 100.0% NativeForeign-born parent 78 100.0% NativeChildren 6 to 17 years - Living with two parents Both parents native 219 100.0% NativeBoth parents foreign-born 362 91.6% Native33 8.4% Foreign-bornOne native, one foreign-born parent 405 100.0% NativeChildren 6 to 17 years - Living with one parent Native parent 366 100.0% NativeForeign-born parent 751 54.4% Native629 45.6% Foreign-born
Grandparents responsible for own grandchildren in Northlake
Grandparents (30 to 59 years) White / Caucasian 13 33.2% Responsible for grandchildren26 66.8% Not responsible for grandchildrenAsian 4 100.0% Not responsible for grandchildrenOther race 28 53.2% Responsible for grandchildren24 46.8% Not responsible for grandchildrenTwo or more races 49 62.7% Responsible for grandchildren29 37.3% Not responsible for grandchildrenWhite alone, not Hispanic / Latino 16 100.0% Not responsible for grandchildrenHispanic or Latino 83 61.0% Responsible for grandchildren53 39.0% Not responsible for grandchildren
Grandparents (60 years and over) White / Caucasian 73 100.0% Not responsible for grandchildrenOther race 44 100.0% Not responsible for grandchildrenTwo or more races 45 100.0% Not responsible for grandchildrenWhite alone, not Hispanic / Latino 60 100.0% Not responsible for grandchildrenHispanic or Latino 98 100.0% Not responsible for grandchildren