Races in Northwest Leon, Florida (FL) Detailed Stats
Ancestries, Foreign-born residents, place of birth
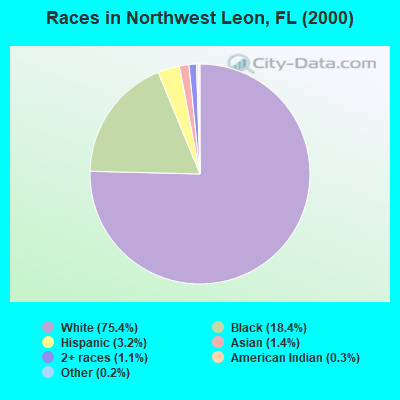
Race distribution in Northwest Leon

- 15,93175.4%White alone
- 3,88318.4%Black alone
- 6783.2%Hispanic
- 3001.4%Asian alone
- 2381.1%Two or more races
- 530.3%American Indian alone
- 330.2%Other race alone
- 50.02%Native Hawaiian and Other
Pacific Islander alone
2000
2022
-
- 10,458,50965.4%White alone
- 2,682,71516.8%Hispanic
- 2,264,26814.2%Black alone
- 261,6931.6%Asian alone
- 236,9541.5%Two or more races
- 42,3580.3%American Indian alone
- 28,9940.2%Other race alone
- 6,8870.04%Native Hawaiian and Other
Pacific Islander alone

-
- 11,309,40350.8%White alone
- 6,025,03927.1%Hispanic
- 3,241,01514.6%Black alone
- 861,6303.9%Two or more races
- 623,6922.8%Asian alone
- 152,0540.7%Other race alone
- 22,5040.1%American Indian alone
- 9,4860.04%Native Hawaiian and Other
Pacific Islander alone

Income and house value in Northwest Leon
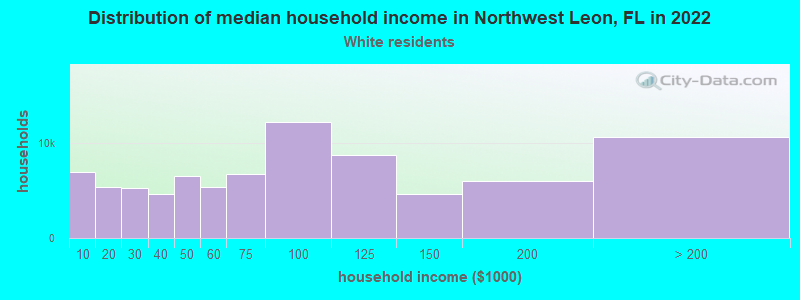
- Median household income in 2022
- $87,082White non-Hispanic householders
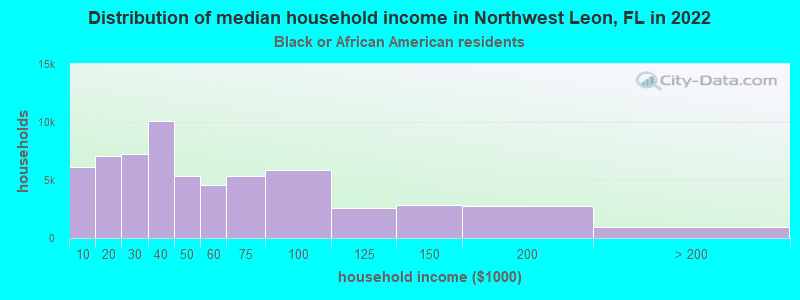
- $67,573Black householders
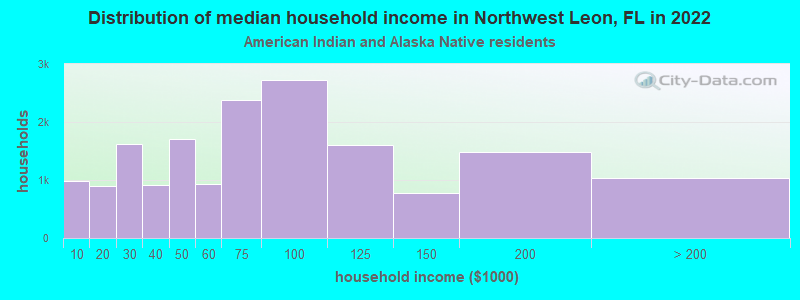
- $45,359American Indian and Alaska Native householders
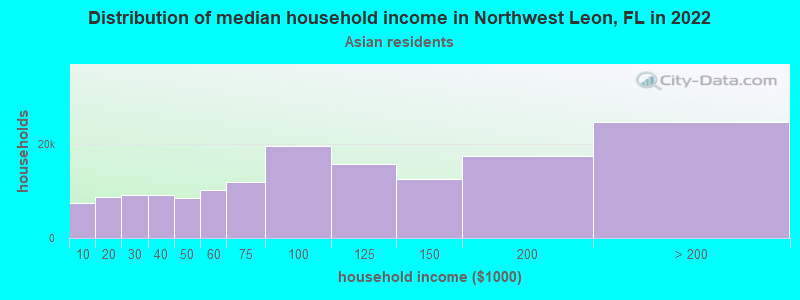
- $119,918Asian householders
- over $200,000Some other race householders
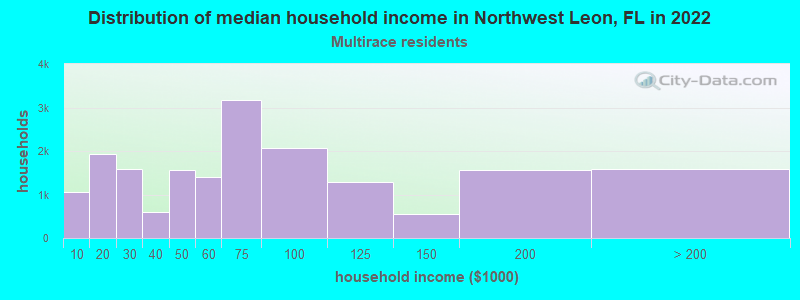
- $199,665Two or more races householders
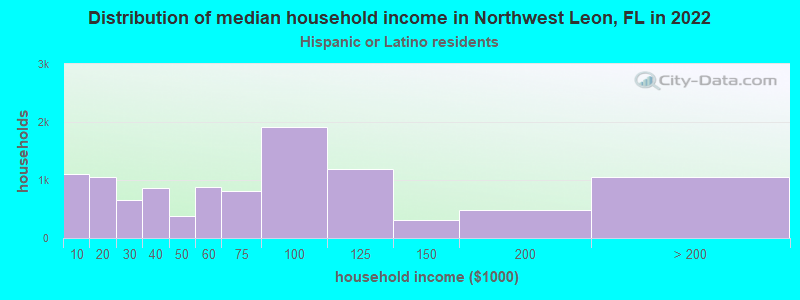
- $99,210Hispanic or Latino race householders
- Median 2022 house value
- $300,855White Non-Hispanic householders
- $275,402Black or African American householders
- $250,522Asian householders
- $321,732Some other race householders
- $223,925Two or more races householders
- $263,391Hispanic or Latino householders
Household income for White non-Hispanic householders
Household income for Black householders
Household income for American Indian and Alaska Native householders
Household income for Asian householders
Household income for Two or more races householders
Household income for Hispanic or Latino race householders
Zip code: 32303