Races in Northwest Pittsburg, Oklahoma (OK) Detailed Stats
Ancestries, Foreign-born residents, place of birth
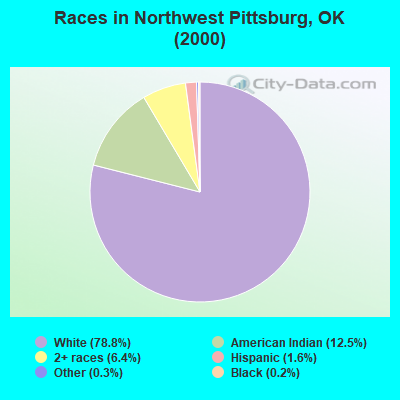
Race distribution in Northwest Pittsburg

- 1,86078.8%White alone
- 29512.5%American Indian alone
- 1516.4%Two or more races
- 371.6%Hispanic
- 80.3%Other race alone
- 50.2%Black alone
- 20.08%Asian alone
- 10.04%Native Hawaiian and Other
Pacific Islander alone
2000
2022
-
- 2,556,36874.1%White alone
- 266,1587.7%American Indian alone
- 257,9817.5%Black alone
- 179,3045.2%Hispanic
- 140,2494.1%Two or more races
- 46,1721.3%Asian alone
- 2,3220.07%Other race alone
- 2,1000.06%Native Hawaiian and Other
Pacific Islander alone

-
- 2,517,40362.6%White alone
- 486,69212.1%Hispanic
- 364,4539.1%Two or more races
- 273,6506.8%American Indian alone
- 268,5436.7%Black alone
- 92,6722.3%Asian alone
- 10,7860.3%Other race alone
- 5,6010.1%Native Hawaiian and Other
Pacific Islander alone

Income and house value in Northwest Pittsburg
- Median household income in 2022
- $59,823White non-Hispanic householders
- $13,804Black householders
- $50,614American Indian and Alaska Native householders
- $125,861Some other race householders
- $38,295Two or more races householders
- $85,210Hispanic or Latino race householders
- Median 2022 house value
- $152,091White Non-Hispanic householders
- $37,131Black or African American householders
- $163,379American Indian or Alaska Native householders
- $106,345Two or more races householders
- $81,689Hispanic or Latino householders
Household income for White non-Hispanic householders

Household income for Black householders

Household income for American Indian and Alaska Native householders

Household income for Two or more races householders

Household income for Hispanic or Latino race householders

Zip code: 74501