Races in Northwest Rockwall, Texas (TX) Detailed Stats
Ancestries, Foreign-born residents, place of birth
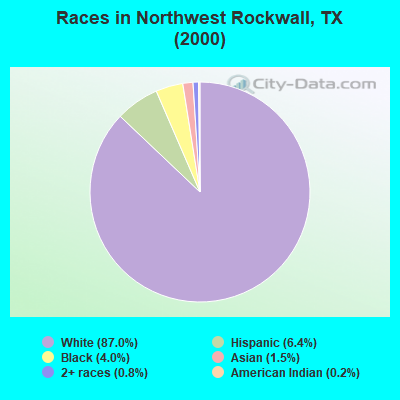
Race distribution in Northwest Rockwall

- 19,04987.0%White alone
- 1,3926.4%Hispanic
- 8734.0%Black alone
- 3351.5%Asian alone
- 1790.8%Two or more races
- 500.2%American Indian alone
- 120.05%Other race alone
- 30.01%Native Hawaiian and Other
Pacific Islander alone
2000
2022
-
- 10,933,31352.4%White alone
- 6,669,66632.0%Hispanic
- 2,364,25511.3%Black alone
- 554,4452.7%Asian alone
- 230,5671.1%Two or more races
- 68,8590.3%American Indian alone
- 19,9580.10%Other race alone
- 10,7570.05%Native Hawaiian and Other
Pacific Islander alone

-
- 12,070,64240.2%Hispanic
- 11,683,43038.9%White alone
- 3,508,70611.7%Black alone
- 1,608,1735.4%Asian alone
- 956,5603.2%Two or more races
- 125,7630.4%Other race alone
- 47,0230.2%American Indian alone
- 29,2750.10%Native Hawaiian and Other
Pacific Islander alone

Income and house value in Northwest Rockwall
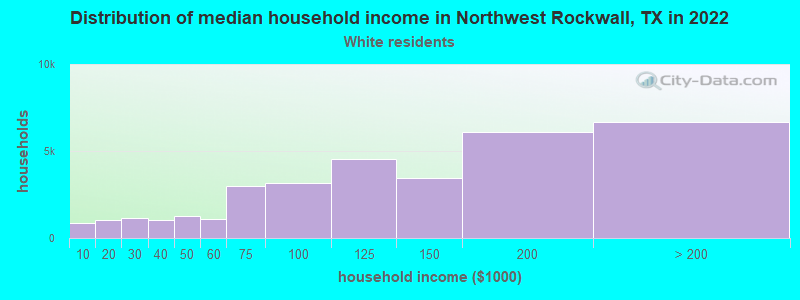
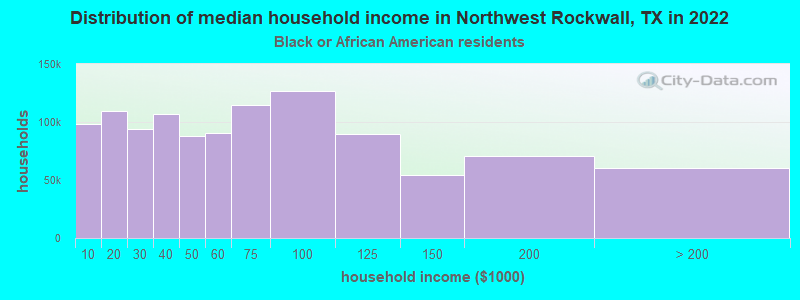
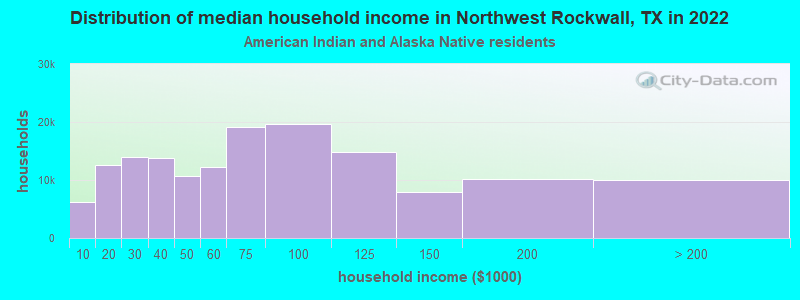
- Median household income in 2022
- $126,376White non-Hispanic householders
- $155,006Black householders
- over $200,000American Indian and Alaska Native householders
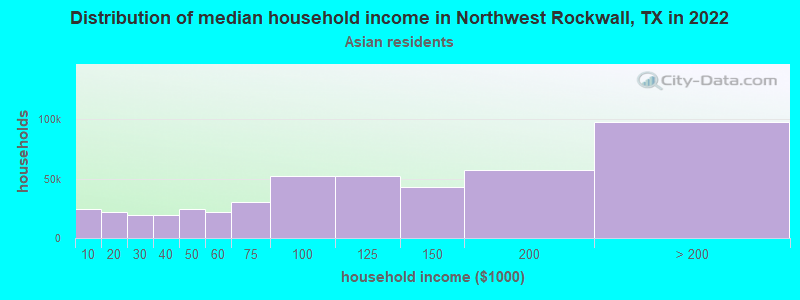
- $118,983Asian householders
- $103,542Some other race householders
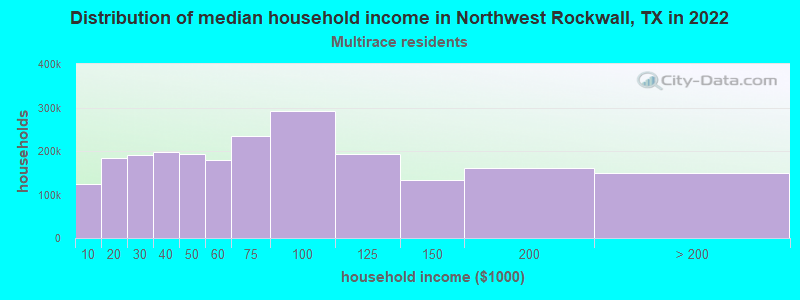
- $180,082Two or more races householders
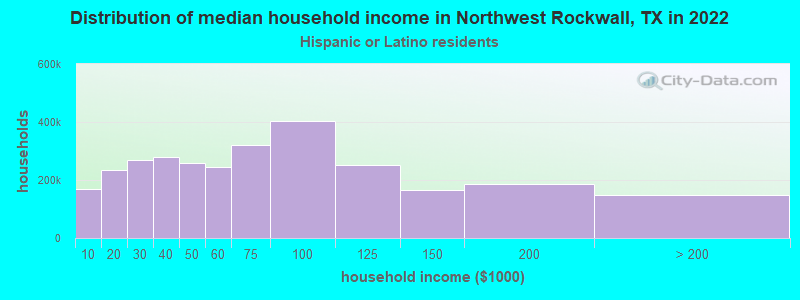
- $131,236Hispanic or Latino race householders
- Median 2022 house value
- $435,600White Non-Hispanic householders
- $399,871Black or African American householders
- $414,163American Indian or Alaska Native householders
- $504,975Asian householders
- $373,967Some other race householders
- $287,919Two or more races householders
- $418,927Hispanic or Latino householders
Household income for White non-Hispanic householders
Household income for Black householders
Household income for American Indian and Alaska Native householders
Household income for Asian householders
Household income for Two or more races householders
Household income for Hispanic or Latino race householders
Zip code: 75087