Races in Northwest Snohomish, Washington (WA) Detailed Stats
Ancestries, Foreign-born residents, place of birth

Discuss Northwest Snohomish, Washington races on our local forum with over 2,400,000 registered users
2.7% of Northwest Snohomish, WA residents are foreign-born (1.5% born in Europe, 0.8% born in Asia, 0.4% born in Latin America), which is 462.1% less than the foreign-born rate of 15.0% across the entire state of Washington.
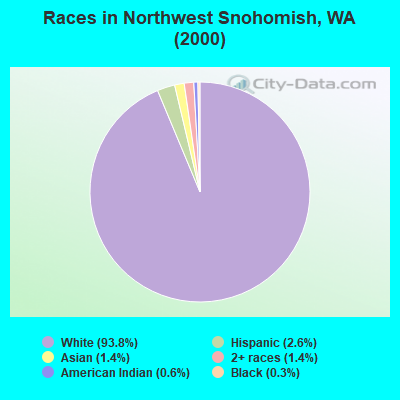
Race distribution in Northwest Snohomish

- 1,93393.8%White alone
- 532.6%Hispanic
- 281.4%Asian alone
- 281.4%Two or more races
- 120.6%American Indian alone
- 60.3%Black alone
- 10.05%Native Hawaiian and Other
Pacific Islander alone
2000
2022
-
- 4,652,49078.9%White alone
- 441,5097.5%Hispanic
- 319,4015.4%Asian alone
- 184,6313.1%Black alone
- 175,9263.0%Two or more races
- 85,3961.4%American Indian alone
- 22,7790.4%Native Hawaiian and Other
Pacific Islander alone - 11,9890.2%Other race alone

-
- 4,941,45663.5%White alone
- 1,093,31314.0%Hispanic
- 755,8329.7%Asian alone
- 523,4486.7%Two or more races
- 299,5373.8%Black alone
- 69,0240.9%American Indian alone
- 52,2310.7%Native Hawaiian and Other
Pacific Islander alone - 50,9450.7%Other race alone

Income and house value in Northwest Snohomish
- Median household income in 2022
- $126,452White non-Hispanic householders
- $9,037American Indian and Alaska Native householders
- $162,311Asian householders
- $124,602Some other race householders
- $111,918Two or more races householders
- $175,030Hispanic or Latino race householders
- Median 2022 house value
- $746,477White Non-Hispanic householders
- $709,040Asian householders
- over $1,000,000Some other race householders
- $359,247Two or more races householders
- $375,507Hispanic or Latino householders
Household income for White non-Hispanic householders

Household income for American Indian and Alaska Native householders

Household income for Asian householders

Household income for Two or more races householders

Household income for Hispanic or Latino race householders

Foreign-born residents in Northwest Snohomish
55 residents are foreign born (1.5% Europe, 0.8% Asia, 0.4% Latin America).
| This city: | 2.7% |
| Washington: | 10.4% |
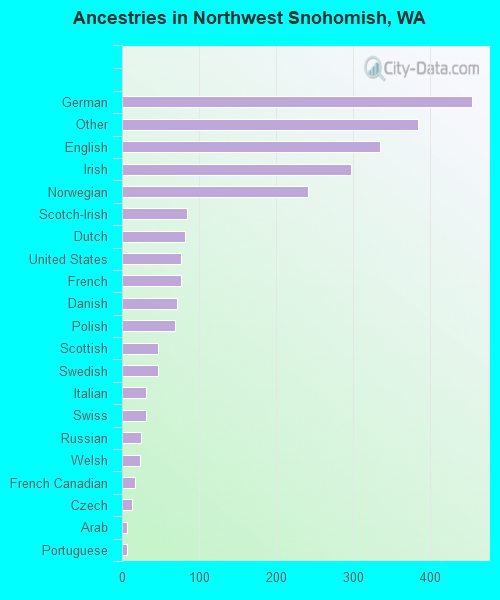
Ancestries in Northwest Snohomish

- 45418.8%German
- 38515.9%Other
- 33513.8%English
- 29712.3%Irish
- 24110.0%Norwegian
- 843.5%Scotch-Irish
- 823.4%Dutch
- 773.2%United States
- 763.1%French
- 712.9%Danish
- 692.9%Polish
- 471.9%Scottish
- 471.9%Swedish
- 311.3%Italian
- 311.3%Swiss
- 251.0%Russian
- 231.0%Welsh
- 170.7%French Canadian
- 130.5%Czech
- 70.3%Arab
- 70.3%Portuguese
Zip codes: 98290.