Races in Norton Shores, Michigan (MI) Detailed Stats
Data:
Races - White alone (%)
Races - White alone (% change since 2000)
Races - Black alone (%)
Races - Black alone (% change since 2000)
Races - American Indian alone (%)
Races - American Indian alone (% change since 2000)
Races - Asian alone (%)
Races - Asian alone (% change since 2000)
Races - Hispanic (%)
Races - Hispanic (% change since 2000)
Races - Native Hawaiian and Other Pacific Islander alone (%)
Races - Native Hawaiian and Other Pacific Islander alone (% change since 2000)
Races - Two or more races(%)
Races - Two or more races(% change since 2000)
Races - Other race alone (%)
Races - Other race alone (% change since 2000)
Racial diversity
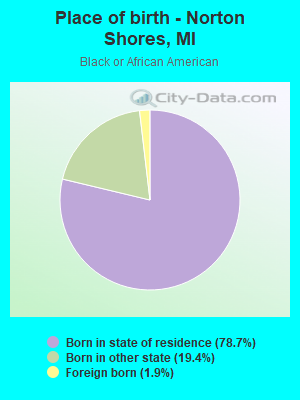
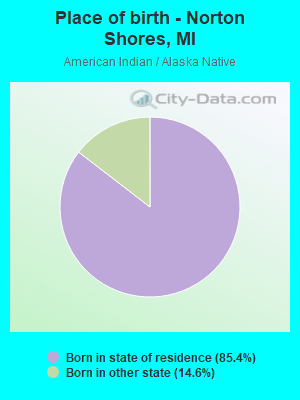
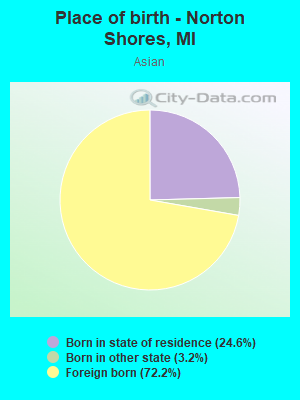
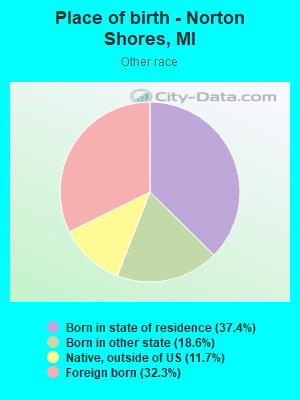
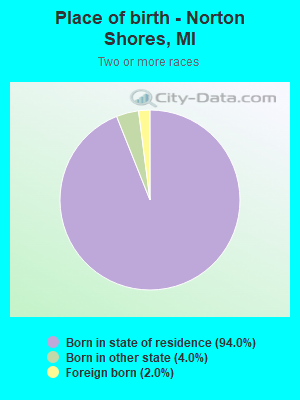
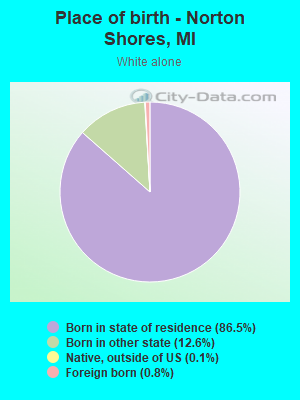
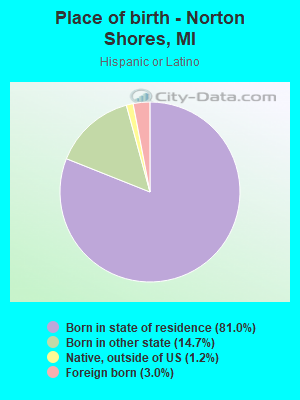
Place of birth - Born in state of residence (%)
Place of birth - Born in state of residence (%) - White
Place of birth - Born in state of residence (%) - Black or African American
Place of birth - Born in state of residence (%) - Asian
Place of birth - Born in state of residence (%) - Hispanic or Latino
Place of birth - Born in state of residence (%) - American Indian and Alaska Native
Place of birth - Born in state of residence (%) - Multirace
Place of birth - Born in state of residence (%) - Other Race
Place of birth - Born in other state (%)
Place of birth - Born in other state (%) - White
Place of birth - Born in other state (%) - Black or African American
Place of birth - Born in other state (%) - Asian
Place of birth - Born in other state (%) - Hispanic or Latino
Place of birth - Born in other state (%) - American Indian and Alaska Native
Place of birth - Born in other state (%) - Multirace
Place of birth - Born in other state (%) - Other Race
Place of birth - Native, outside of US (%)
Place of birth - Native, outside of US (%) - White
Place of birth - Native, outside of US (%) - Black or African American
Place of birth - Native, outside of US (%) - Asian
Place of birth - Native, outside of US (%) - Hispanic or Latino
Place of birth - Native, outside of US (%) - American Indian and Alaska Native
Place of birth - Native, outside of US (%) - Multirace
Place of birth - Native, outside of US (%) - Other Race
Place of birth - Foreign born (%)
Place of birth - Foreign born (%) - White
Place of birth - Foreign born (%) - Black or African American
Place of birth - Foreign born (%) - Asian
Place of birth - Foreign born (%) - Hispanic or Latino
Place of birth - Foreign born (%) - American Indian and Alaska Native
Place of birth - Foreign born (%) - Multirace
Place of birth - Foreign born (%) - Other Race
Residents speaking English at home (%)
Residents speaking English at home - Born in the United States (%)
Residents speaking English at home - Native, born elsewhere (%)
Residents speaking English at home - Foreign born (%)
Residents speaking Spanish at home (%)
Residents speaking Spanish at home - Born in the United States (%)
Residents speaking Spanish at home - Native, born elsewhere (%)
Residents speaking Spanish at home - Foreign born (%)
Residents speaking other language at home (%)
Residents speaking other language at home - Born in the United States (%)
Residents speaking other language at home - Native, born elsewhere (%)
Residents speaking other language at home - Foreign born (%)
Marital status - Never married (%)
Marital status - Now married (%)
Marital status - Separated (%)
Marital status - Widowed (%)
Marital status - Divorced (%)
Ancestries Reported - Arab (%)
Ancestries Reported - Czech (%)
Ancestries Reported - Danish (%)
Ancestries Reported - Dutch (%)
Ancestries Reported - English (%)
Ancestries Reported - French (%)
Ancestries Reported - French Canadian (%)
Ancestries Reported - German (%)
Ancestries Reported - Greek (%)
Ancestries Reported - Hungarian (%)
Ancestries Reported - Irish (%)
Ancestries Reported - Italian (%)
Ancestries Reported - Lithuanian (%)
Ancestries Reported - Norwegian (%)
Ancestries Reported - Polish (%)
Ancestries Reported - Portuguese (%)
Ancestries Reported - Russian (%)
Ancestries Reported - Scotch-Irish (%)
Ancestries Reported - Scottish (%)
Ancestries Reported - Slovak (%)
Ancestries Reported - Subsaharan African (%)
Ancestries Reported - Swedish (%)
Ancestries Reported - Swiss (%)
Ancestries Reported - Ukrainian (%)
Ancestries Reported - United States (%)
Ancestries Reported - Welsh (%)
Ancestries Reported - West Indian (%)
Ancestries Reported - Other (%)
Geographical mobility - Same house 1 year ago (%)
Geographical mobility - Same house 1 year ago (%) - White
Geographical mobility - Same house 1 year ago (%) - Black or African American
Geographical mobility - Same house 1 year ago (%) - Asian
Geographical mobility - Same house 1 year ago (%) - Hispanic or Latino
Geographical mobility - Same house 1 year ago (%) - American Indian and Alaska Native
Geographical mobility - Same house 1 year ago (%) - Multirace
Geographical mobility - Same house 1 year ago (%) - Other Race
Geographical mobility - Moved within same county (%)
Geographical mobility - Moved within same county (%) - White
Geographical mobility - Moved within same county (%) - Black or African American
Geographical mobility - Moved within same county (%) - Asian
Geographical mobility - Moved within same county (%) - Hispanic or Latino
Geographical mobility - Moved within same county (%) - American Indian and Alaska Native
Geographical mobility - Moved within same county (%) - Multirace
Geographical mobility - Moved within same county (%) - Other Race
Geographical mobility - Moved from different county within same state (%)
Geographical mobility - Moved from different county within same state (%) - White
Geographical mobility - Moved from different county within same state (%) - Black or African American
Geographical mobility - Moved from different county within same state (%) - Asian
Geographical mobility - Moved from different county within same state (%) - Hispanic or Latino
Geographical mobility - Moved from different county within same state (%) - American Indian and Alaska Native
Geographical mobility - Moved from different county within same state (%) - Multirace
Geographical mobility - Moved from different county within same state (%) - Other Race
Geographical mobility - Moved from different state (%)
Geographical mobility - Moved from different state (%) - White
Geographical mobility - Moved from different state (%) - Black or African American
Geographical mobility - Moved from different state (%) - Asian
Geographical mobility - Moved from different state (%) - Hispanic or Latino
Geographical mobility - Moved from different state (%) - American Indian and Alaska Native
Geographical mobility - Moved from different state (%) - Multirace
Geographical mobility - Moved from different state (%) - Other Race
Geographical mobility - Moved from abroad (%)
Geographical mobility - Moved from abroad (%) - White
Geographical mobility - Moved from abroad (%) - Black or African American
Geographical mobility - Moved from abroad (%) - Asian
Geographical mobility - Moved from abroad (%) - Hispanic or Latino
Geographical mobility - Moved from abroad (%) - American Indian and Alaska Native
Geographical mobility - Moved from abroad (%) - Multirace
Geographical mobility - Moved from abroad (%) - Other Race
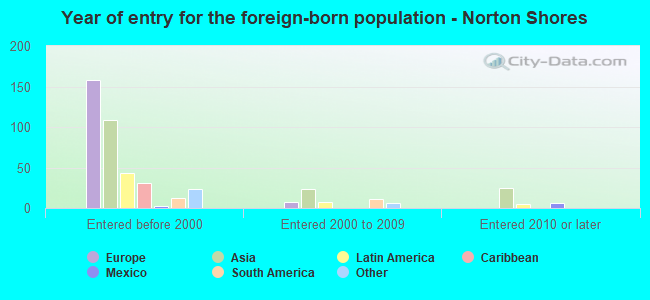
Place of birth for the foreign-born population - Ireland (%)
Place of birth for the foreign-born population - Denmark (%)
Place of birth for the foreign-born population - Norway (%)
Place of birth for the foreign-born population - Sweden (%)
Place of birth for the foreign-born population - United Kingdom (%)
Place of birth for the foreign-born population - England (%)
Place of birth for the foreign-born population - Scotland (%)
Place of birth for the foreign-born population - Other Northern Europe (%)
Place of birth for the foreign-born population - Austria (%)
Place of birth for the foreign-born population - Belgium (%)
Place of birth for the foreign-born population - France (%)
Place of birth for the foreign-born population - Germany (%)
Place of birth for the foreign-born population - Netherlands (%)
Place of birth for the foreign-born population - Switzerland (%)
Place of birth for the foreign-born population - Other Western Europe (%)
Place of birth for the foreign-born population - Greece (%)
Place of birth for the foreign-born population - Italy (%)
Place of birth for the foreign-born population - Portugal (%)
Place of birth for the foreign-born population - Spain (%)
Place of birth for the foreign-born population - Other Southern Europe (%)
Place of birth for the foreign-born population - Albania (%)
Place of birth for the foreign-born population - Belarus (%)
Place of birth for the foreign-born population - Bosnia and Herzegovina (%)
Place of birth for the foreign-born population - Bulgaria (%)
Place of birth for the foreign-born population - Croatia (%)
Place of birth for the foreign-born population - Czechoslovakia (%)
Place of birth for the foreign-born population - Hungary (%)
Place of birth for the foreign-born population - Latvia (%)
Place of birth for the foreign-born population - Lithuania (%)
Place of birth for the foreign-born population - North Macedonia (Macedonia) (%)
Place of birth for the foreign-born population - Moldova (%)
Place of birth for the foreign-born population - Poland (%)
Place of birth for the foreign-born population - Romania (%)
Place of birth for the foreign-born population - Russia (%)
Place of birth for the foreign-born population - Serbia (%)
Place of birth for the foreign-born population - Ukraine (%)
Place of birth for the foreign-born population - Other Eastern Europe (%)
Place of birth for the foreign-born population - China (%)
Place of birth for the foreign-born population - Hong Kong (%)
Place of birth for the foreign-born population - Taiwan (%)
Place of birth for the foreign-born population - Japan (%)
Place of birth for the foreign-born population - Korea (%)
Place of birth for the foreign-born population - Other Eastern Asia (%)
Place of birth for the foreign-born population - Afghanistan (%)
Place of birth for the foreign-born population - Bangladesh (%)
Place of birth for the foreign-born population - India (%)
Place of birth for the foreign-born population - Iran (%)
Place of birth for the foreign-born population - Kazakhstan (%)
Place of birth for the foreign-born population - Nepal (%)
Place of birth for the foreign-born population - Pakistan (%)
Place of birth for the foreign-born population - Sri Lanka (%)
Place of birth for the foreign-born population - Uzbekistan (%)
Place of birth for the foreign-born population - Other South Central Asia (%)
Place of birth for the foreign-born population - Burma (%)
Place of birth for the foreign-born population - Cambodia (%)
Place of birth for the foreign-born population - Indonesia (%)
Place of birth for the foreign-born population - Laos (%)
Place of birth for the foreign-born population - Malaysia (%)
Place of birth for the foreign-born population - Philippines (%)
Place of birth for the foreign-born population - Singapore (%)
Place of birth for the foreign-born population - Thailand (%)
Place of birth for the foreign-born population - Vietnam (%)
Place of birth for the foreign-born population - Other South Eastern Asia (%)
Place of birth for the foreign-born population - Armenia (%)
Place of birth for the foreign-born population - Iraq (%)
Place of birth for the foreign-born population - Israel (%)
Place of birth for the foreign-born population - Jordan (%)
Place of birth for the foreign-born population - Kuwait (%)
Place of birth for the foreign-born population - Lebanon (%)
Place of birth for the foreign-born population - Saudi Arabia (%)
Place of birth for the foreign-born population - Syria (%)
Place of birth for the foreign-born population - Turkey (%)
Place of birth for the foreign-born population - Yemen (%)
Place of birth for the foreign-born population - Other Western Asia (%)
Place of birth for the foreign-born population - Eritrea (%)
Place of birth for the foreign-born population - Ethiopia (%)
Place of birth for the foreign-born population - Kenya (%)
Place of birth for the foreign-born population - Somalia (%)
Place of birth for the foreign-born population - Uganda (%)
Place of birth for the foreign-born population - Zimbabwe (%)
Place of birth for the foreign-born population - Other Eastern Africa (%)
Place of birth for the foreign-born population - Cameroon (%)
Place of birth for the foreign-born population - Congo (%)
Place of birth for the foreign-born population - Democratic Republic of Congo (Zaire) (%)
Place of birth for the foreign-born population - Other Middle Africa (%)
Place of birth for the foreign-born population - Egypt (%)
Place of birth for the foreign-born population - Morocco (%)
Place of birth for the foreign-born population - Sudan (%)
Place of birth for the foreign-born population - Other Northern Africa (%)
Place of birth for the foreign-born population - South Africa (%)
Place of birth for the foreign-born population - Other Southern Africa (%)
Place of birth for the foreign-born population - Cabo Verde (%)
Place of birth for the foreign-born population - Ghana (%)
Place of birth for the foreign-born population - Liberia (%)
Place of birth for the foreign-born population - Nigeria (%)
Place of birth for the foreign-born population - Senegal (%)
Place of birth for the foreign-born population - Sierra Leone (%)
Place of birth for the foreign-born population - Other Western Africa (%)
Place of birth for the foreign-born population - Australia (%)
Place of birth for the foreign-born population - New Zealand (%)
Place of birth for the foreign-born population - Fiji (%)
Place of birth for the foreign-born population - Micronesia (%)
Place of birth for the foreign-born population - Bahamas (%)
Place of birth for the foreign-born population - Barbados (%)
Place of birth for the foreign-born population - Cuba (%)
Place of birth for the foreign-born population - Dominica (%)
Place of birth for the foreign-born population - Dominican Republic (%)
Place of birth for the foreign-born population - Grenada (%)
Place of birth for the foreign-born population - Haiti (%)
Place of birth for the foreign-born population - Jamaica (%)
Place of birth for the foreign-born population - St. Vincent and the Grenadines (%)
Place of birth for the foreign-born population - Trinidad and Tobago (%)
Place of birth for the foreign-born population - West Indies (%)
Place of birth for the foreign-born population - Other Caribbean (%)
Place of birth for the foreign-born population - Belize (%)
Place of birth for the foreign-born population - Costa Rica (%)
Place of birth for the foreign-born population - El Salvador (%)
Place of birth for the foreign-born population - Guatemala (%)
Place of birth for the foreign-born population - Honduras (%)
Place of birth for the foreign-born population - Mexico (%)
Place of birth for the foreign-born population - Nicaragua (%)
Place of birth for the foreign-born population - Panama (%)
Place of birth for the foreign-born population - Other Central America (%)
Place of birth for the foreign-born population - Argentina (%)
Place of birth for the foreign-born population - Bolivia (%)
Place of birth for the foreign-born population - Brazil (%)
Place of birth for the foreign-born population - Chile (%)
Place of birth for the foreign-born population - Colombia (%)
Place of birth for the foreign-born population - Ecuador (%)
Place of birth for the foreign-born population - Guyana (%)
Place of birth for the foreign-born population - Peru (%)
Place of birth for the foreign-born population - Uruguay (%)
Place of birth for the foreign-born population - Venezuela (%)
Place of birth for the foreign-born population - Other South America (%)
Place of birth for the foreign-born population - Canada (%)
Place of birth for the foreign-born population - Other Northern America (%)
Place of birth for the foreign-born population - Other (%)
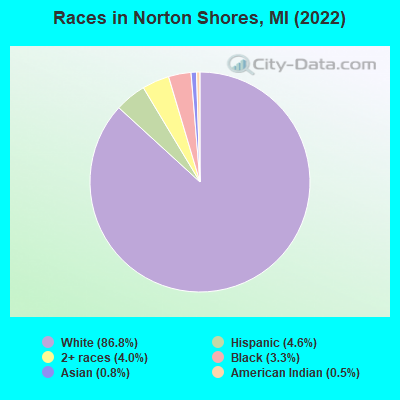
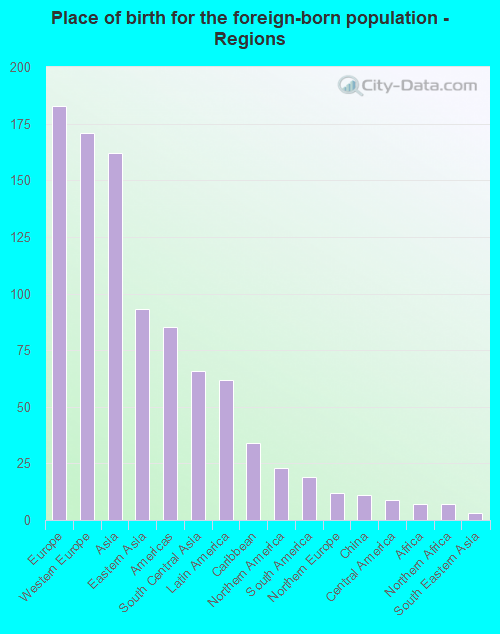
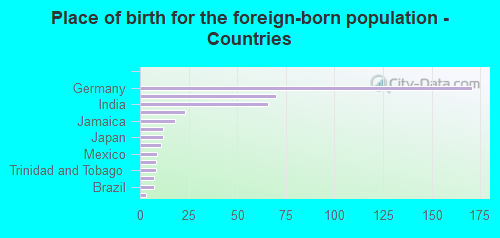
According to 2022 data, the most numerous races in Norton Shores, MI are White alone (21,756 residents), Black alone (835 residents), and Hispanic (1,143 residents). 96.8% of Norton Shores residents speak English at home. 1.7% of Norton Shores, MI residents are foreign-born , which is 244.2% less than the foreign-born rate of 6.0% across the entire state of Michigan.
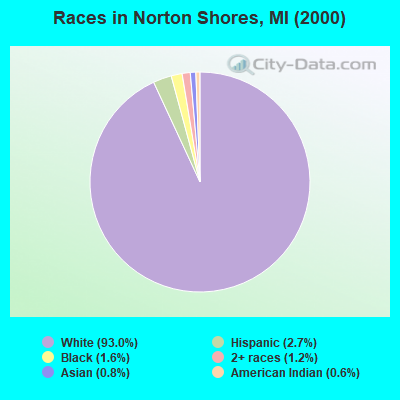
Race distribution in Norton Shores
2000 2022
7,806,691 78.6% White alone 1,402,047 14.1% Black alone 323,877 3.3% Hispanic 175,311 1.8% Asian alone 163,487 1.6% Two or more races 53,421 0.5% American Indian alone 11,465 0.1% Other race alone 2,145 0.02% Native Hawaiian and Other
7,289,051 72.6% White alone 1,310,464 13.1% Black alone 572,405 5.7% Hispanic 450,031 4.5% Two or more races 335,732 3.3% Asian alone 45,217 0.5% Other race alone 29,011 0.3% American Indian alone 2,207 0.02% Native Hawaiian and Other
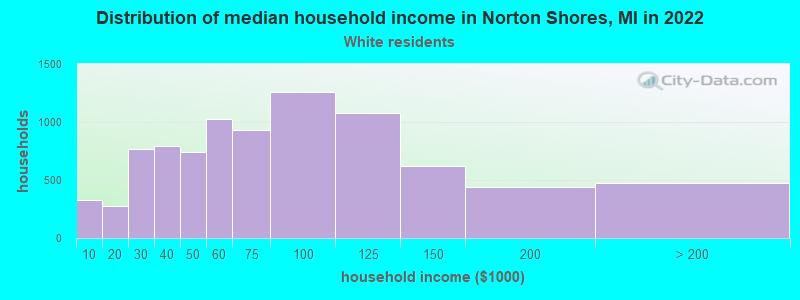
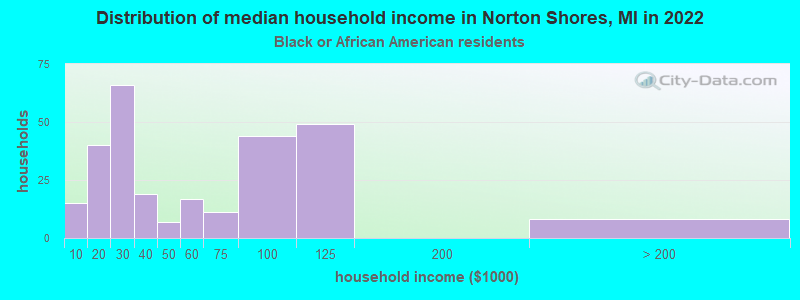
Income and house value in Norton Shores Median household income in 2022 $69,969 White non-Hispanic householders$41,323 Black householders$94,569 American Indian and Alaska Native householders$59,927 Two or more races householders$63,081 Hispanic or Latino race householdersMedian 2022 house value $232,516 White Non-Hispanic householders$326,874 Black or African American householders$98,062 American Indian or Alaska Native householders $307,479 Asian householders$161,693 Some other race householders$156,028 Two or more races householders$114,841 Hispanic or Latino householders
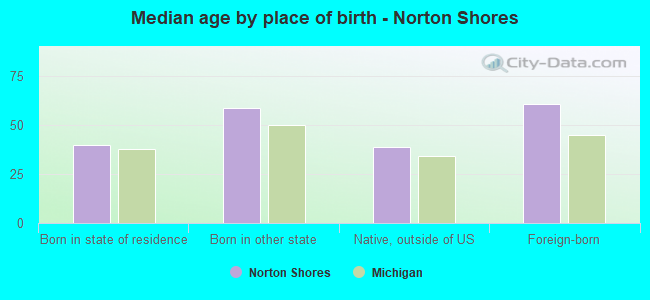
Median age by race in Norton Shores
41.2 Median age for White residents40.2 44.0 34.2 Median age for Black or African American residents33.9 41.1 34.7 Median age for American Indian / Alaska Native residents52.3 24.2 48.8 Median age for Asian residents53.6 32.2 -670,531,400.3 Median age for Native Hawaiian / Pacific Islander residents-666,666,666.0 -699,588,476.7 36.0 Median age for Other race residents34.2 56.2 12.7 Median age for Two or more races residents14.6 11.7 43.0 Median age for White alone residents40.3 45.3 22.4 Median age for Hispanic or Latino residents21.9 23.6
Owner/renter occupied households by race in Norton Shores
House owners and renters - White residents 7,926 88.6% Owner occupied1,018 11.4% Renter occupiedHouse owners and renters - Black or African American residents 161 56.4% Owner occupied125 43.6% Renter occupiedHouse owners and renters - American Indian / Alaska Native residents 48 54.1% Owner occupied41 45.9% Renter occupiedHouse owners and renters - Asian residents 24 37.7% Owner occupied40 62.3% Renter occupiedHouse owners and renters - Other race residents 44 100.0% Owner occupiedHouse owners and renters - Two or more races residents 219 66.7% Owner occupied110 33.3% Renter occupiedHouse owners and renters - White alone residents 7,826 88.8% Owner occupied990 11.2% Renter occupiedHouse owners and renters - Hispanic or Latino residents 232 80.8% Owner occupied55 19.2% Renter occupied
Language usage in Norton Shores
English speakers - Total 96.8% of residents of Norton Shores speak English at home.
0.8% of residents speak Spanish at home 146 75.3% Speak English very well48 24.7% Speak English less than very well1.6% of residents speak other language at home 297 76.9% Speak English very well89 23.1% Speak English less than very well
English speakers - Born in the United States 97.6% of residents of Norton Shores speak English at home.
0.4% of residents speak Spanish at home 13 100.0% Speak English very well1.6% of residents speak other language at home 41 83.7% Speak English very well8 16.3% Speak English less than very well
English speakers - Native, born elsewhere 17.4% of residents of Norton Shores speak English at home.
52.2% of residents speak Spanish at home 24 100.0% Speak English very well34.8% of residents speak other language at home 16 100.0% Speak English very well
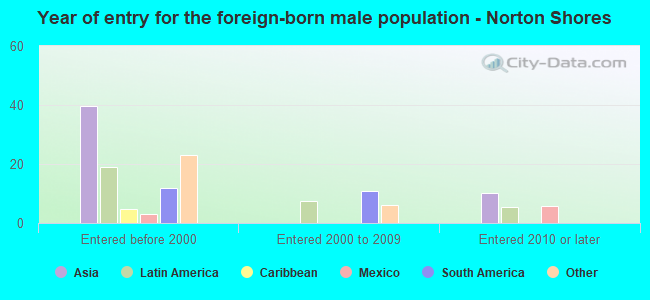
English speakers - Foreign-born 26.0% of residents of Norton Shores speak English at home.
4.3% of residents speak Spanish at home 8 42.1% Speak English very well11 57.9% Speak English less than very well57.9% of residents speak other language at home 197 77.6% Speak English very well57 22.4% Speak English less than very well
White (Caucasian) - Speak only English Native:
98.8% (20,742)Foreign-born:
18.8% (31)
White (Caucasian) - Speak another language Native:
1.2% (248)Foreign-born:
78.8% (132)
Black or African American - Speak only English Native:
100.0% (791)Foreign-born:
93.1% (16)
Asian - Speak only English Native:
99.5% (23)Foreign-born:
45.2% (55)
Other race - Speak only English Native:
38.0% (24)Foreign-born:
32.5% (10)
Other race - Speak another language Native:
59.6% (38)Foreign-born:
58.9% (17)
Two or more races - Speak only English Native:
90.5% (983)Foreign-born:
20.5% (6)
Two or more races - Speak another language Native:
7.3% (79)Foreign-born:
55.9% (15)
White alone - Speak only English Native:
99.0% (20,211)Foreign-born:
17.5% (31)
White alone - Speak another language Native:
1.0% (199)Foreign-born:
82.1% (148)
Hispanic or Latino - Speak only English Native:
85.4% (852)Foreign-born:
20.1% (7)
Hispanic or Latino - Speak another language Native:
10.7% (106)Foreign-born:
61.7% (20)
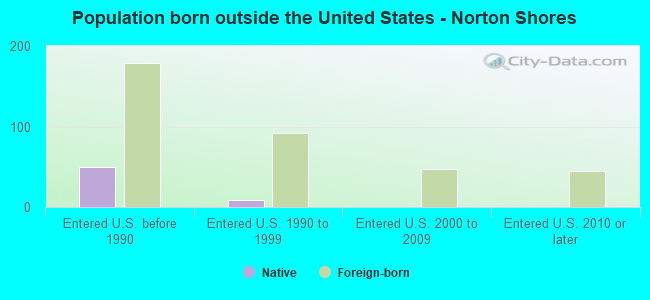
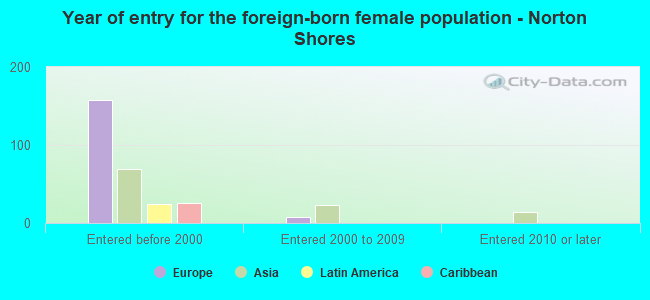
Foreign-born residents in Norton Shores 437 residents are foreign born
This city:
1.7%Michigan:
6.9%
Marital status for residents in Norton Shores Marital status - White (Caucasian) population 15 years and over
Males 29.8% Never married59.4% Now married0.2% Separated1.9% Widowed8.6% DivorcedFemales 18.0% Never married58.7% Now married0.8% Separated8.4% Widowed14.1% DivorcedWomen who gave birth in the past 12 months Now married:
56.9% (115)Unmarried:
43.1% (87)
Women who did not give birth in the past 12 months Now married:
51.3% (2,144)Unmarried:
48.7% (2,038)
Marital status - Black or African American population 15 years and over
Males 59.2% Never married28.3% Now married0.2% Separated1.7% Widowed10.6% DivorcedFemales 44.9% Never married42.0% Now married0.0% Separated8.1% Widowed4.9% DivorcedWomen who gave birth in the past 12 months Now married:
100.0% (27)Unmarried:
0.0% (0)
Women who did not give birth in the past 12 months Now married:
29.5% (52)Unmarried:
70.5% (125)
Marital status - American Indian / Alaska Native population 15 years and over
Males 60.7% Never married32.5% Now married0.0% Separated0.0% Widowed6.8% DivorcedFemales 49.5% Never married19.0% Now married0.0% Separated0.0% Widowed31.4% DivorcedWomen who did not give birth in the past 12 months Now married:
0.0% (0)Unmarried:
100.0% (88)
Marital status - Asian population 15 years and over
Males 42.2% Never married57.8% Now married0.0% Separated0.0% Widowed0.0% DivorcedFemales 26.8% Never married68.3% Now married0.0% Separated4.9% Widowed0.0% DivorcedWomen who did not give birth in the past 12 months Now married:
52.2% (37)Unmarried:
47.8% (34)
Marital status - Other race population 15 years and over
Males 36.4% Never married47.7% Now married0.0% Separated0.0% Widowed15.9% DivorcedFemales 26.5% Never married73.5% Now married0.0% Separated0.0% Widowed0.0% DivorcedWomen who did not give birth in the past 12 months Now married:
57.1% (14)Unmarried:
42.9% (11)
Marital status - Two or more races population 15 years and over
Males 43.2% Never married54.0% Now married0.0% Separated2.9% Widowed0.0% DivorcedFemales 55.6% Never married37.2% Now married0.0% Separated0.0% Widowed7.1% DivorcedWomen who gave birth in the past 12 months Now married:
100.0% (16)Unmarried:
0.0% (0)
Women who did not give birth in the past 12 months Now married:
24.0% (49)Unmarried:
76.0% (155)
Marital status - White alone, not Hispanic / Latino population 15 years and over
Males 28.5% Never married60.5% Now married0.2% Separated2.0% Widowed8.9% DivorcedFemales 17.0% Never married59.4% Now married0.8% Separated8.6% Widowed14.1% DivorcedWomen who gave birth in the past 12 months Now married:
56.9% (116)Unmarried:
43.1% (88)
Women who did not give birth in the past 12 months Now married:
52.8% (2,130)Unmarried:
47.2% (1,903)
Marital status - Hispanic or Latino population 15 years and over
Males 67.0% Never married30.7% Now married0.0% Separated0.0% Widowed2.2% DivorcedFemales 42.4% Never married39.3% Now married0.0% Separated0.0% Widowed18.4% DivorcedWomen who did not give birth in the past 12 months Now married:
32.3% (106)Unmarried:
67.7% (223)
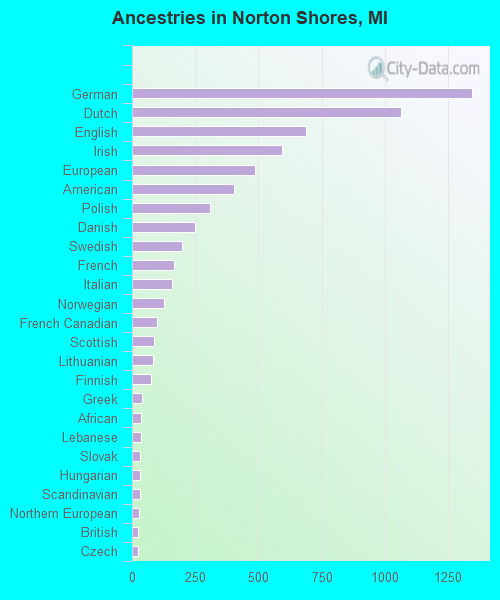
Ancestries in Norton Shores
1,345 16.7% German1,064 13.2% Dutch688 8.5% English593 7.3% Irish486 6.0% European402 5.0% American308 3.8% Polish249 3.1% Danish196 2.4% Swedish168 2.1% French160 2.0% Italian126 1.6% Norwegian100 1.2% French Canadian88 1.1% Scottish82 1.0% Lithuanian74 0.9% Finnish41 0.5% Greek36 0.4% African35 0.4% Lebanese33 0.4% Slovak32 0.4% Hungarian30 0.4% Scandinavian26 0.3% Northern European24 0.3% British23 0.3% Czech13 0.2% Scotch-Irish11 0.1% Slavic9 0.1% Czechoslovakian8 0.10% Slovene7 0.09% Eastern European4 0.05% Brazilian4 0.05% Welsh
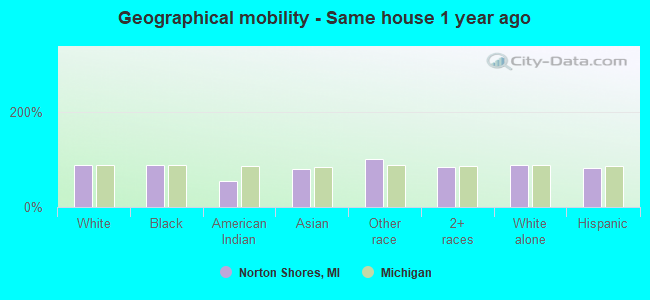
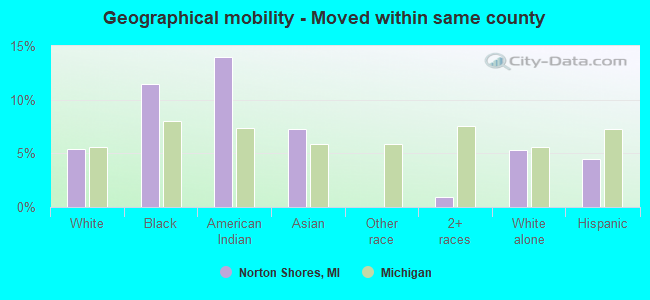
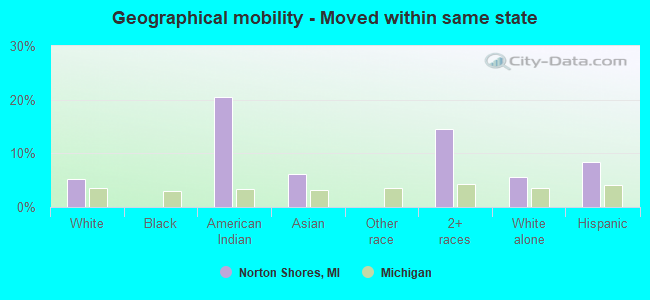
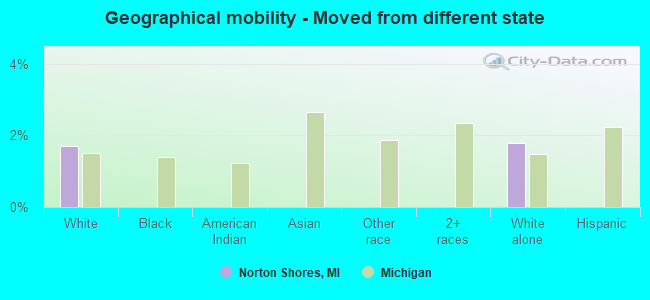
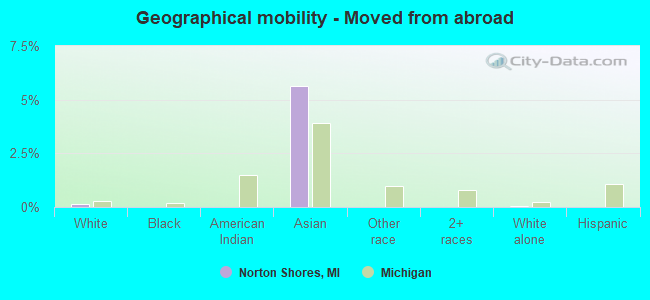
Geographical mobility in Norton Shores Same house 1 year ago 19,376 87.6% White (Caucasian)725 88.9% Black or African American129 55.0% American Indian / Alaska Native184 80.2% Asian93 100.0% Other race1,058 82.6% Two or more races18,854 87.4% White alone, not Hispanic / Latino932 82.4% Hispanic or LatinoMoved within same county 1,187 5.4% White / Caucasian93 11.4% Black or African American33 14.0% American Indian / Alaska Native17 7.2% Asian12 1.0% Two or more races1,154 5.4% White alone, not Hispanic / Latino51 4.5% Hispanic or LatinoMoved within same state 1,163 5.3% White / Caucasian48 20.4% American Indian / Alaska Native14 6.2% Asian186 14.5% Two or more races1,197 5.6% White alone, not Hispanic / Latino96 8.5% Hispanic or LatinoMoved from different state 375 1.7% White / Caucasian387 1.8% White alone, not Hispanic / LatinoMoved from abroad 34 0.2% White13 5.6% Asian12 0.1% White alone, not Hispanic / Latino
Children Nativity (place of birth) in Norton Shores
Children under 6 years - Living with two parents Both parents native 1,292 100.0% NativeBoth parents foreign-born 32 100.0% NativeOne native, one foreign-born parent 30 100.0% NativeChildren under 6 years - Living with one parent Native parent 451 100.0% NativeChildren 6 to 17 years - Living with two parents Both parents native 2,164 100.0% NativeOne native, one foreign-born parent 62 100.0% NativeChildren 6 to 17 years - Living with one parent Native parent 1,406 100.0% NativeForeign-born parent 12 49.3% Native13 50.7% Foreign-born
Grandparents responsible for own grandchildren in Norton Shores
Grandparents (30 to 59 years) White / Caucasian 90 24.6% Responsible for grandchildren277 75.4% Not responsible for grandchildrenWhite alone, not Hispanic / Latino 90 29.3% Responsible for grandchildren218 70.7% Not responsible for grandchildrenGrandparents (60 years and over) White / Caucasian 15 9.5% Responsible for grandchildren145 90.5% Not responsible for grandchildrenWhite alone, not Hispanic / Latino 15 8.8% Responsible for grandchildren159 91.2% Not responsible for grandchildren