Races in Norwood, Ohio (OH) Detailed Stats
Data:
Races - White alone (%)
Races - White alone (% change since 2000)
Races - Black alone (%)
Races - Black alone (% change since 2000)
Races - American Indian alone (%)
Races - American Indian alone (% change since 2000)
Races - Asian alone (%)
Races - Asian alone (% change since 2000)
Races - Hispanic (%)
Races - Hispanic (% change since 2000)
Races - Native Hawaiian and Other Pacific Islander alone (%)
Races - Native Hawaiian and Other Pacific Islander alone (% change since 2000)
Races - Two or more races(%)
Races - Two or more races(% change since 2000)
Races - Other race alone (%)
Races - Other race alone (% change since 2000)
Racial diversity
Place of birth - Born in state of residence (%)
Place of birth - Born in state of residence (%) - White
Place of birth - Born in state of residence (%) - Black or African American
Place of birth - Born in state of residence (%) - Asian
Place of birth - Born in state of residence (%) - Hispanic or Latino
Place of birth - Born in state of residence (%) - American Indian and Alaska Native
Place of birth - Born in state of residence (%) - Multirace
Place of birth - Born in state of residence (%) - Other Race
Place of birth - Born in other state (%)
Place of birth - Born in other state (%) - White
Place of birth - Born in other state (%) - Black or African American
Place of birth - Born in other state (%) - Asian
Place of birth - Born in other state (%) - Hispanic or Latino
Place of birth - Born in other state (%) - American Indian and Alaska Native
Place of birth - Born in other state (%) - Multirace
Place of birth - Born in other state (%) - Other Race
Place of birth - Native, outside of US (%)
Place of birth - Native, outside of US (%) - White
Place of birth - Native, outside of US (%) - Black or African American
Place of birth - Native, outside of US (%) - Asian
Place of birth - Native, outside of US (%) - Hispanic or Latino
Place of birth - Native, outside of US (%) - American Indian and Alaska Native
Place of birth - Native, outside of US (%) - Multirace
Place of birth - Native, outside of US (%) - Other Race
Place of birth - Foreign born (%)
Place of birth - Foreign born (%) - White
Place of birth - Foreign born (%) - Black or African American
Place of birth - Foreign born (%) - Asian
Place of birth - Foreign born (%) - Hispanic or Latino
Place of birth - Foreign born (%) - American Indian and Alaska Native
Place of birth - Foreign born (%) - Multirace
Place of birth - Foreign born (%) - Other Race
Residents speaking English at home (%)
Residents speaking English at home - Born in the United States (%)
Residents speaking English at home - Native, born elsewhere (%)
Residents speaking English at home - Foreign born (%)
Residents speaking Spanish at home (%)
Residents speaking Spanish at home - Born in the United States (%)
Residents speaking Spanish at home - Native, born elsewhere (%)
Residents speaking Spanish at home - Foreign born (%)
Residents speaking other language at home (%)
Residents speaking other language at home - Born in the United States (%)
Residents speaking other language at home - Native, born elsewhere (%)
Residents speaking other language at home - Foreign born (%)
Marital status - Never married (%)
Marital status - Now married (%)
Marital status - Separated (%)
Marital status - Widowed (%)
Marital status - Divorced (%)
Ancestries Reported - Arab (%)
Ancestries Reported - Czech (%)
Ancestries Reported - Danish (%)
Ancestries Reported - Dutch (%)
Ancestries Reported - English (%)
Ancestries Reported - French (%)
Ancestries Reported - French Canadian (%)
Ancestries Reported - German (%)
Ancestries Reported - Greek (%)
Ancestries Reported - Hungarian (%)
Ancestries Reported - Irish (%)
Ancestries Reported - Italian (%)
Ancestries Reported - Lithuanian (%)
Ancestries Reported - Norwegian (%)
Ancestries Reported - Polish (%)
Ancestries Reported - Portuguese (%)
Ancestries Reported - Russian (%)
Ancestries Reported - Scotch-Irish (%)
Ancestries Reported - Scottish (%)
Ancestries Reported - Slovak (%)
Ancestries Reported - Subsaharan African (%)
Ancestries Reported - Swedish (%)
Ancestries Reported - Swiss (%)
Ancestries Reported - Ukrainian (%)
Ancestries Reported - United States (%)
Ancestries Reported - Welsh (%)
Ancestries Reported - West Indian (%)
Ancestries Reported - Other (%)
Geographical mobility - Same house 1 year ago (%)
Geographical mobility - Same house 1 year ago (%) - White
Geographical mobility - Same house 1 year ago (%) - Black or African American
Geographical mobility - Same house 1 year ago (%) - Asian
Geographical mobility - Same house 1 year ago (%) - Hispanic or Latino
Geographical mobility - Same house 1 year ago (%) - American Indian and Alaska Native
Geographical mobility - Same house 1 year ago (%) - Multirace
Geographical mobility - Same house 1 year ago (%) - Other Race
Geographical mobility - Moved within same county (%)
Geographical mobility - Moved within same county (%) - White
Geographical mobility - Moved within same county (%) - Black or African American
Geographical mobility - Moved within same county (%) - Asian
Geographical mobility - Moved within same county (%) - Hispanic or Latino
Geographical mobility - Moved within same county (%) - American Indian and Alaska Native
Geographical mobility - Moved within same county (%) - Multirace
Geographical mobility - Moved within same county (%) - Other Race
Geographical mobility - Moved from different county within same state (%)
Geographical mobility - Moved from different county within same state (%) - White
Geographical mobility - Moved from different county within same state (%) - Black or African American
Geographical mobility - Moved from different county within same state (%) - Asian
Geographical mobility - Moved from different county within same state (%) - Hispanic or Latino
Geographical mobility - Moved from different county within same state (%) - American Indian and Alaska Native
Geographical mobility - Moved from different county within same state (%) - Multirace
Geographical mobility - Moved from different county within same state (%) - Other Race
Geographical mobility - Moved from different state (%)
Geographical mobility - Moved from different state (%) - White
Geographical mobility - Moved from different state (%) - Black or African American
Geographical mobility - Moved from different state (%) - Asian
Geographical mobility - Moved from different state (%) - Hispanic or Latino
Geographical mobility - Moved from different state (%) - American Indian and Alaska Native
Geographical mobility - Moved from different state (%) - Multirace
Geographical mobility - Moved from different state (%) - Other Race
Geographical mobility - Moved from abroad (%)
Geographical mobility - Moved from abroad (%) - White
Geographical mobility - Moved from abroad (%) - Black or African American
Geographical mobility - Moved from abroad (%) - Asian
Geographical mobility - Moved from abroad (%) - Hispanic or Latino
Geographical mobility - Moved from abroad (%) - American Indian and Alaska Native
Geographical mobility - Moved from abroad (%) - Multirace
Geographical mobility - Moved from abroad (%) - Other Race
Place of birth for the foreign-born population - Ireland (%)
Place of birth for the foreign-born population - Denmark (%)
Place of birth for the foreign-born population - Norway (%)
Place of birth for the foreign-born population - Sweden (%)
Place of birth for the foreign-born population - United Kingdom (%)
Place of birth for the foreign-born population - England (%)
Place of birth for the foreign-born population - Scotland (%)
Place of birth for the foreign-born population - Other Northern Europe (%)
Place of birth for the foreign-born population - Austria (%)
Place of birth for the foreign-born population - Belgium (%)
Place of birth for the foreign-born population - France (%)
Place of birth for the foreign-born population - Germany (%)
Place of birth for the foreign-born population - Netherlands (%)
Place of birth for the foreign-born population - Switzerland (%)
Place of birth for the foreign-born population - Other Western Europe (%)
Place of birth for the foreign-born population - Greece (%)
Place of birth for the foreign-born population - Italy (%)
Place of birth for the foreign-born population - Portugal (%)
Place of birth for the foreign-born population - Spain (%)
Place of birth for the foreign-born population - Other Southern Europe (%)
Place of birth for the foreign-born population - Albania (%)
Place of birth for the foreign-born population - Belarus (%)
Place of birth for the foreign-born population - Bosnia and Herzegovina (%)
Place of birth for the foreign-born population - Bulgaria (%)
Place of birth for the foreign-born population - Croatia (%)
Place of birth for the foreign-born population - Czechoslovakia (%)
Place of birth for the foreign-born population - Hungary (%)
Place of birth for the foreign-born population - Latvia (%)
Place of birth for the foreign-born population - Lithuania (%)
Place of birth for the foreign-born population - North Macedonia (Macedonia) (%)
Place of birth for the foreign-born population - Moldova (%)
Place of birth for the foreign-born population - Poland (%)
Place of birth for the foreign-born population - Romania (%)
Place of birth for the foreign-born population - Russia (%)
Place of birth for the foreign-born population - Serbia (%)
Place of birth for the foreign-born population - Ukraine (%)
Place of birth for the foreign-born population - Other Eastern Europe (%)
Place of birth for the foreign-born population - China (%)
Place of birth for the foreign-born population - Hong Kong (%)
Place of birth for the foreign-born population - Taiwan (%)
Place of birth for the foreign-born population - Japan (%)
Place of birth for the foreign-born population - Korea (%)
Place of birth for the foreign-born population - Other Eastern Asia (%)
Place of birth for the foreign-born population - Afghanistan (%)
Place of birth for the foreign-born population - Bangladesh (%)
Place of birth for the foreign-born population - India (%)
Place of birth for the foreign-born population - Iran (%)
Place of birth for the foreign-born population - Kazakhstan (%)
Place of birth for the foreign-born population - Nepal (%)
Place of birth for the foreign-born population - Pakistan (%)
Place of birth for the foreign-born population - Sri Lanka (%)
Place of birth for the foreign-born population - Uzbekistan (%)
Place of birth for the foreign-born population - Other South Central Asia (%)
Place of birth for the foreign-born population - Burma (%)
Place of birth for the foreign-born population - Cambodia (%)
Place of birth for the foreign-born population - Indonesia (%)
Place of birth for the foreign-born population - Laos (%)
Place of birth for the foreign-born population - Malaysia (%)
Place of birth for the foreign-born population - Philippines (%)
Place of birth for the foreign-born population - Singapore (%)
Place of birth for the foreign-born population - Thailand (%)
Place of birth for the foreign-born population - Vietnam (%)
Place of birth for the foreign-born population - Other South Eastern Asia (%)
Place of birth for the foreign-born population - Armenia (%)
Place of birth for the foreign-born population - Iraq (%)
Place of birth for the foreign-born population - Israel (%)
Place of birth for the foreign-born population - Jordan (%)
Place of birth for the foreign-born population - Kuwait (%)
Place of birth for the foreign-born population - Lebanon (%)
Place of birth for the foreign-born population - Saudi Arabia (%)
Place of birth for the foreign-born population - Syria (%)
Place of birth for the foreign-born population - Turkey (%)
Place of birth for the foreign-born population - Yemen (%)
Place of birth for the foreign-born population - Other Western Asia (%)
Place of birth for the foreign-born population - Eritrea (%)
Place of birth for the foreign-born population - Ethiopia (%)
Place of birth for the foreign-born population - Kenya (%)
Place of birth for the foreign-born population - Somalia (%)
Place of birth for the foreign-born population - Uganda (%)
Place of birth for the foreign-born population - Zimbabwe (%)
Place of birth for the foreign-born population - Other Eastern Africa (%)
Place of birth for the foreign-born population - Cameroon (%)
Place of birth for the foreign-born population - Congo (%)
Place of birth for the foreign-born population - Democratic Republic of Congo (Zaire) (%)
Place of birth for the foreign-born population - Other Middle Africa (%)
Place of birth for the foreign-born population - Egypt (%)
Place of birth for the foreign-born population - Morocco (%)
Place of birth for the foreign-born population - Sudan (%)
Place of birth for the foreign-born population - Other Northern Africa (%)
Place of birth for the foreign-born population - South Africa (%)
Place of birth for the foreign-born population - Other Southern Africa (%)
Place of birth for the foreign-born population - Cabo Verde (%)
Place of birth for the foreign-born population - Ghana (%)
Place of birth for the foreign-born population - Liberia (%)
Place of birth for the foreign-born population - Nigeria (%)
Place of birth for the foreign-born population - Senegal (%)
Place of birth for the foreign-born population - Sierra Leone (%)
Place of birth for the foreign-born population - Other Western Africa (%)
Place of birth for the foreign-born population - Australia (%)
Place of birth for the foreign-born population - New Zealand (%)
Place of birth for the foreign-born population - Fiji (%)
Place of birth for the foreign-born population - Micronesia (%)
Place of birth for the foreign-born population - Bahamas (%)
Place of birth for the foreign-born population - Barbados (%)
Place of birth for the foreign-born population - Cuba (%)
Place of birth for the foreign-born population - Dominica (%)
Place of birth for the foreign-born population - Dominican Republic (%)
Place of birth for the foreign-born population - Grenada (%)
Place of birth for the foreign-born population - Haiti (%)
Place of birth for the foreign-born population - Jamaica (%)
Place of birth for the foreign-born population - St. Vincent and the Grenadines (%)
Place of birth for the foreign-born population - Trinidad and Tobago (%)
Place of birth for the foreign-born population - West Indies (%)
Place of birth for the foreign-born population - Other Caribbean (%)
Place of birth for the foreign-born population - Belize (%)
Place of birth for the foreign-born population - Costa Rica (%)
Place of birth for the foreign-born population - El Salvador (%)
Place of birth for the foreign-born population - Guatemala (%)
Place of birth for the foreign-born population - Honduras (%)
Place of birth for the foreign-born population - Mexico (%)
Place of birth for the foreign-born population - Nicaragua (%)
Place of birth for the foreign-born population - Panama (%)
Place of birth for the foreign-born population - Other Central America (%)
Place of birth for the foreign-born population - Argentina (%)
Place of birth for the foreign-born population - Bolivia (%)
Place of birth for the foreign-born population - Brazil (%)
Place of birth for the foreign-born population - Chile (%)
Place of birth for the foreign-born population - Colombia (%)
Place of birth for the foreign-born population - Ecuador (%)
Place of birth for the foreign-born population - Guyana (%)
Place of birth for the foreign-born population - Peru (%)
Place of birth for the foreign-born population - Uruguay (%)
Place of birth for the foreign-born population - Venezuela (%)
Place of birth for the foreign-born population - Other South America (%)
Place of birth for the foreign-born population - Canada (%)
Place of birth for the foreign-born population - Other Northern America (%)
Place of birth for the foreign-born population - Other (%)
Latest news about races in Norwood, OH collected exclusively by city-data.com from local newspapers, TV, and radio stations
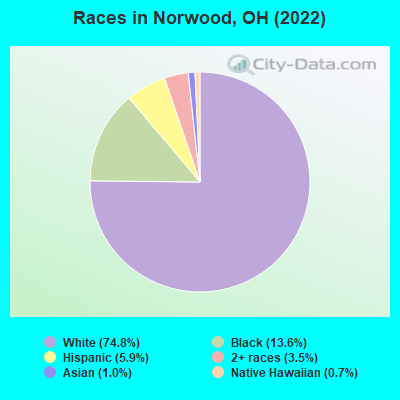
According to 2022 data, the most numerous races in Norwood, OH are White alone (14,174 residents), Black alone (2,575 residents), and Two or more races (670 residents). 92.2% of Norwood residents speak English at home. 4.6% of Norwood, OH residents are foreign-born (1.7% born in Latin America, 1.2% born in Asia, 0.8% born in Oceania, 0.6% born in Europe), which is 12.9% greater than the foreign-born rate of 4.0% across the entire state of Ohio.
Race distribution in Norwood
2000 2022
9,538,111 84.0% White alone 1,290,662 11.4% Black alone 217,123 1.9% Hispanic 137,770 1.2% Two or more races 131,670 1.2% Asian alone 21,985 0.2% American Indian alone 13,483 0.1% Other race alone 2,336 0.02% Native Hawaiian and Other
8,948,793 76.1% White alone 1,401,403 11.9% Black alone 529,291 4.5% Two or more races 517,232 4.4% Hispanic 293,387 2.5% Asian alone 52,805 0.4% Other race alone 9,785 0.08% American Indian alone 3,362 0.03% Native Hawaiian and Other
Income and house value in Norwood Median household income in 2022 $60,146 White non-Hispanic householders$44,439 Black householders$74,302 Some other race householders$72,988 Two or more races householders$54,474 Hispanic or Latino race householdersMedian 2022 house value $233,208 White Non-Hispanic householders$161,390 Black or African American householders$264,410 American Indian or Alaska Native householders $222,987 Asian householders$228,636 Some other race householders$168,114 Two or more races householders$253,920 Hispanic or Latino householders
Median age by race in Norwood
35.4 Median age for White residents34.7 36.3 31.0 Median age for Black or African American residents31.4 27.8 24.6 Median age for American Indian / Alaska Native residents23.0 -871,212,120.3 51.6 Median age for Asian residents33.6 52.0 37.7 Median age for Native Hawaiian / Pacific Islander residents35.3 -805,394,989.6 31.2 Median age for Other race residents34.6 12.8 22.3 Median age for Two or more races residents30.2 19.2 35.8 Median age for White alone residents35.2 36.5 25.4 Median age for Hispanic or Latino residents25.9 23.7
Owner/renter occupied households by race in Norwood
House owners and renters - White residents 3,827 54.2% Owner occupied3,239 45.8% Renter occupiedHouse owners and renters - Black or African American residents 159 15.6% Owner occupied859 84.4% Renter occupiedHouse owners and renters - Asian residents 38 30.6% Owner occupied87 69.4% Renter occupiedHouse owners and renters - Native Hawaiian / Pacific Islander residents 33 100.0% Renter occupiedHouse owners and renters - Other race residents 22 35.6% Owner occupied39 64.4% Renter occupiedHouse owners and renters - Two or more races residents 111 26.9% Owner occupied300 73.1% Renter occupiedHouse owners and renters - White alone residents 3,785 54.9% Owner occupied3,110 45.1% Renter occupiedHouse owners and renters - Hispanic or Latino residents 103 28.7% Owner occupied256 71.3% Renter occupied
Language usage in Norwood
English speakers - Total 92.2% of residents of Norwood speak English at home.
5.3% of residents speak Spanish at home 705 74.4% Speak English very well243 25.6% Speak English less than very well2.6% of residents speak other language at home 367 77.8% Speak English very well105 22.2% Speak English less than very well
English speakers - Born in the United States 91.7% of residents of Norwood speak English at home.
10.6% of residents speak Spanish at home 507 98.6% Speak English very well7 1.4% Speak English less than very well0.5% of residents speak other language at home 14 56.0% Speak English very well11 44.0% Speak English less than very well
English speakers - Native, born elsewhere 94.8% of residents of Norwood speak English at home.
10.3% of residents speak Spanish at home 16 100.0% Speak English very well
English speakers - Foreign-born 29.4% of residents of Norwood speak English at home.
36.0% of residents speak Spanish at home 68 21.9% Speak English very well242 78.1% Speak English less than very well38.5% of residents speak other language at home 246 74.1% Speak English very well86 25.9% Speak English less than very well
White (Caucasian) - Speak only English Native:
96.0% (13,024)Foreign-born:
45.1% (188)
White (Caucasian) - Speak another language Native:
3.9% (533)Foreign-born:
56.3% (235)
American Indian / Alaska Native - Speak only English Native:
89.9% (7)Foreign-born:
100.0% (18)
Asian - Speak only English Native:
92.3% (41)Foreign-born:
19.5% (29)
Asian - Speak another language Native:
15.3% (7)Foreign-born:
80.8% (120)
Other race - Speak another language Native:
83.0% (83)Foreign-born:
100.0% (88)
Two or more races - Speak another language Native:
15.7% (113)Foreign-born:
96.5% (37)
White alone - Speak only English Native:
97.6% (12,815)Foreign-born:
71.9% (178)
White alone - Speak another language Native:
2.5% (325)Foreign-born:
33.4% (83)
Hispanic or Latino - Speak only English Native:
40.1% (322)Foreign-born:
7.1% (23)
Hispanic or Latino - Speak another language Native:
65.5% (526)Foreign-born:
92.9% (307)
Foreign-born residents in Norwood 871 residents are foreign born (1.7% Latin America , 1.2% Asia , 0.8% Oceania , 0.6% Europe ).
Marital status for residents in Norwood Marital status - White (Caucasian) population 15 years and over
Males 51.2% Never married34.1% Now married1.1% Separated2.5% Widowed11.1% DivorcedFemales 39.6% Never married36.4% Now married1.6% Separated10.9% Widowed11.4% DivorcedWomen who gave birth in the past 12 months Now married:
69.6% (122)Unmarried:
30.4% (53)
Women who did not give birth in the past 12 months Now married:
36.6% (1,296)Unmarried:
63.4% (2,246)
Marital status - Black or African American population 15 years and over
Males 50.8% Never married21.3% Now married9.2% Separated1.4% Widowed17.4% DivorcedFemales 58.3% Never married20.8% Now married11.2% Separated2.4% Widowed7.3% DivorcedWomen who did not give birth in the past 12 months Now married:
33.2% (244)Unmarried:
66.8% (491)
Marital status - Asian population 15 years and over
Males 33.6% Never married47.7% Now married18.7% Separated0.0% Widowed0.0% DivorcedFemales 21.7% Never married50.6% Now married0.0% Separated0.0% Widowed27.7% DivorcedWomen who did not give birth in the past 12 months Now married:
25.9% (14)Unmarried:
74.1% (40)
Marital status - Other race population 15 years and over
Males 37.2% Never married29.5% Now married14.1% Separated0.0% Widowed19.2% DivorcedFemales 21.1% Never married36.8% Now married0.0% Separated0.0% Widowed42.1% DivorcedWomen who did not give birth in the past 12 months Now married:
36.8% (18)Unmarried:
63.2% (31)
Marital status - Two or more races population 15 years and over
Males 60.7% Never married34.9% Now married0.0% Separated0.0% Widowed4.4% DivorcedFemales 70.2% Never married23.3% Now married0.0% Separated6.5% Widowed0.0% DivorcedWomen who gave birth in the past 12 months Now married:
0.0% (0)Unmarried:
100.0% (42)
Women who did not give birth in the past 12 months Now married:
25.8% (52)Unmarried:
74.2% (151)
Marital status - White alone, not Hispanic / Latino population 15 years and over
Males 50.1% Never married34.5% Now married1.1% Separated2.6% Widowed11.7% DivorcedFemales 39.3% Never married35.8% Now married1.7% Separated11.4% Widowed11.8% DivorcedWomen who gave birth in the past 12 months Now married:
65.0% (100)Unmarried:
35.0% (54)
Women who did not give birth in the past 12 months Now married:
36.0% (1,209)Unmarried:
64.0% (2,149)
Marital status - Hispanic or Latino population 15 years and over
Males 61.1% Never married32.2% Now married3.6% Separated0.0% Widowed3.0% DivorcedFemales 46.5% Never married45.6% Now married3.0% Separated0.0% Widowed4.8% DivorcedWomen who gave birth in the past 12 months Now married:
100.0% (27)Unmarried:
0.0% (0)
Women who did not give birth in the past 12 months Now married:
43.2% (144)Unmarried:
56.8% (190)
Ancestries in Norwood
2,164 25.4% German793 9.3% American633 7.4% English515 6.0% Irish342 4.0% Italian192 2.3% European87 1.0% Nigerian77 0.9% Scottish57 0.7% Polish56 0.7% Scotch-Irish48 0.6% Greek36 0.4% French36 0.4% Israeli29 0.3% Dutch29 0.3% Norwegian26 0.3% Lebanese21 0.2% Czech20 0.2% Canadian18 0.2% Russian17 0.2% African17 0.2% Swedish16 0.2% Northern European14 0.2% Croatian10 0.1% French Canadian10 0.1% Portuguese9 0.1% Latvian8 0.09% Hungarian
Geographical mobility in Norwood Same house 1 year ago 12,256 83.8% White (Caucasian)2,144 82.3% Black or African American24 100.0% American Indian / Alaska Native142 71.4% Asian89 62.1% Native Hawaiian / Pacific Islander167 84.6% Other race750 93.9% Two or more races11,679 83.1% White alone, not Hispanic / Latino1,071 95.7% Hispanic or LatinoMoved within same county 1,199 8.2% White / Caucasian160 6.1% Black or African American19 9.8% Asian52 36.4% Native Hawaiian / Pacific Islander22 2.7% Two or more races1,203 8.6% White alone, not Hispanic / Latino30 2.7% Hispanic or LatinoMoved within same state 437 3.0% White / Caucasian19 0.7% Black or African American7 3.4% Asian25 12.5% Other race21 2.7% Two or more races436 3.1% White alone, not Hispanic / Latino23 2.0% Hispanic or LatinoMoved from different state 586 4.0% White / Caucasian276 10.6% Black or African American7 3.8% Asian17 8.4% Other race18 2.2% Two or more races586 4.2% White alone, not Hispanic / Latino9 0.8% Hispanic or LatinoMoved from abroad 20 0.1% White46 0.3% White alone, not Hispanic / Latino
Children Nativity (place of birth) in Norwood
Children under 6 years - Living with two parents Both parents native 896 100.0% NativeBoth parents foreign-born 42 100.0% NativeOne native, one foreign-born parent 18 100.0% NativeChildren under 6 years - Living with one parent Native parent 320 100.0% NativeForeign-born parent 12 100.0% NativeChildren 6 to 17 years - Living with two parents Both parents native 940 100.0% NativeBoth parents foreign-born 148 85.2% Native26 14.8% Foreign-bornChildren 6 to 17 years - Living with one parent Native parent 673 100.0% NativeForeign-born parent 92 43.3% Native120 56.7% Foreign-born