Races in Novi, Michigan (MI) Detailed Stats
Data:
Races - White alone (%)
Races - White alone (% change since 2000)
Races - Black alone (%)
Races - Black alone (% change since 2000)
Races - American Indian alone (%)
Races - American Indian alone (% change since 2000)
Races - Asian alone (%)
Races - Asian alone (% change since 2000)
Races - Hispanic (%)
Races - Hispanic (% change since 2000)
Races - Native Hawaiian and Other Pacific Islander alone (%)
Races - Native Hawaiian and Other Pacific Islander alone (% change since 2000)
Races - Two or more races(%)
Races - Two or more races(% change since 2000)
Races - Other race alone (%)
Races - Other race alone (% change since 2000)
Racial diversity
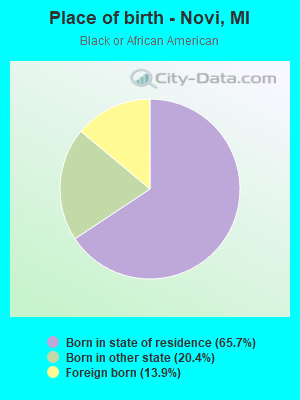
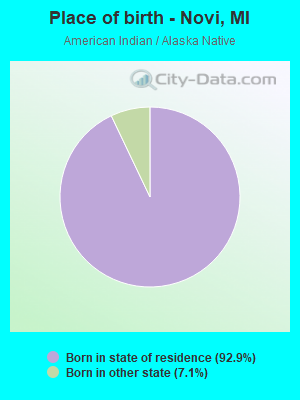
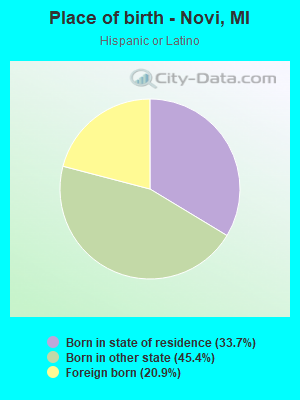
Place of birth - Born in state of residence (%)
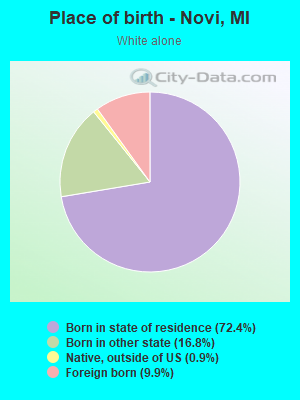
Place of birth - Born in state of residence (%) - White
Place of birth - Born in state of residence (%) - Black or African American
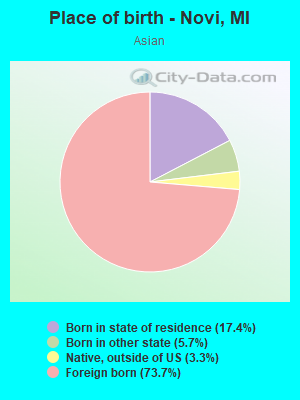
Place of birth - Born in state of residence (%) - Asian
Place of birth - Born in state of residence (%) - Hispanic or Latino
Place of birth - Born in state of residence (%) - American Indian and Alaska Native
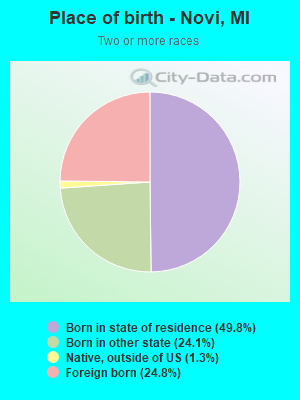
Place of birth - Born in state of residence (%) - Multirace
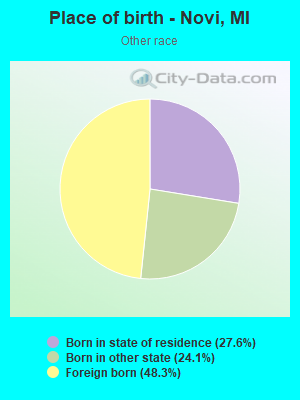
Place of birth - Born in state of residence (%) - Other Race
Place of birth - Born in other state (%)
Place of birth - Born in other state (%) - White
Place of birth - Born in other state (%) - Black or African American
Place of birth - Born in other state (%) - Asian
Place of birth - Born in other state (%) - Hispanic or Latino
Place of birth - Born in other state (%) - American Indian and Alaska Native
Place of birth - Born in other state (%) - Multirace
Place of birth - Born in other state (%) - Other Race
Place of birth - Native, outside of US (%)
Place of birth - Native, outside of US (%) - White
Place of birth - Native, outside of US (%) - Black or African American
Place of birth - Native, outside of US (%) - Asian
Place of birth - Native, outside of US (%) - Hispanic or Latino
Place of birth - Native, outside of US (%) - American Indian and Alaska Native
Place of birth - Native, outside of US (%) - Multirace
Place of birth - Native, outside of US (%) - Other Race
Place of birth - Foreign born (%)
Place of birth - Foreign born (%) - White
Place of birth - Foreign born (%) - Black or African American
Place of birth - Foreign born (%) - Asian
Place of birth - Foreign born (%) - Hispanic or Latino
Place of birth - Foreign born (%) - American Indian and Alaska Native
Place of birth - Foreign born (%) - Multirace
Place of birth - Foreign born (%) - Other Race
Residents speaking English at home (%)
Residents speaking English at home - Born in the United States (%)
Residents speaking English at home - Native, born elsewhere (%)
Residents speaking English at home - Foreign born (%)
Residents speaking Spanish at home (%)
Residents speaking Spanish at home - Born in the United States (%)
Residents speaking Spanish at home - Native, born elsewhere (%)
Residents speaking Spanish at home - Foreign born (%)
Residents speaking other language at home (%)
Residents speaking other language at home - Born in the United States (%)
Residents speaking other language at home - Native, born elsewhere (%)
Residents speaking other language at home - Foreign born (%)
Marital status - Never married (%)
Marital status - Now married (%)
Marital status - Separated (%)
Marital status - Widowed (%)
Marital status - Divorced (%)
Ancestries Reported - Arab (%)
Ancestries Reported - Czech (%)
Ancestries Reported - Danish (%)
Ancestries Reported - Dutch (%)
Ancestries Reported - English (%)
Ancestries Reported - French (%)
Ancestries Reported - French Canadian (%)
Ancestries Reported - German (%)
Ancestries Reported - Greek (%)
Ancestries Reported - Hungarian (%)
Ancestries Reported - Irish (%)
Ancestries Reported - Italian (%)
Ancestries Reported - Lithuanian (%)
Ancestries Reported - Norwegian (%)
Ancestries Reported - Polish (%)
Ancestries Reported - Portuguese (%)
Ancestries Reported - Russian (%)
Ancestries Reported - Scotch-Irish (%)
Ancestries Reported - Scottish (%)
Ancestries Reported - Slovak (%)
Ancestries Reported - Subsaharan African (%)
Ancestries Reported - Swedish (%)
Ancestries Reported - Swiss (%)
Ancestries Reported - Ukrainian (%)
Ancestries Reported - United States (%)
Ancestries Reported - Welsh (%)
Ancestries Reported - West Indian (%)
Ancestries Reported - Other (%)
Geographical mobility - Same house 1 year ago (%)
Geographical mobility - Same house 1 year ago (%) - White
Geographical mobility - Same house 1 year ago (%) - Black or African American
Geographical mobility - Same house 1 year ago (%) - Asian
Geographical mobility - Same house 1 year ago (%) - Hispanic or Latino
Geographical mobility - Same house 1 year ago (%) - American Indian and Alaska Native
Geographical mobility - Same house 1 year ago (%) - Multirace
Geographical mobility - Same house 1 year ago (%) - Other Race
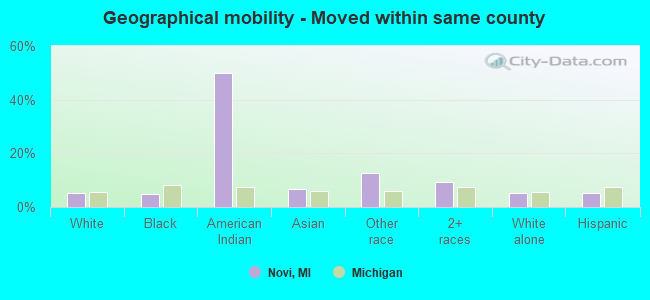
Geographical mobility - Moved within same county (%)
Geographical mobility - Moved within same county (%) - White
Geographical mobility - Moved within same county (%) - Black or African American
Geographical mobility - Moved within same county (%) - Asian
Geographical mobility - Moved within same county (%) - Hispanic or Latino
Geographical mobility - Moved within same county (%) - American Indian and Alaska Native
Geographical mobility - Moved within same county (%) - Multirace
Geographical mobility - Moved within same county (%) - Other Race
Geographical mobility - Moved from different county within same state (%)
Geographical mobility - Moved from different county within same state (%) - White
Geographical mobility - Moved from different county within same state (%) - Black or African American
Geographical mobility - Moved from different county within same state (%) - Asian
Geographical mobility - Moved from different county within same state (%) - Hispanic or Latino
Geographical mobility - Moved from different county within same state (%) - American Indian and Alaska Native
Geographical mobility - Moved from different county within same state (%) - Multirace
Geographical mobility - Moved from different county within same state (%) - Other Race
Geographical mobility - Moved from different state (%)
Geographical mobility - Moved from different state (%) - White
Geographical mobility - Moved from different state (%) - Black or African American
Geographical mobility - Moved from different state (%) - Asian
Geographical mobility - Moved from different state (%) - Hispanic or Latino
Geographical mobility - Moved from different state (%) - American Indian and Alaska Native
Geographical mobility - Moved from different state (%) - Multirace
Geographical mobility - Moved from different state (%) - Other Race
Geographical mobility - Moved from abroad (%)
Geographical mobility - Moved from abroad (%) - White
Geographical mobility - Moved from abroad (%) - Black or African American
Geographical mobility - Moved from abroad (%) - Asian
Geographical mobility - Moved from abroad (%) - Hispanic or Latino
Geographical mobility - Moved from abroad (%) - American Indian and Alaska Native
Geographical mobility - Moved from abroad (%) - Multirace
Geographical mobility - Moved from abroad (%) - Other Race
Place of birth for the foreign-born population - Ireland (%)
Place of birth for the foreign-born population - Denmark (%)
Place of birth for the foreign-born population - Norway (%)
Place of birth for the foreign-born population - Sweden (%)
Place of birth for the foreign-born population - United Kingdom (%)
Place of birth for the foreign-born population - England (%)
Place of birth for the foreign-born population - Scotland (%)
Place of birth for the foreign-born population - Other Northern Europe (%)
Place of birth for the foreign-born population - Austria (%)
Place of birth for the foreign-born population - Belgium (%)
Place of birth for the foreign-born population - France (%)
Place of birth for the foreign-born population - Germany (%)
Place of birth for the foreign-born population - Netherlands (%)
Place of birth for the foreign-born population - Switzerland (%)
Place of birth for the foreign-born population - Other Western Europe (%)
Place of birth for the foreign-born population - Greece (%)
Place of birth for the foreign-born population - Italy (%)
Place of birth for the foreign-born population - Portugal (%)
Place of birth for the foreign-born population - Spain (%)
Place of birth for the foreign-born population - Other Southern Europe (%)
Place of birth for the foreign-born population - Albania (%)
Place of birth for the foreign-born population - Belarus (%)
Place of birth for the foreign-born population - Bosnia and Herzegovina (%)
Place of birth for the foreign-born population - Bulgaria (%)
Place of birth for the foreign-born population - Croatia (%)
Place of birth for the foreign-born population - Czechoslovakia (%)
Place of birth for the foreign-born population - Hungary (%)
Place of birth for the foreign-born population - Latvia (%)
Place of birth for the foreign-born population - Lithuania (%)
Place of birth for the foreign-born population - North Macedonia (Macedonia) (%)
Place of birth for the foreign-born population - Moldova (%)
Place of birth for the foreign-born population - Poland (%)
Place of birth for the foreign-born population - Romania (%)
Place of birth for the foreign-born population - Russia (%)
Place of birth for the foreign-born population - Serbia (%)
Place of birth for the foreign-born population - Ukraine (%)
Place of birth for the foreign-born population - Other Eastern Europe (%)
Place of birth for the foreign-born population - China (%)
Place of birth for the foreign-born population - Hong Kong (%)
Place of birth for the foreign-born population - Taiwan (%)
Place of birth for the foreign-born population - Japan (%)
Place of birth for the foreign-born population - Korea (%)
Place of birth for the foreign-born population - Other Eastern Asia (%)
Place of birth for the foreign-born population - Afghanistan (%)
Place of birth for the foreign-born population - Bangladesh (%)
Place of birth for the foreign-born population - India (%)
Place of birth for the foreign-born population - Iran (%)
Place of birth for the foreign-born population - Kazakhstan (%)
Place of birth for the foreign-born population - Nepal (%)
Place of birth for the foreign-born population - Pakistan (%)
Place of birth for the foreign-born population - Sri Lanka (%)
Place of birth for the foreign-born population - Uzbekistan (%)
Place of birth for the foreign-born population - Other South Central Asia (%)
Place of birth for the foreign-born population - Burma (%)
Place of birth for the foreign-born population - Cambodia (%)
Place of birth for the foreign-born population - Indonesia (%)
Place of birth for the foreign-born population - Laos (%)
Place of birth for the foreign-born population - Malaysia (%)
Place of birth for the foreign-born population - Philippines (%)
Place of birth for the foreign-born population - Singapore (%)
Place of birth for the foreign-born population - Thailand (%)
Place of birth for the foreign-born population - Vietnam (%)
Place of birth for the foreign-born population - Other South Eastern Asia (%)
Place of birth for the foreign-born population - Armenia (%)
Place of birth for the foreign-born population - Iraq (%)
Place of birth for the foreign-born population - Israel (%)
Place of birth for the foreign-born population - Jordan (%)
Place of birth for the foreign-born population - Kuwait (%)
Place of birth for the foreign-born population - Lebanon (%)
Place of birth for the foreign-born population - Saudi Arabia (%)
Place of birth for the foreign-born population - Syria (%)
Place of birth for the foreign-born population - Turkey (%)
Place of birth for the foreign-born population - Yemen (%)
Place of birth for the foreign-born population - Other Western Asia (%)
Place of birth for the foreign-born population - Eritrea (%)
Place of birth for the foreign-born population - Ethiopia (%)
Place of birth for the foreign-born population - Kenya (%)
Place of birth for the foreign-born population - Somalia (%)
Place of birth for the foreign-born population - Uganda (%)
Place of birth for the foreign-born population - Zimbabwe (%)
Place of birth for the foreign-born population - Other Eastern Africa (%)
Place of birth for the foreign-born population - Cameroon (%)
Place of birth for the foreign-born population - Congo (%)
Place of birth for the foreign-born population - Democratic Republic of Congo (Zaire) (%)
Place of birth for the foreign-born population - Other Middle Africa (%)
Place of birth for the foreign-born population - Egypt (%)
Place of birth for the foreign-born population - Morocco (%)
Place of birth for the foreign-born population - Sudan (%)
Place of birth for the foreign-born population - Other Northern Africa (%)
Place of birth for the foreign-born population - South Africa (%)
Place of birth for the foreign-born population - Other Southern Africa (%)
Place of birth for the foreign-born population - Cabo Verde (%)
Place of birth for the foreign-born population - Ghana (%)
Place of birth for the foreign-born population - Liberia (%)
Place of birth for the foreign-born population - Nigeria (%)
Place of birth for the foreign-born population - Senegal (%)
Place of birth for the foreign-born population - Sierra Leone (%)
Place of birth for the foreign-born population - Other Western Africa (%)
Place of birth for the foreign-born population - Australia (%)
Place of birth for the foreign-born population - New Zealand (%)
Place of birth for the foreign-born population - Fiji (%)
Place of birth for the foreign-born population - Micronesia (%)
Place of birth for the foreign-born population - Bahamas (%)
Place of birth for the foreign-born population - Barbados (%)
Place of birth for the foreign-born population - Cuba (%)
Place of birth for the foreign-born population - Dominica (%)
Place of birth for the foreign-born population - Dominican Republic (%)
Place of birth for the foreign-born population - Grenada (%)
Place of birth for the foreign-born population - Haiti (%)
Place of birth for the foreign-born population - Jamaica (%)
Place of birth for the foreign-born population - St. Vincent and the Grenadines (%)
Place of birth for the foreign-born population - Trinidad and Tobago (%)
Place of birth for the foreign-born population - West Indies (%)
Place of birth for the foreign-born population - Other Caribbean (%)
Place of birth for the foreign-born population - Belize (%)
Place of birth for the foreign-born population - Costa Rica (%)
Place of birth for the foreign-born population - El Salvador (%)
Place of birth for the foreign-born population - Guatemala (%)
Place of birth for the foreign-born population - Honduras (%)
Place of birth for the foreign-born population - Mexico (%)
Place of birth for the foreign-born population - Nicaragua (%)
Place of birth for the foreign-born population - Panama (%)
Place of birth for the foreign-born population - Other Central America (%)
Place of birth for the foreign-born population - Argentina (%)
Place of birth for the foreign-born population - Bolivia (%)
Place of birth for the foreign-born population - Brazil (%)
Place of birth for the foreign-born population - Chile (%)
Place of birth for the foreign-born population - Colombia (%)
Place of birth for the foreign-born population - Ecuador (%)
Place of birth for the foreign-born population - Guyana (%)
Place of birth for the foreign-born population - Peru (%)
Place of birth for the foreign-born population - Uruguay (%)
Place of birth for the foreign-born population - Venezuela (%)
Place of birth for the foreign-born population - Other South America (%)
Place of birth for the foreign-born population - Canada (%)
Place of birth for the foreign-born population - Other Northern America (%)
Place of birth for the foreign-born population - Other (%)
Latest news about races in Novi, MI collected exclusively by city-data.com from local newspapers, TV, and radio stations
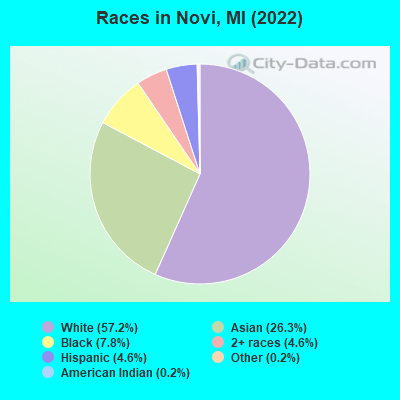
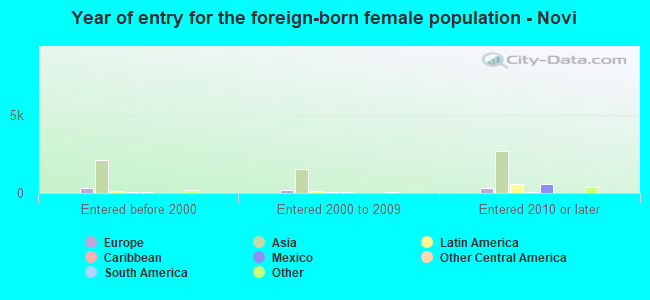
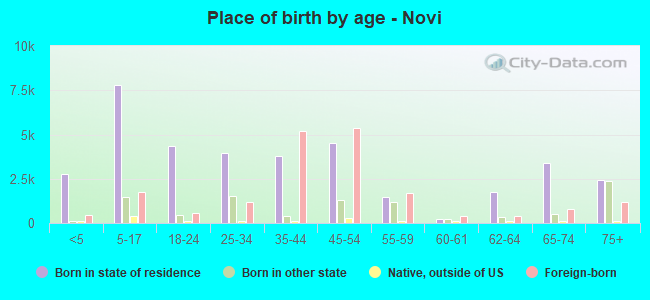
According to 2022 data, the most numerous races in Novi, MI are White alone (37,625 residents), Black alone (5,145 residents), and Hispanic (3,011 residents). 69.4% of Novi residents speak English at home. 27.2% of Novi, MI residents are foreign-born (20.0% born in Asia, 3.0% born in Europe), which is 77.9% greater than the foreign-born rate of 6.0% across the entire state of Michigan.
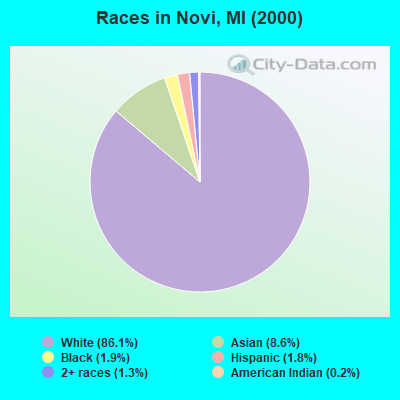
Race distribution in Novi
2000 2022
7,806,691 78.6% White alone 1,402,047 14.1% Black alone 323,877 3.3% Hispanic 175,311 1.8% Asian alone 163,487 1.6% Two or more races 53,421 0.5% American Indian alone 11,465 0.1% Other race alone 2,145 0.02% Native Hawaiian and Other
7,289,051 72.6% White alone 1,310,464 13.1% Black alone 572,405 5.7% Hispanic 450,031 4.5% Two or more races 335,732 3.3% Asian alone 45,217 0.5% Other race alone 29,011 0.3% American Indian alone 2,207 0.02% Native Hawaiian and Other
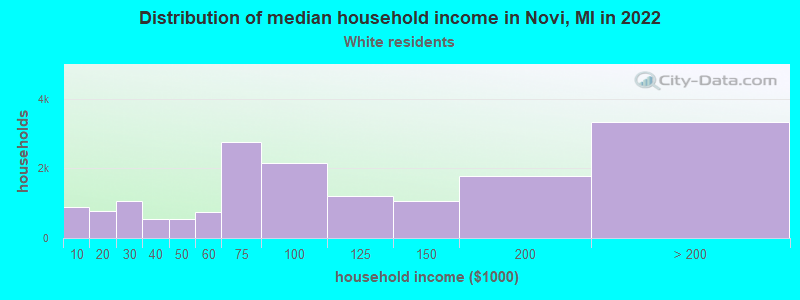
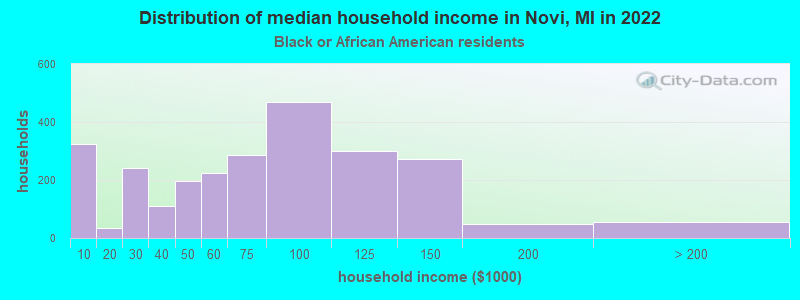
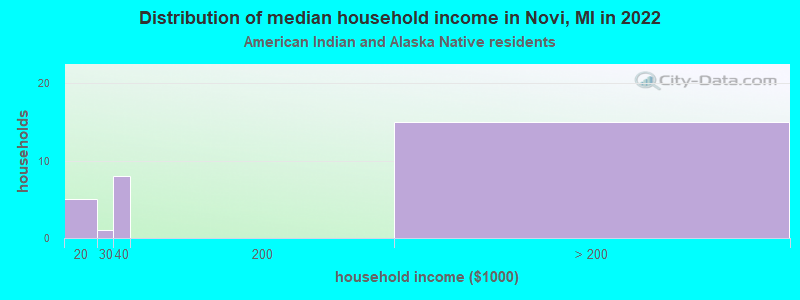
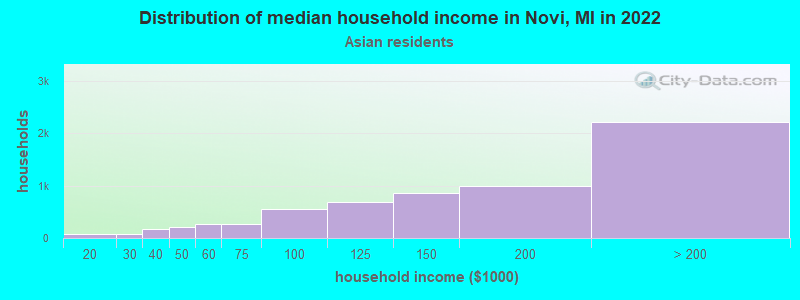
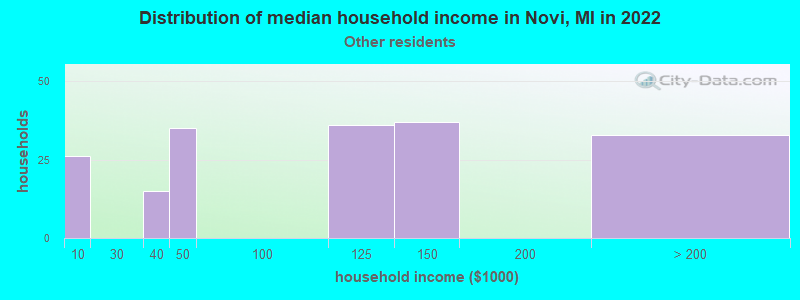
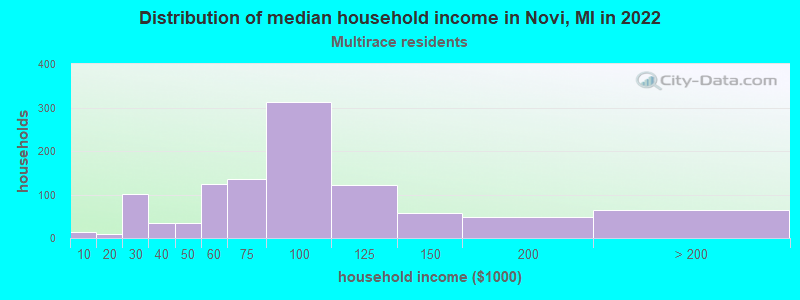
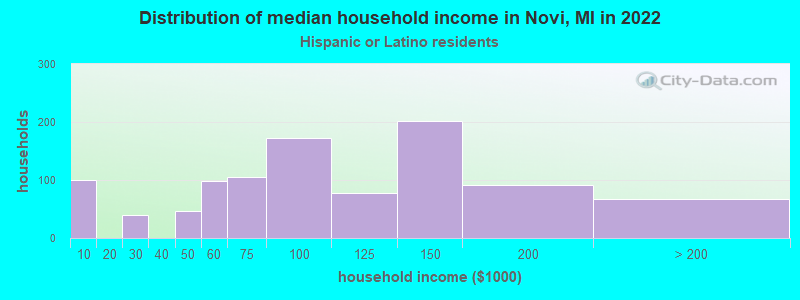
Income and house value in Novi Median household income in 2022 $91,080 White non-Hispanic householders$89,341 Black householders$146,575 Asian householders$102,051 Two or more races householders$99,710 Hispanic or Latino race householdersMedian 2022 house value $453,147 White Non-Hispanic householders$472,467 Black or African American householders$317,124 American Indian or Alaska Native householders $618,832 Asian householders$363,961 Some other race householders$563,799 Two or more races householders$378,793 Hispanic or Latino householders
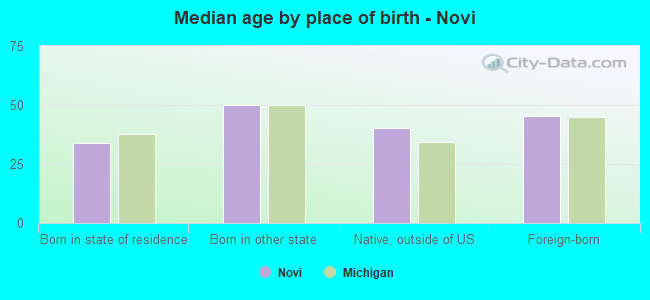
Median age by race in Novi
46.0 Median age for White residents45.5 46.4 37.9 Median age for Black or African American residents42.2 37.4 10.0 Median age for American Indian / Alaska Native residents-666,666,666.0 -666,666,666.0 42.1 Median age for Asian residents42.2 41.9 -666,666,666.0 Median age for Native Hawaiian / Pacific Islander residents-666,666,666.0 -666,666,666.0 37.3 Median age for Other race residents26.6 37.9 23.0 Median age for Two or more races residents20.9 33.9 45.4 Median age for White alone residents44.3 46.3 37.6 Median age for Hispanic or Latino residents30.1 46.5
Owner/renter occupied households by race in Novi
House owners and renters - White residents 11,400 67.5% Owner occupied5,488 32.5% Renter occupiedHouse owners and renters - Black or African American residents 1,030 35.7% Owner occupied1,854 64.3% Renter occupiedHouse owners and renters - American Indian / Alaska Native residents 18 94.0% Owner occupied1 6.0% Renter occupiedHouse owners and renters - Asian residents 4,324 67.1% Owner occupied2,116 32.9% Renter occupiedHouse owners and renters - Other race residents 78 34.6% Owner occupied147 65.4% Renter occupiedHouse owners and renters - Two or more races residents 841 79.1% Owner occupied222 20.9% Renter occupiedHouse owners and renters - White alone residents 11,071 68.3% Owner occupied5,127 31.7% Renter occupiedHouse owners and renters - Hispanic or Latino residents 589 51.3% Owner occupied560 48.7% Renter occupied
Language usage in Novi
English speakers - Total 69.4% of residents of Novi speak English at home.
3.0% of residents speak Spanish at home 1,312 70.2% Speak English very well558 29.8% Speak English less than very well27.5% of residents speak other language at home 11,772 68.6% Speak English very well5,381 31.4% Speak English less than very well
English speakers - Born in the United States 91.5% of residents of Novi speak English at home.
2.4% of residents speak Spanish at home 200 87.0% Speak English very well30 13.0% Speak English less than very well5.3% of residents speak other language at home 437 87.6% Speak English very well62 12.4% Speak English less than very well
English speakers - Native, born elsewhere 75.4% of residents of Novi speak English at home.
7.3% of residents speak Spanish at home 27 100.0% Speak English very well25.7% of residents speak other language at home 69 72.6% Speak English very well26 27.4% Speak English less than very well
English speakers - Foreign-born 14.0% of residents of Novi speak English at home.
8.0% of residents speak Spanish at home 906 64.0% Speak English very well510 36.0% Speak English less than very well77.1% of residents speak other language at home 8,808 64.9% Speak English very well4,772 35.1% Speak English less than very well
White (Caucasian) - Speak only English Native:
94.0% (29,654)Foreign-born:
21.5% (741)
White (Caucasian) - Speak another language Native:
6.0% (1,904)Foreign-born:
78.5% (2,703)
Black or African American - Speak only English Native:
94.4% (4,226)Foreign-born:
30.4% (163)
Black or African American - Speak another language Native:
5.6% (250)Foreign-born:
66.5% (356)
Asian - Speak only English Native:
37.4% (1,749)Foreign-born:
9.6% (1,261)
Asian - Speak another language Native:
62.6% (2,926)Foreign-born:
90.4% (11,940)
Other race - Speak only English Native:
56.5% (248)Foreign-born:
0.6% (3)
Other race - Speak another language Native:
43.6% (191)Foreign-born:
100.0% (452)
Two or more races - Speak only English Native:
88.0% (2,517)Foreign-born:
51.7% (537)
Two or more races - Speak another language Native:
12.0% (344)Foreign-born:
42.3% (440)
White alone - Speak only English Native:
93.8% (28,964)Foreign-born:
21.5% (741)
White alone - Speak another language Native:
6.2% (1,904)Foreign-born:
78.5% (2,703)
Hispanic or Latino - Speak only English Native:
72.0% (1,049)Foreign-born:
5.3% (76)
Hispanic or Latino - Speak another language Native:
26.9% (392)Foreign-born:
95.0% (1,370)
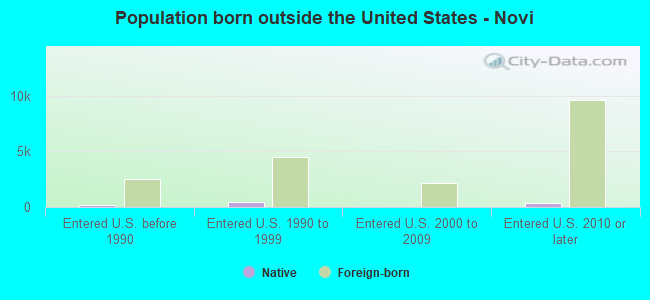
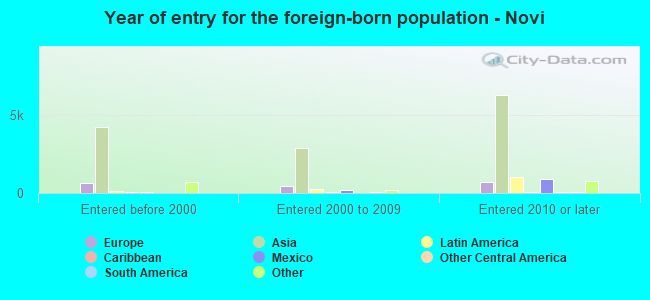
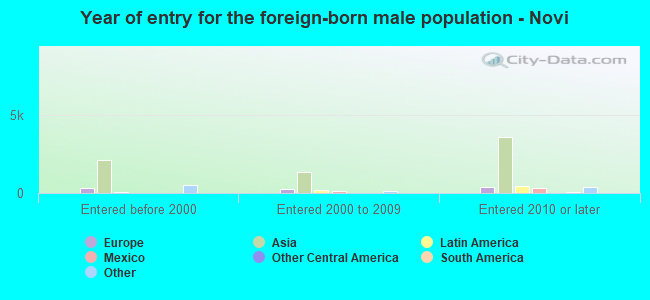
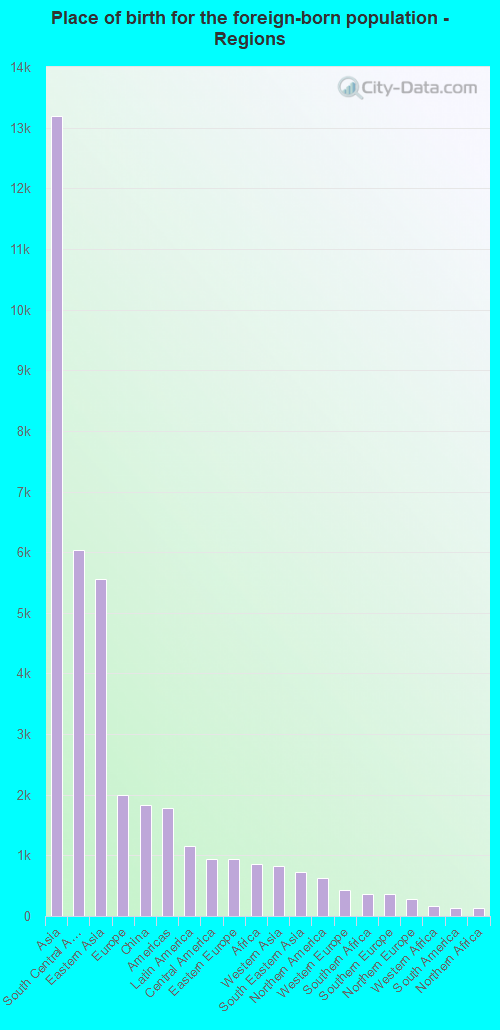
Foreign-born residents in Novi 17,852 residents are foreign born (20.0% Asia , 3.0% Europe ).
This city:
27.2%Michigan:
6.9%
Marital status for residents in Novi Marital status - White (Caucasian) population 15 years and over
Males 30.5% Never married58.7% Now married0.0% Separated3.4% Widowed7.3% DivorcedFemales 29.6% Never married54.5% Now married0.0% Separated9.9% Widowed6.0% DivorcedWomen who gave birth in the past 12 months Now married:
78.5% (245)Unmarried:
21.5% (67)
Women who did not give birth in the past 12 months Now married:
47.3% (3,804)Unmarried:
52.7% (4,240)
Marital status - Black or African American population 15 years and over
Males 44.2% Never married37.1% Now married0.4% Separated3.7% Widowed14.5% DivorcedFemales 52.5% Never married21.2% Now married1.7% Separated14.1% Widowed10.5% DivorcedWomen who gave birth in the past 12 months Now married:
14.1% (10)Unmarried:
85.9% (62)
Women who did not give birth in the past 12 months Now married:
20.8% (319)Unmarried:
79.2% (1,215)
Marital status - American Indian / Alaska Native population 15 years and over
Males 0.0% Never married100.0% Now married0.0% Separated0.0% Widowed0.0% DivorcedFemales 17.5% Never married80.0% Now married2.5% Separated0.0% Widowed0.0% DivorcedWomen who did not give birth in the past 12 months Now married:
12.5% (1)Unmarried:
87.5% (7)
Marital status - Asian population 15 years and over
Males 20.0% Never married77.0% Now married0.2% Separated1.7% Widowed1.1% DivorcedFemales 16.6% Never married74.9% Now married0.4% Separated2.3% Widowed5.8% DivorcedWomen who gave birth in the past 12 months Now married:
100.0% (193)Unmarried:
0.0% (0)
Women who did not give birth in the past 12 months Now married:
63.6% (2,861)Unmarried:
36.4% (1,639)
Marital status - Other race population 15 years and over
Males 35.9% Never married64.1% Now married0.0% Separated0.0% Widowed0.0% DivorcedFemales 6.8% Never married88.2% Now married4.2% Separated0.8% Widowed0.0% DivorcedWomen who gave birth in the past 12 months Now married:
71.4% (22)Unmarried:
28.6% (9)
Women who did not give birth in the past 12 months Now married:
90.3% (136)Unmarried:
9.7% (15)
Marital status - Two or more races population 15 years and over
Males 46.7% Never married44.2% Now married0.0% Separated0.0% Widowed9.2% DivorcedFemales 28.0% Never married53.8% Now married0.0% Separated1.5% Widowed16.7% DivorcedWomen who did not give birth in the past 12 months Now married:
52.1% (474)Unmarried:
47.9% (435)
Marital status - White alone, not Hispanic / Latino population 15 years and over
Males 30.0% Never married58.8% Now married0.0% Separated3.6% Widowed7.6% DivorcedFemales 29.7% Never married54.7% Now married0.0% Separated9.9% Widowed5.7% DivorcedWomen who gave birth in the past 12 months Now married:
78.5% (245)Unmarried:
21.5% (67)
Women who did not give birth in the past 12 months Now married:
47.3% (3,804)Unmarried:
52.7% (4,240)
Marital status - Hispanic or Latino population 15 years and over
Males 36.6% Never married57.8% Now married0.0% Separated0.0% Widowed5.6% DivorcedFemales 20.8% Never married53.8% Now married1.2% Separated5.7% Widowed18.5% DivorcedWomen who gave birth in the past 12 months Now married:
71.4% (16)Unmarried:
28.6% (7)
Women who did not give birth in the past 12 months Now married:
58.6% (362)Unmarried:
41.4% (256)
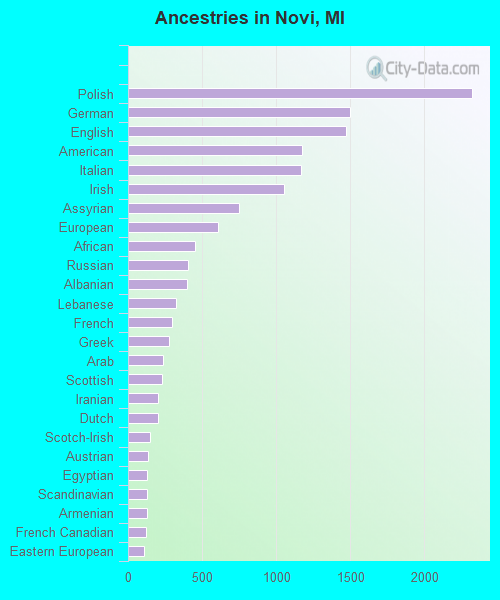
Ancestries in Novi
2,323 6.5% Polish1,499 4.2% German1,473 4.1% English1,179 3.3% American1,166 3.3% Italian1,052 3.0% Irish752 2.1% Assyrian609 1.7% European453 1.3% African405 1.1% Russian396 1.1% Albanian323 0.9% Lebanese299 0.8% French275 0.8% Greek237 0.7% Arab233 0.7% Scottish203 0.6% Iranian203 0.6% Dutch146 0.4% Scotch-Irish136 0.4% Austrian131 0.4% Egyptian127 0.4% Scandinavian127 0.4% Armenian124 0.3% French Canadian109 0.3% Eastern European107 0.3% Hungarian104 0.3% Iraqi99 0.3% Lithuanian93 0.3% Canadian92 0.3% Macedonian81 0.2% Finnish79 0.2% Bulgarian78 0.2% Swedish75 0.2% Slovak74 0.2% Romanian74 0.2% Ukrainian73 0.2% Serbian61 0.2% Norwegian54 0.2% Ghanaian54 0.2% Trinidadian and Tobagonian50 0.1% Swiss44 0.1% Nigerian41 0.1% British32 0.09% Czech29 0.08% Brazilian28 0.08% South African28 0.08% Danish27 0.08% Syrian27 0.08% Czechoslovakian26 0.07% Maltese26 0.07% Belgian20 0.06% Turkish17 0.05% Jordanian13 0.04% Slovene13 0.04% Palestinian10 0.03% Northern European8 0.02% Yugoslavian3 0.01% Israeli
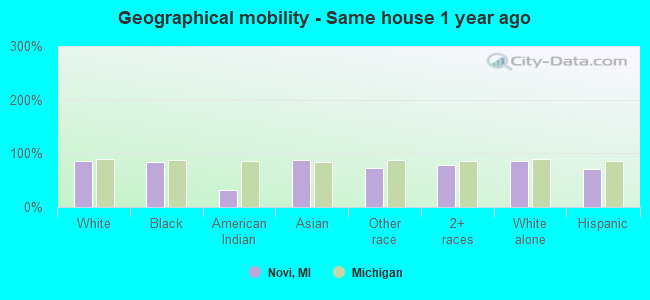
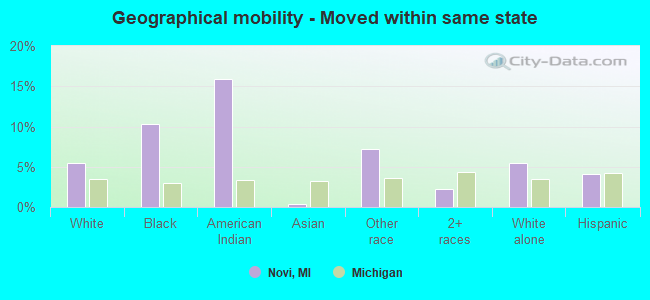
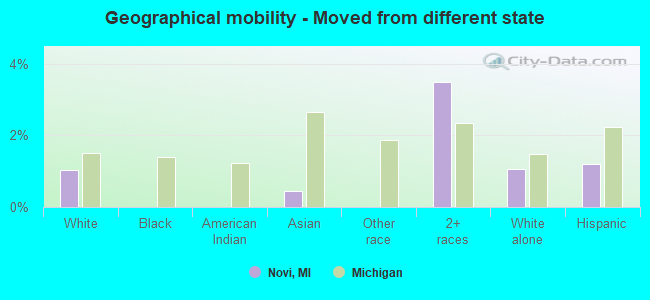
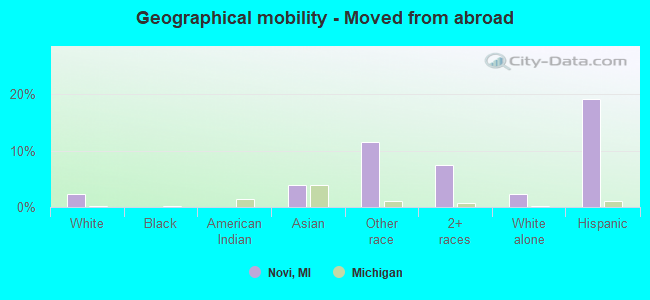
Geographical mobility in Novi Same house 1 year ago 31,312 86.0% White (Caucasian)4,293 84.8% Black or African American33 31.9% American Indian / Alaska Native16,169 88.5% Asian685 72.1% Other race3,265 77.5% Two or more races30,622 85.7% White alone, not Hispanic / Latino2,095 70.0% Hispanic or LatinoMoved within same county 1,916 5.3% White / Caucasian251 5.0% Black or African American52 49.8% American Indian / Alaska Native1,249 6.8% Asian119 12.5% Other race388 9.2% Two or more races1,916 5.4% White alone, not Hispanic / Latino157 5.2% Hispanic or LatinoMoved within same state 1,973 5.4% White / Caucasian520 10.3% Black or African American17 16.0% American Indian / Alaska Native58 0.3% Asian69 7.2% Other race97 2.3% Two or more races1,973 5.5% White alone, not Hispanic / Latino122 4.1% Hispanic or LatinoMoved from different state 381 1.0% White / Caucasian81 0.4% Asian147 3.5% Two or more races381 1.1% White alone, not Hispanic / Latino36 1.2% Hispanic or LatinoMoved from abroad 839 2.3% White706 3.9% Asian110 11.5% Other race314 7.5% Two or more races839 2.3% White alone, not Hispanic / Latino571 19.1% Hispanic or Latino
Children Nativity (place of birth) in Novi
Children under 6 years - Living with two parents Both parents native 1,965 100.0% NativeBoth parents foreign-born 553 50.5% Native541 49.5% Foreign-bornOne native, one foreign-born parent 183 100.0% NativeChildren under 6 years - Living with one parent Native parent 1,203 100.0% NativeChildren 6 to 17 years - Living with two parents Both parents native 3,336 100.0% NativeBoth parents foreign-born 2,573 61.7% Native1,594 38.3% Foreign-bornOne native, one foreign-born parent 910 100.0% NativeChildren 6 to 17 years - Living with one parent Native parent 1,008 100.0% NativeForeign-born parent 240 50.0% Native240 50.0% Foreign-born
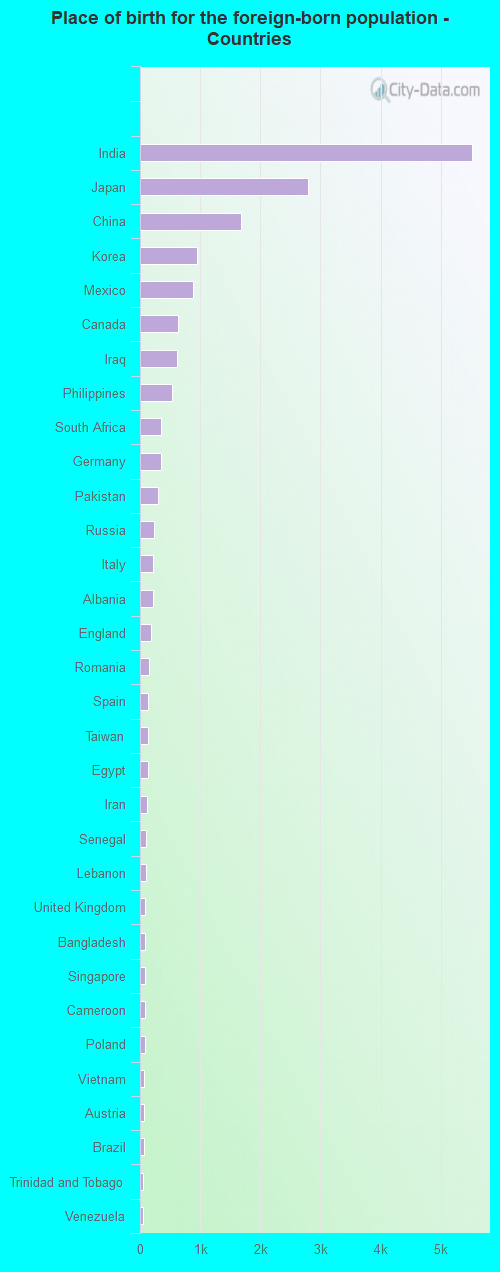
Place of birth for residents in Novi 13,196 Asia6,041 South Central Asia5,561 Eastern Asia1,990 Europe1,825 China1,784 Americas1,160 Latin America939 Central America933 Eastern Europe861 Africa830 Western Asia733 South Eastern Asia624 Northern America427 Western Europe357 Southern Africa355 Southern Europe275 Northern Europe162 Western Africa135 South America126 Northern Africa100 Eastern Africa86 Caribbean82 Middle Africa19 Oceania19 Australia and New Zealand Subregion5,526 India2,785 Japan1,682 China950 Korea888 Mexico624 Canada622 Iraq539 Philippines357 South Africa352 Germany307 Pakistan229 Russia219 Italy209 Albania178 England143 Romania136 Spain129 Taiwan126 Egypt110 Iran102 Senegal98 Lebanon86 United Kingdom86 Bangladesh85 Singapore82 Cameroon75 Poland66 Vietnam59 Austria59 Brazil58 Trinidad and Tobago58 Venezuela45 Syria45 El Salvador38 Ukraine31 Jordan31 Serbia28 Ghana28 Cuba26 Indonesia22 Israel19 Australia17 Nigeria17 Malaysia16 Kenya14 Hong Kong13 Bulgaria13 Peru12 Sri Lanka12 Saudi Arabia11 Denmark10 North Macedonia (Macedonia)10 Netherlands10 Sierra Leone9 Ethiopia7 Hungary6 Guatemala6 Latvia6 France5 Colombia5 Ivory Coast
Grandparents responsible for own grandchildren in Novi
Grandparents (30 to 59 years) White / Caucasian 28 65.7% Responsible for grandchildren14 34.3% Not responsible for grandchildrenBlack or African American 60 100.0% Responsible for grandchildrenAsian 39 100.0% Not responsible for grandchildrenOther race 8 34.2% Responsible for grandchildren16 65.8% Not responsible for grandchildrenWhite alone, not Hispanic / Latino 29 66.1% Responsible for grandchildren15 33.9% Not responsible for grandchildrenHispanic or Latino 4 20.8% Responsible for grandchildren16 79.2% Not responsible for grandchildrenGrandparents (60 years and over) White / Caucasian 13 4.1% Responsible for grandchildren303 95.9% Not responsible for grandchildrenBlack or African American 28 17.7% Responsible for grandchildren131 82.3% Not responsible for grandchildrenAsian 174 100.0% Not responsible for grandchildrenOther race 86 100.0% Not responsible for grandchildrenWhite alone, not Hispanic / Latino 14 4.6% Responsible for grandchildren281 95.4% Not responsible for grandchildrenHispanic or Latino 14 100.0% Not responsible for grandchildren