Races in O'Fallon, Missouri (MO) Detailed Stats
Data:
Races - White alone (%)
Races - White alone (% change since 2000)
Races - Black alone (%)
Races - Black alone (% change since 2000)
Races - American Indian alone (%)
Races - American Indian alone (% change since 2000)
Races - Asian alone (%)
Races - Asian alone (% change since 2000)
Races - Hispanic (%)
Races - Hispanic (% change since 2000)
Races - Native Hawaiian and Other Pacific Islander alone (%)
Races - Native Hawaiian and Other Pacific Islander alone (% change since 2000)
Races - Two or more races(%)
Races - Two or more races(% change since 2000)
Races - Other race alone (%)
Races - Other race alone (% change since 2000)
Racial diversity
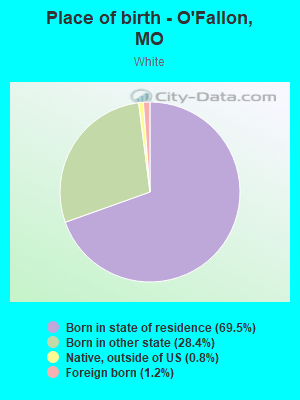
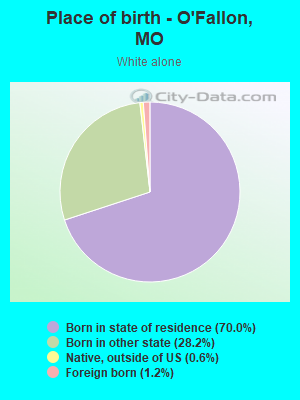
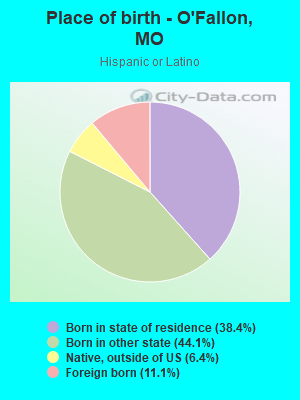
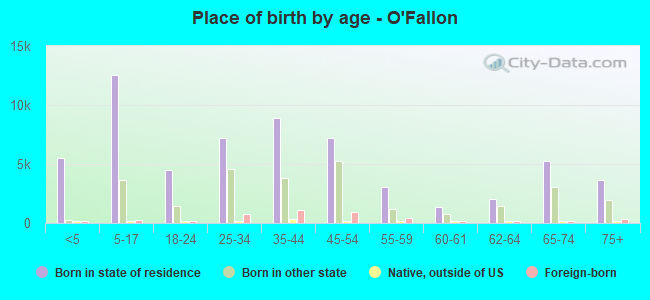
Place of birth - Born in state of residence (%)
Place of birth - Born in state of residence (%) - White
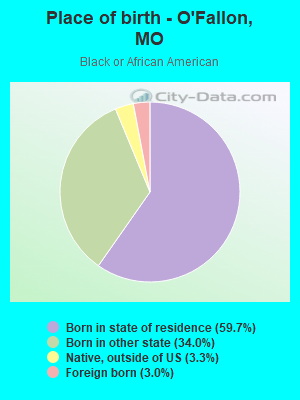
Place of birth - Born in state of residence (%) - Black or African American
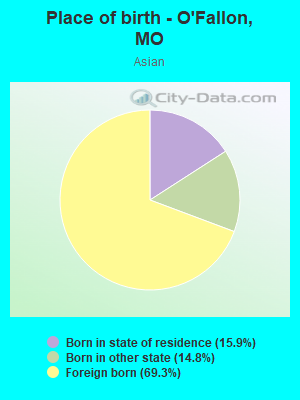
Place of birth - Born in state of residence (%) - Asian
Place of birth - Born in state of residence (%) - Hispanic or Latino
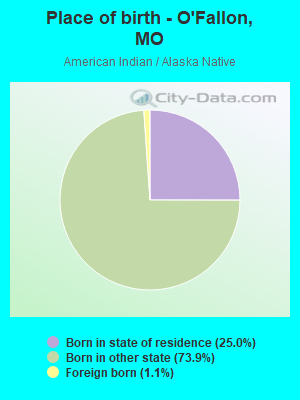
Place of birth - Born in state of residence (%) - American Indian and Alaska Native
Place of birth - Born in state of residence (%) - Multirace
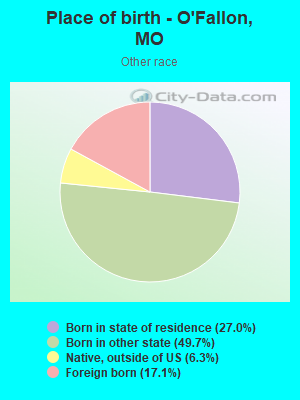
Place of birth - Born in state of residence (%) - Other Race
Place of birth - Born in other state (%)
Place of birth - Born in other state (%) - White
Place of birth - Born in other state (%) - Black or African American
Place of birth - Born in other state (%) - Asian
Place of birth - Born in other state (%) - Hispanic or Latino
Place of birth - Born in other state (%) - American Indian and Alaska Native
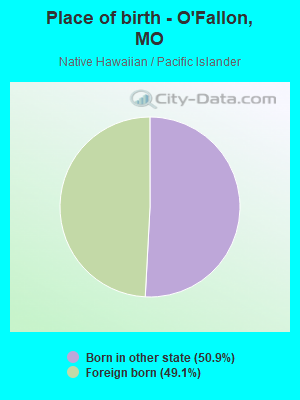
Place of birth - Born in other state (%) - Multirace
Place of birth - Born in other state (%) - Other Race
Place of birth - Native, outside of US (%)
Place of birth - Native, outside of US (%) - White
Place of birth - Native, outside of US (%) - Black or African American
Place of birth - Native, outside of US (%) - Asian
Place of birth - Native, outside of US (%) - Hispanic or Latino
Place of birth - Native, outside of US (%) - American Indian and Alaska Native
Place of birth - Native, outside of US (%) - Multirace
Place of birth - Native, outside of US (%) - Other Race
Place of birth - Foreign born (%)
Place of birth - Foreign born (%) - White
Place of birth - Foreign born (%) - Black or African American
Place of birth - Foreign born (%) - Asian
Place of birth - Foreign born (%) - Hispanic or Latino
Place of birth - Foreign born (%) - American Indian and Alaska Native
Place of birth - Foreign born (%) - Multirace
Place of birth - Foreign born (%) - Other Race
Residents speaking English at home (%)
Residents speaking English at home - Born in the United States (%)
Residents speaking English at home - Native, born elsewhere (%)
Residents speaking English at home - Foreign born (%)
Residents speaking Spanish at home (%)
Residents speaking Spanish at home - Born in the United States (%)
Residents speaking Spanish at home - Native, born elsewhere (%)
Residents speaking Spanish at home - Foreign born (%)
Residents speaking other language at home (%)
Residents speaking other language at home - Born in the United States (%)
Residents speaking other language at home - Native, born elsewhere (%)
Residents speaking other language at home - Foreign born (%)
Marital status - Never married (%)
Marital status - Now married (%)
Marital status - Separated (%)
Marital status - Widowed (%)
Marital status - Divorced (%)
Ancestries Reported - Arab (%)
Ancestries Reported - Czech (%)
Ancestries Reported - Danish (%)
Ancestries Reported - Dutch (%)
Ancestries Reported - English (%)
Ancestries Reported - French (%)
Ancestries Reported - French Canadian (%)
Ancestries Reported - German (%)
Ancestries Reported - Greek (%)
Ancestries Reported - Hungarian (%)
Ancestries Reported - Irish (%)
Ancestries Reported - Italian (%)
Ancestries Reported - Lithuanian (%)
Ancestries Reported - Norwegian (%)
Ancestries Reported - Polish (%)
Ancestries Reported - Portuguese (%)
Ancestries Reported - Russian (%)
Ancestries Reported - Scotch-Irish (%)
Ancestries Reported - Scottish (%)
Ancestries Reported - Slovak (%)
Ancestries Reported - Subsaharan African (%)
Ancestries Reported - Swedish (%)
Ancestries Reported - Swiss (%)
Ancestries Reported - Ukrainian (%)
Ancestries Reported - United States (%)
Ancestries Reported - Welsh (%)
Ancestries Reported - West Indian (%)
Ancestries Reported - Other (%)
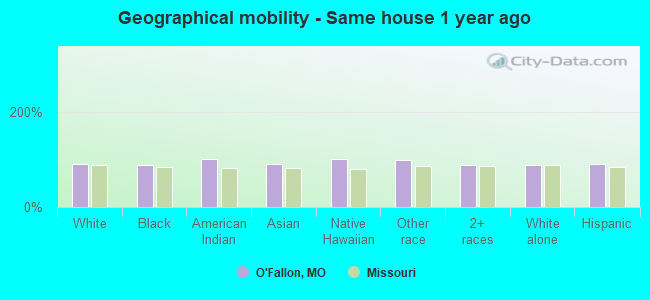
Geographical mobility - Same house 1 year ago (%)
Geographical mobility - Same house 1 year ago (%) - White
Geographical mobility - Same house 1 year ago (%) - Black or African American
Geographical mobility - Same house 1 year ago (%) - Asian
Geographical mobility - Same house 1 year ago (%) - Hispanic or Latino
Geographical mobility - Same house 1 year ago (%) - American Indian and Alaska Native
Geographical mobility - Same house 1 year ago (%) - Multirace
Geographical mobility - Same house 1 year ago (%) - Other Race
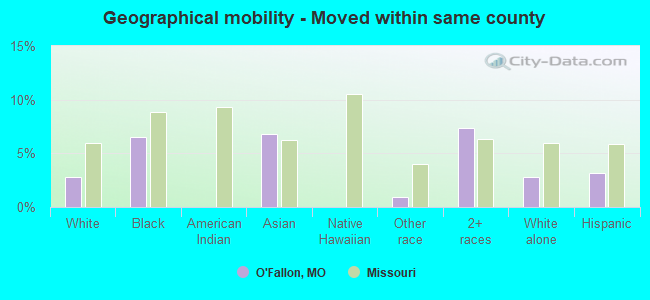
Geographical mobility - Moved within same county (%)
Geographical mobility - Moved within same county (%) - White
Geographical mobility - Moved within same county (%) - Black or African American
Geographical mobility - Moved within same county (%) - Asian
Geographical mobility - Moved within same county (%) - Hispanic or Latino
Geographical mobility - Moved within same county (%) - American Indian and Alaska Native
Geographical mobility - Moved within same county (%) - Multirace
Geographical mobility - Moved within same county (%) - Other Race
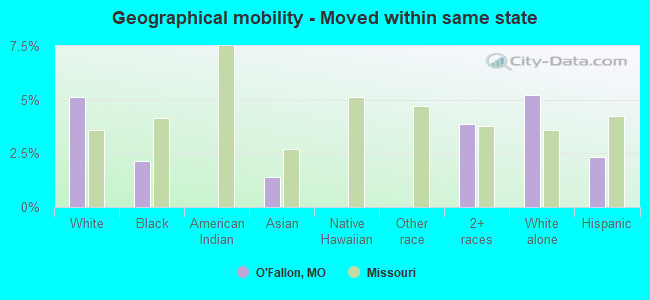
Geographical mobility - Moved from different county within same state (%)
Geographical mobility - Moved from different county within same state (%) - White
Geographical mobility - Moved from different county within same state (%) - Black or African American
Geographical mobility - Moved from different county within same state (%) - Asian
Geographical mobility - Moved from different county within same state (%) - Hispanic or Latino
Geographical mobility - Moved from different county within same state (%) - American Indian and Alaska Native
Geographical mobility - Moved from different county within same state (%) - Multirace
Geographical mobility - Moved from different county within same state (%) - Other Race
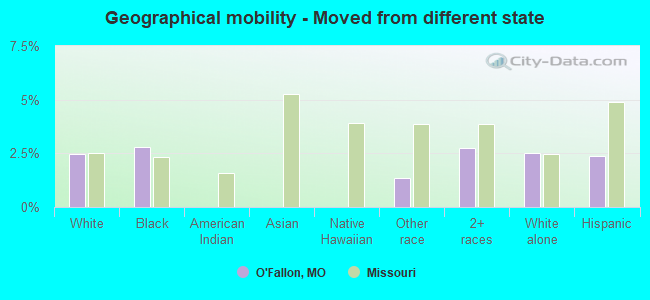
Geographical mobility - Moved from different state (%)
Geographical mobility - Moved from different state (%) - White
Geographical mobility - Moved from different state (%) - Black or African American
Geographical mobility - Moved from different state (%) - Asian
Geographical mobility - Moved from different state (%) - Hispanic or Latino
Geographical mobility - Moved from different state (%) - American Indian and Alaska Native
Geographical mobility - Moved from different state (%) - Multirace
Geographical mobility - Moved from different state (%) - Other Race
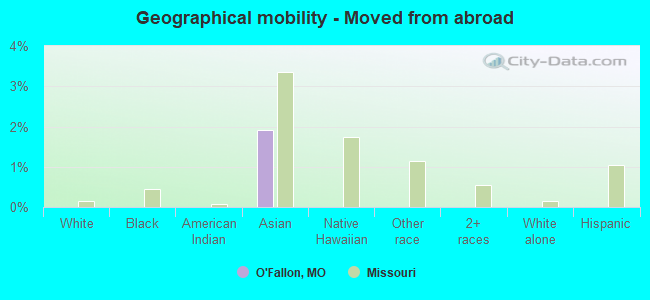
Geographical mobility - Moved from abroad (%)
Geographical mobility - Moved from abroad (%) - White
Geographical mobility - Moved from abroad (%) - Black or African American
Geographical mobility - Moved from abroad (%) - Asian
Geographical mobility - Moved from abroad (%) - Hispanic or Latino
Geographical mobility - Moved from abroad (%) - American Indian and Alaska Native
Geographical mobility - Moved from abroad (%) - Multirace
Geographical mobility - Moved from abroad (%) - Other Race
Place of birth for the foreign-born population - Ireland (%)
Place of birth for the foreign-born population - Denmark (%)
Place of birth for the foreign-born population - Norway (%)
Place of birth for the foreign-born population - Sweden (%)
Place of birth for the foreign-born population - United Kingdom (%)
Place of birth for the foreign-born population - England (%)
Place of birth for the foreign-born population - Scotland (%)
Place of birth for the foreign-born population - Other Northern Europe (%)
Place of birth for the foreign-born population - Austria (%)
Place of birth for the foreign-born population - Belgium (%)
Place of birth for the foreign-born population - France (%)
Place of birth for the foreign-born population - Germany (%)
Place of birth for the foreign-born population - Netherlands (%)
Place of birth for the foreign-born population - Switzerland (%)
Place of birth for the foreign-born population - Other Western Europe (%)
Place of birth for the foreign-born population - Greece (%)
Place of birth for the foreign-born population - Italy (%)
Place of birth for the foreign-born population - Portugal (%)
Place of birth for the foreign-born population - Spain (%)
Place of birth for the foreign-born population - Other Southern Europe (%)
Place of birth for the foreign-born population - Albania (%)
Place of birth for the foreign-born population - Belarus (%)
Place of birth for the foreign-born population - Bosnia and Herzegovina (%)
Place of birth for the foreign-born population - Bulgaria (%)
Place of birth for the foreign-born population - Croatia (%)
Place of birth for the foreign-born population - Czechoslovakia (%)
Place of birth for the foreign-born population - Hungary (%)
Place of birth for the foreign-born population - Latvia (%)
Place of birth for the foreign-born population - Lithuania (%)
Place of birth for the foreign-born population - North Macedonia (Macedonia) (%)
Place of birth for the foreign-born population - Moldova (%)
Place of birth for the foreign-born population - Poland (%)
Place of birth for the foreign-born population - Romania (%)
Place of birth for the foreign-born population - Russia (%)
Place of birth for the foreign-born population - Serbia (%)
Place of birth for the foreign-born population - Ukraine (%)
Place of birth for the foreign-born population - Other Eastern Europe (%)
Place of birth for the foreign-born population - China (%)
Place of birth for the foreign-born population - Hong Kong (%)
Place of birth for the foreign-born population - Taiwan (%)
Place of birth for the foreign-born population - Japan (%)
Place of birth for the foreign-born population - Korea (%)
Place of birth for the foreign-born population - Other Eastern Asia (%)
Place of birth for the foreign-born population - Afghanistan (%)
Place of birth for the foreign-born population - Bangladesh (%)
Place of birth for the foreign-born population - India (%)
Place of birth for the foreign-born population - Iran (%)
Place of birth for the foreign-born population - Kazakhstan (%)
Place of birth for the foreign-born population - Nepal (%)
Place of birth for the foreign-born population - Pakistan (%)
Place of birth for the foreign-born population - Sri Lanka (%)
Place of birth for the foreign-born population - Uzbekistan (%)
Place of birth for the foreign-born population - Other South Central Asia (%)
Place of birth for the foreign-born population - Burma (%)
Place of birth for the foreign-born population - Cambodia (%)
Place of birth for the foreign-born population - Indonesia (%)
Place of birth for the foreign-born population - Laos (%)
Place of birth for the foreign-born population - Malaysia (%)
Place of birth for the foreign-born population - Philippines (%)
Place of birth for the foreign-born population - Singapore (%)
Place of birth for the foreign-born population - Thailand (%)
Place of birth for the foreign-born population - Vietnam (%)
Place of birth for the foreign-born population - Other South Eastern Asia (%)
Place of birth for the foreign-born population - Armenia (%)
Place of birth for the foreign-born population - Iraq (%)
Place of birth for the foreign-born population - Israel (%)
Place of birth for the foreign-born population - Jordan (%)
Place of birth for the foreign-born population - Kuwait (%)
Place of birth for the foreign-born population - Lebanon (%)
Place of birth for the foreign-born population - Saudi Arabia (%)
Place of birth for the foreign-born population - Syria (%)
Place of birth for the foreign-born population - Turkey (%)
Place of birth for the foreign-born population - Yemen (%)
Place of birth for the foreign-born population - Other Western Asia (%)
Place of birth for the foreign-born population - Eritrea (%)
Place of birth for the foreign-born population - Ethiopia (%)
Place of birth for the foreign-born population - Kenya (%)
Place of birth for the foreign-born population - Somalia (%)
Place of birth for the foreign-born population - Uganda (%)
Place of birth for the foreign-born population - Zimbabwe (%)
Place of birth for the foreign-born population - Other Eastern Africa (%)
Place of birth for the foreign-born population - Cameroon (%)
Place of birth for the foreign-born population - Congo (%)
Place of birth for the foreign-born population - Democratic Republic of Congo (Zaire) (%)
Place of birth for the foreign-born population - Other Middle Africa (%)
Place of birth for the foreign-born population - Egypt (%)
Place of birth for the foreign-born population - Morocco (%)
Place of birth for the foreign-born population - Sudan (%)
Place of birth for the foreign-born population - Other Northern Africa (%)
Place of birth for the foreign-born population - South Africa (%)
Place of birth for the foreign-born population - Other Southern Africa (%)
Place of birth for the foreign-born population - Cabo Verde (%)
Place of birth for the foreign-born population - Ghana (%)
Place of birth for the foreign-born population - Liberia (%)
Place of birth for the foreign-born population - Nigeria (%)
Place of birth for the foreign-born population - Senegal (%)
Place of birth for the foreign-born population - Sierra Leone (%)
Place of birth for the foreign-born population - Other Western Africa (%)
Place of birth for the foreign-born population - Australia (%)
Place of birth for the foreign-born population - New Zealand (%)
Place of birth for the foreign-born population - Fiji (%)
Place of birth for the foreign-born population - Micronesia (%)
Place of birth for the foreign-born population - Bahamas (%)
Place of birth for the foreign-born population - Barbados (%)
Place of birth for the foreign-born population - Cuba (%)
Place of birth for the foreign-born population - Dominica (%)
Place of birth for the foreign-born population - Dominican Republic (%)
Place of birth for the foreign-born population - Grenada (%)
Place of birth for the foreign-born population - Haiti (%)
Place of birth for the foreign-born population - Jamaica (%)
Place of birth for the foreign-born population - St. Vincent and the Grenadines (%)
Place of birth for the foreign-born population - Trinidad and Tobago (%)
Place of birth for the foreign-born population - West Indies (%)
Place of birth for the foreign-born population - Other Caribbean (%)
Place of birth for the foreign-born population - Belize (%)
Place of birth for the foreign-born population - Costa Rica (%)
Place of birth for the foreign-born population - El Salvador (%)
Place of birth for the foreign-born population - Guatemala (%)
Place of birth for the foreign-born population - Honduras (%)
Place of birth for the foreign-born population - Mexico (%)
Place of birth for the foreign-born population - Nicaragua (%)
Place of birth for the foreign-born population - Panama (%)
Place of birth for the foreign-born population - Other Central America (%)
Place of birth for the foreign-born population - Argentina (%)
Place of birth for the foreign-born population - Bolivia (%)
Place of birth for the foreign-born population - Brazil (%)
Place of birth for the foreign-born population - Chile (%)
Place of birth for the foreign-born population - Colombia (%)
Place of birth for the foreign-born population - Ecuador (%)
Place of birth for the foreign-born population - Guyana (%)
Place of birth for the foreign-born population - Peru (%)
Place of birth for the foreign-born population - Uruguay (%)
Place of birth for the foreign-born population - Venezuela (%)
Place of birth for the foreign-born population - Other South America (%)
Place of birth for the foreign-born population - Canada (%)
Place of birth for the foreign-born population - Other Northern America (%)
Place of birth for the foreign-born population - Other (%)
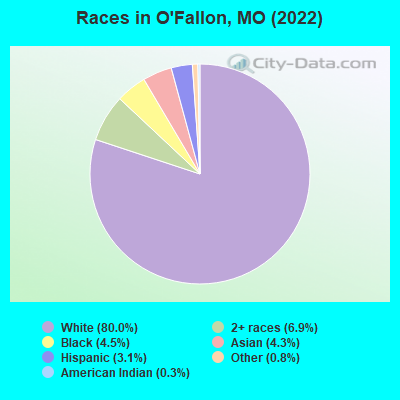
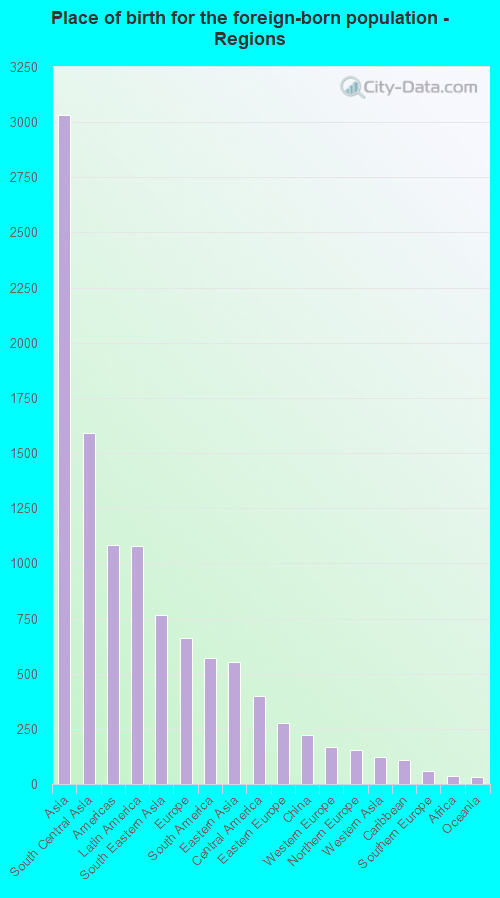
According to 2022 data, the most numerous races in O'Fallon, MO are White alone (74,960 residents), Black alone (4,234 residents), and Two or more races (6,496 residents). 93.9% of O'Fallon residents speak English at home. 5.2% of O'Fallon, MO residents are foreign-born (3.4% born in Asia, 1.2% born in Latin America, 0.7% born in Europe), which is 22.8% greater than the foreign-born rate of 4.0% across the entire state of Missouri.
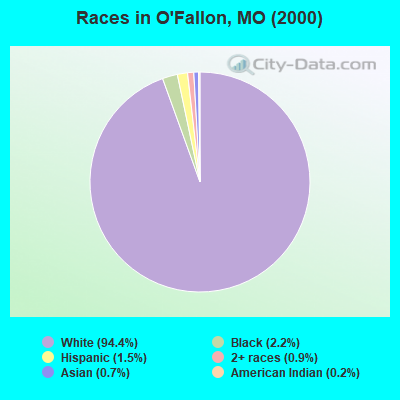
Race distribution in O'Fallon
2000 2022
4,686,474 83.8% White alone 625,667 11.2% Black alone 118,592 2.1% Hispanic 71,905 1.3% Two or more races 61,041 1.1% Asian alone 23,302 0.4% American Indian alone 5,291 0.09% Other race alone 2,939 0.05% Native Hawaiian and Other
4,733,411 76.6% White alone 656,739 10.6% Black alone 316,300 5.1% Two or more races 291,763 4.7% Hispanic 132,436 2.1% Asian alone 27,467 0.4% Other race alone 12,313 0.2% American Indian alone 7,528 0.1% Native Hawaiian and Other
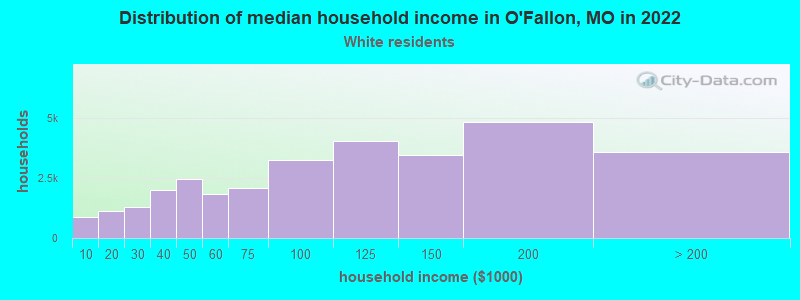
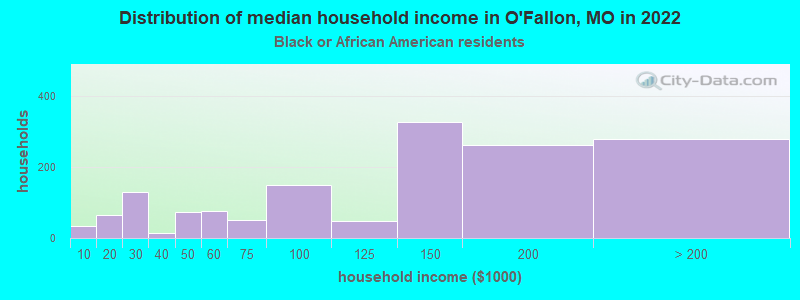
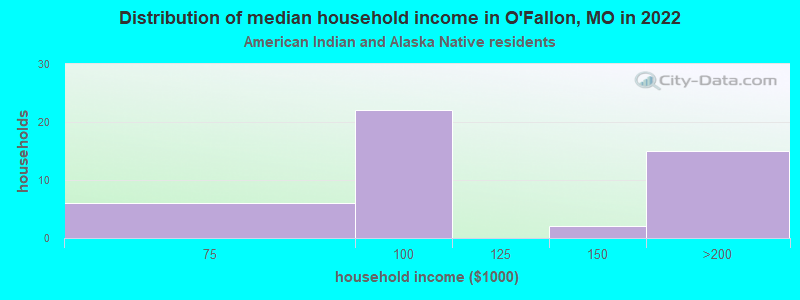
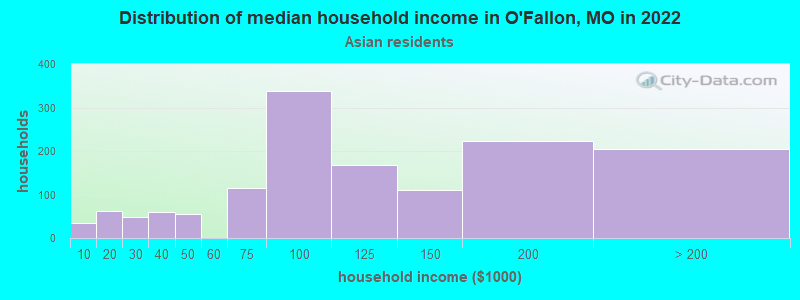
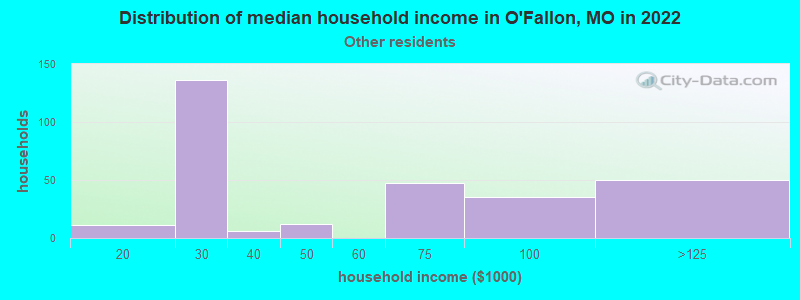
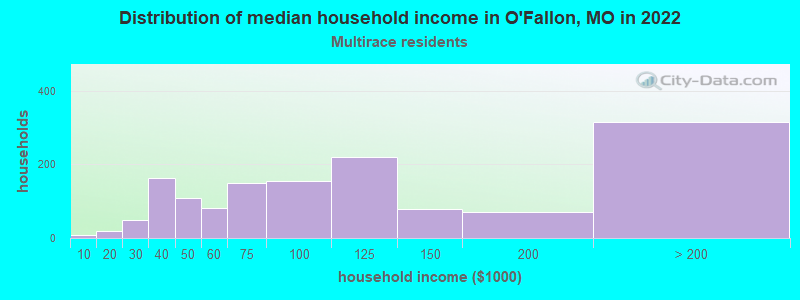
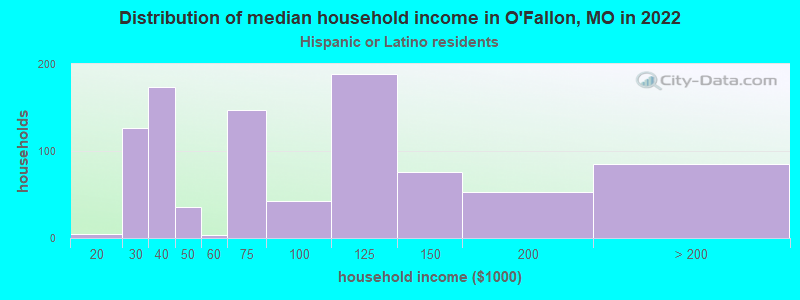
Income and house value in O'Fallon Median household income in 2022 $105,090 White non-Hispanic householders$133,083 Black householders$96,853 Asian householders$66,806 Some other race householders$101,631 Two or more races householders$67,485 Hispanic or Latino race householdersMedian 2022 house value $309,821 White Non-Hispanic householders$322,378 Black or African American householders $276,715 Asian householders$302,515 Some other race householders$430,598 Two or more races householders$354,798 Hispanic or Latino householders
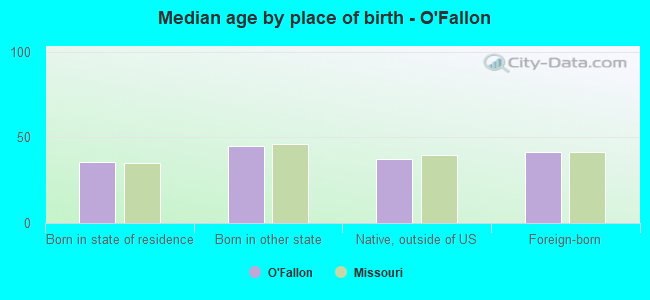
Median age by race in O'Fallon
39.7 Median age for White residents38.5 40.6 43.7 Median age for Black or African American residents43.2 44.1 33.2 Median age for American Indian / Alaska Native residents-666,666,666.0 33.2 37.3 Median age for Asian residents38.5 35.5 -666,666,666.0 Median age for Native Hawaiian / Pacific Islander residents-666,666,666.0 -666,666,666.0 27.7 Median age for Other race residents28.5 11.9 26.7 Median age for Two or more races residents26.4 29.6 40.0 Median age for White alone residents38.7 40.9 24.8 Median age for Hispanic or Latino residents28.0 24.3
Owner/renter occupied households by race in O'Fallon
House owners and renters - White residents 23,743 77.2% Owner occupied7,012 22.8% Renter occupiedHouse owners and renters - Black or African American residents 1,226 82.0% Owner occupied270 18.0% Renter occupiedHouse owners and renters - American Indian / Alaska Native residents 26 63.7% Owner occupied15 36.3% Renter occupiedHouse owners and renters - Asian residents 600 48.3% Owner occupied642 51.7% Renter occupiedHouse owners and renters - Other race residents 146 63.7% Owner occupied83 36.3% Renter occupiedHouse owners and renters - Two or more races residents 1,335 69.6% Owner occupied584 30.4% Renter occupiedHouse owners and renters - White alone residents 23,401 77.2% Owner occupied6,918 22.8% Renter occupiedHouse owners and renters - Hispanic or Latino residents 534 61.2% Owner occupied339 38.8% Renter occupied
Language usage in O'Fallon
English speakers - Total 93.9% of residents of O'Fallon speak English at home.
2.0% of residents speak Spanish at home 1,270 73.6% Speak English very well456 26.4% Speak English less than very well3.9% of residents speak other language at home 2,371 69.0% Speak English very well1,066 31.0% Speak English less than very well
English speakers - Born in the United States 96.5% of residents of O'Fallon speak English at home.
1.8% of residents speak Spanish at home 325 73.4% Speak English very well118 26.6% Speak English less than very well1.7% of residents speak other language at home 397 95.2% Speak English very well20 4.8% Speak English less than very well
English speakers - Native, born elsewhere 74.9% of residents of O'Fallon speak English at home.
13.9% of residents speak Spanish at home 70 58.3% Speak English very well50 41.7% Speak English less than very well3.2% of residents speak other language at home 28 100.0% Speak English very well
English speakers - Foreign-born 22.6% of residents of O'Fallon speak English at home.
12.4% of residents speak Spanish at home 328 60.9% Speak English very well211 39.1% Speak English less than very well65.7% of residents speak other language at home 1,811 63.3% Speak English very well1,050 36.7% Speak English less than very well
White (Caucasian) - Speak only English Native:
99.2% (70,741)Foreign-born:
40.9% (246)
White (Caucasian) - Speak another language Native:
0.8% (577)Foreign-born:
58.6% (353)
Black or African American - Speak another language Native:
4.5% (178)Foreign-born:
99.5% (113)
American Indian / Alaska Native - Speak only English Native:
91.2% (60)Foreign-born:
100.0% (1)
Asian - Speak only English Native:
54.8% (606)Foreign-born:
15.9% (453)
Asian - Speak another language Native:
45.2% (499)Foreign-born:
84.1% (2,389)
Native Hawaiian / Pacific Islander - Speak only English Native:
97.6% (13)Foreign-born:
100.0% (14)
Other race - Speak only English Native:
90.8% (798)Foreign-born:
60.8% (152)
Other race - Speak another language Native:
18.5% (162)Foreign-born:
48.5% (121)
Two or more races - Speak only English Native:
88.7% (5,270)Foreign-born:
2.9% (19)
Two or more races - Speak another language Native:
11.4% (676)Foreign-born:
96.7% (631)
White alone - Speak only English Native:
99.4% (69,853)Foreign-born:
33.0% (189)
White alone - Speak another language Native:
0.6% (453)Foreign-born:
69.3% (396)
Hispanic or Latino - Speak only English Native:
73.6% (2,325)Foreign-born:
23.9% (182)
Hispanic or Latino - Speak another language Native:
26.3% (831)Foreign-born:
72.7% (553)
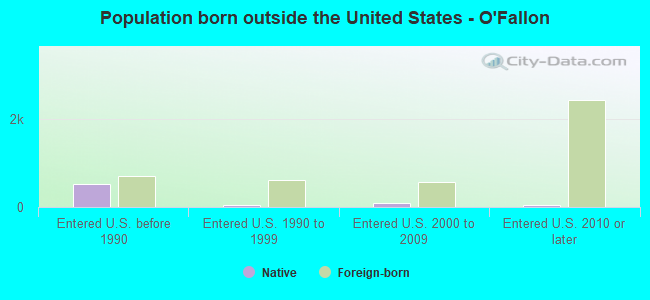
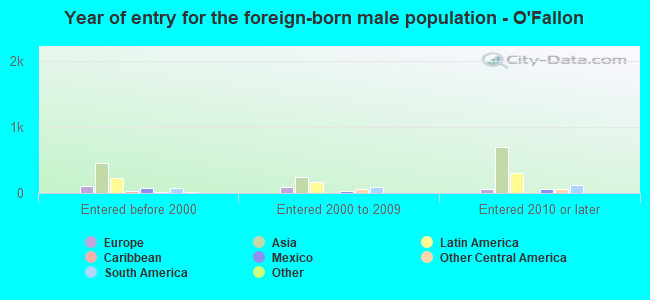
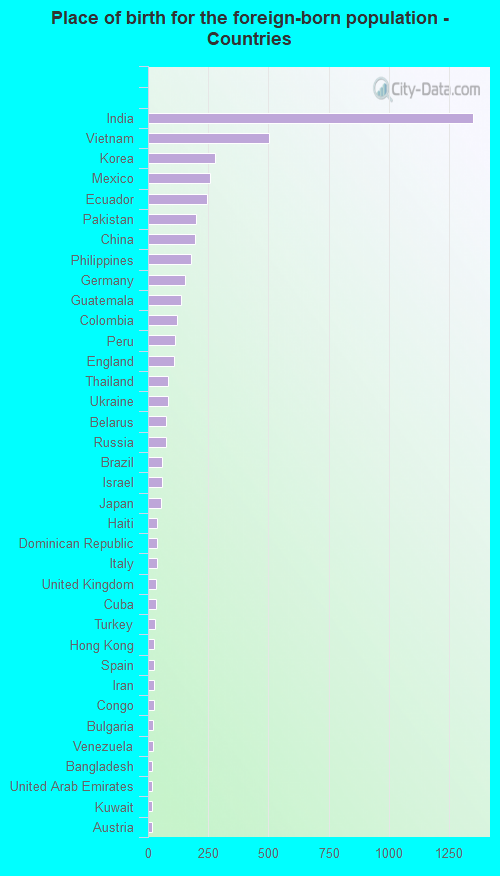
Foreign-born residents in O'Fallon 4,847 residents are foreign born (3.4% Asia , 1.2% Latin America , 0.7% Europe ).
This city:
5.2%Missouri:
4.2%
Marital status for residents in O'Fallon Marital status - White (Caucasian) population 15 years and over
Males 26.8% Never married62.4% Now married1.2% Separated1.5% Widowed8.2% DivorcedFemales 19.9% Never married58.7% Now married1.2% Separated7.4% Widowed12.7% DivorcedWomen who gave birth in the past 12 months Now married:
88.1% (1,242)Unmarried:
11.9% (167)
Women who did not give birth in the past 12 months Now married:
55.3% (9,200)Unmarried:
44.7% (7,443)
Marital status - Black or African American population 15 years and over
Males 25.3% Never married65.9% Now married1.6% Separated1.1% Widowed6.1% DivorcedFemales 42.0% Never married44.7% Now married0.0% Separated3.9% Widowed9.4% DivorcedWomen who gave birth in the past 12 months Now married:
38.0% (84)Unmarried:
62.0% (137)
Women who did not give birth in the past 12 months Now married:
58.6% (521)Unmarried:
41.4% (368)
Marital status - Asian population 15 years and over
Males 21.5% Never married66.3% Now married2.5% Separated0.8% Widowed8.8% DivorcedFemales 23.3% Never married64.3% Now married2.0% Separated2.8% Widowed7.6% DivorcedWomen who gave birth in the past 12 months Now married:
30.9% (49)Unmarried:
69.1% (110)
Women who did not give birth in the past 12 months Now married:
71.0% (722)Unmarried:
29.0% (296)
Marital status - Other race population 15 years and over
Males 28.7% Never married60.8% Now married0.0% Separated0.0% Widowed10.5% DivorcedFemales 38.1% Never married54.3% Now married0.0% Separated0.0% Widowed7.6% DivorcedWomen who gave birth in the past 12 months Now married:
100.0% (11)Unmarried:
0.0% (0)
Women who did not give birth in the past 12 months Now married:
48.1% (136)Unmarried:
51.9% (147)
Marital status - Two or more races population 15 years and over
Males 42.8% Never married40.9% Now married2.5% Separated0.6% Widowed13.3% DivorcedFemales 35.6% Never married54.3% Now married0.0% Separated4.7% Widowed5.4% DivorcedWomen who gave birth in the past 12 months Now married:
100.0% (71)Unmarried:
0.0% (0)
Women who did not give birth in the past 12 months Now married:
45.7% (623)Unmarried:
54.3% (739)
Marital status - White alone, not Hispanic / Latino population 15 years and over
Males 26.3% Never married62.8% Now married1.2% Separated1.5% Widowed8.2% DivorcedFemales 19.3% Never married59.5% Now married1.3% Separated7.3% Widowed12.6% DivorcedWomen who gave birth in the past 12 months Now married:
88.1% (1,242)Unmarried:
11.9% (167)
Women who did not give birth in the past 12 months Now married:
56.4% (9,042)Unmarried:
43.6% (6,991)
Marital status - Hispanic or Latino population 15 years and over
Males 34.0% Never married54.6% Now married3.2% Separated0.0% Widowed8.2% DivorcedFemales 28.7% Never married57.8% Now married0.0% Separated6.1% Widowed7.5% DivorcedWomen who gave birth in the past 12 months Now married:
100.0% (11)Unmarried:
0.0% (0)
Women who did not give birth in the past 12 months Now married:
53.9% (507)Unmarried:
46.1% (435)
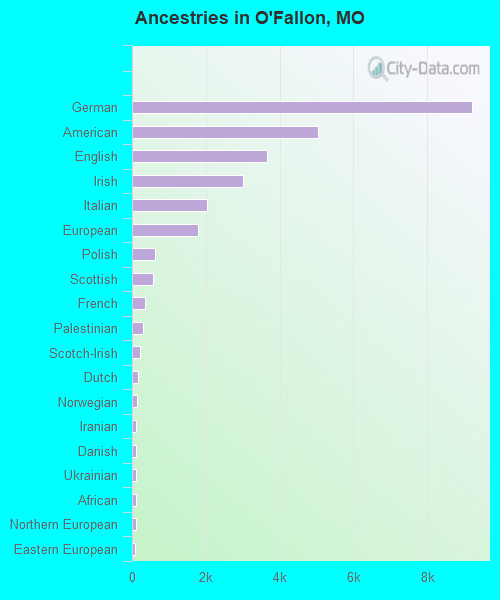
Ancestries in O'Fallon
9,216 24.3% German5,031 13.3% American3,652 9.6% English3,021 8.0% Irish2,022 5.3% Italian1,780 4.7% European627 1.7% Polish570 1.5% Scottish343 0.9% French308 0.8% Palestinian224 0.6% Scotch-Irish172 0.5% Dutch144 0.4% Norwegian113 0.3% Iranian107 0.3% Danish102 0.3% Ukrainian98 0.3% African97 0.3% Northern European87 0.2% Eastern European77 0.2% Haitian77 0.2% Greek77 0.2% Russian71 0.2% Swedish68 0.2% Croatian55 0.1% Hungarian46 0.1% Czech45 0.1% Turkish41 0.1% Belgian38 0.1% Finnish37 0.10% French Canadian32 0.08% Scandinavian31 0.08% Swiss27 0.07% Welsh26 0.07% British25 0.07% Brazilian25 0.07% Bulgarian24 0.06% Czechoslovakian19 0.05% Pennsylvania German18 0.05% Ugandan17 0.04% Canadian15 0.04% Jamaican11 0.03% Austrian10 0.03% Lithuanian7 0.02% Somali6 0.02% Yugoslavian
Geographical mobility in O'Fallon Same house 1 year ago 67,141 89.6% White (Caucasian)3,759 88.4% Black or African American67 100.0% American Indian / Alaska Native3,823 90.6% Asian37 100.0% Native Hawaiian / Pacific Islander1,415 98.6% Other race6,489 87.0% Two or more races66,026 89.5% White alone, not Hispanic / Latino3,790 90.1% Hispanic or LatinoMoved within same county 2,118 2.8% White / Caucasian276 6.5% Black or African American289 6.8% Asian13 0.9% Other race548 7.3% Two or more races2,067 2.8% White alone, not Hispanic / Latino134 3.2% Hispanic or LatinoMoved within same state 3,856 5.1% White / Caucasian90 2.1% Black or African American60 1.4% Asian287 3.9% Two or more races3,856 5.2% White alone, not Hispanic / Latino98 2.3% Hispanic or LatinoMoved from different state 1,852 2.5% White / Caucasian118 2.8% Black or African American19 1.3% Other race205 2.7% Two or more races1,852 2.5% White alone, not Hispanic / Latino99 2.4% Hispanic or LatinoMoved from abroad 81 1.9% Asian
Children Nativity (place of birth) in O'Fallon
Children under 6 years - Living with two parents Both parents native 5,261 99.6% Native20 0.4% Foreign-bornBoth parents foreign-born 143 63.7% Native81 36.3% Foreign-bornOne native, one foreign-born parent 633 100.0% NativeChildren under 6 years - Living with one parent Native parent 977 100.0% NativeForeign-born parent 83 91.2% Native8 8.8% Foreign-bornChildren 6 to 17 years - Living with two parents Both parents native 10,677 99.6% Native38 0.4% Foreign-bornBoth parents foreign-born 303 51.9% Native281 48.1% Foreign-bornOne native, one foreign-born parent 332 97.1% Native10 2.9% Foreign-bornChildren 6 to 17 years - Living with one parent Native parent 3,079 100.0% NativeForeign-born parent 151 59.5% Native103 40.5% Foreign-born
Grandparents responsible for own grandchildren in O'Fallon
Grandparents (30 to 59 years) White / Caucasian 188 39.6% Responsible for grandchildren287 60.4% Not responsible for grandchildrenBlack or African American 13 40.5% Responsible for grandchildren20 59.5% Not responsible for grandchildrenAsian 16 76.3% Responsible for grandchildren5 23.7% Not responsible for grandchildrenWhite alone, not Hispanic / Latino 188 37.8% Responsible for grandchildren310 62.2% Not responsible for grandchildrenHispanic or Latino 6 100.0% Not responsible for grandchildrenGrandparents (60 years and over) White / Caucasian 209 24.2% Responsible for grandchildren655 75.8% Not responsible for grandchildrenBlack or African American 12 10.2% Responsible for grandchildren102 89.8% Not responsible for grandchildrenAsian 9 6.1% Responsible for grandchildren138 93.9% Not responsible for grandchildrenWhite alone, not Hispanic / Latino 190 22.9% Responsible for grandchildren641 77.1% Not responsible for grandchildrenHispanic or Latino 16 37.7% Responsible for grandchildren27 62.3% Not responsible for grandchildren