Races in Oak Harbor, Washington (WA) Detailed Stats
Data:
Races - White alone (%)
Races - White alone (% change since 2000)
Races - Black alone (%)
Races - Black alone (% change since 2000)
Races - American Indian alone (%)
Races - American Indian alone (% change since 2000)
Races - Asian alone (%)
Races - Asian alone (% change since 2000)
Races - Hispanic (%)
Races - Hispanic (% change since 2000)
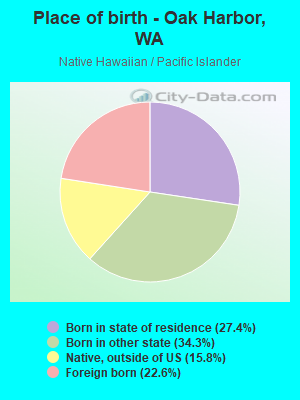
Races - Native Hawaiian and Other Pacific Islander alone (%)
Races - Native Hawaiian and Other Pacific Islander alone (% change since 2000)
Races - Two or more races(%)
Races - Two or more races(% change since 2000)
Races - Other race alone (%)
Races - Other race alone (% change since 2000)
Racial diversity
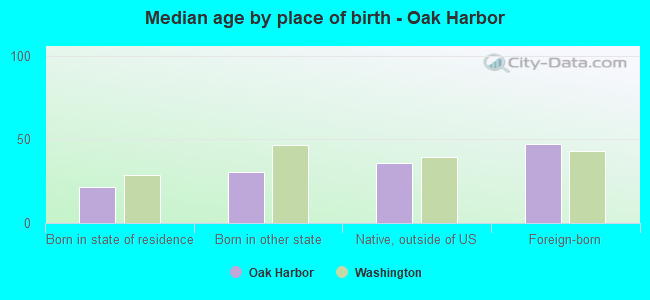
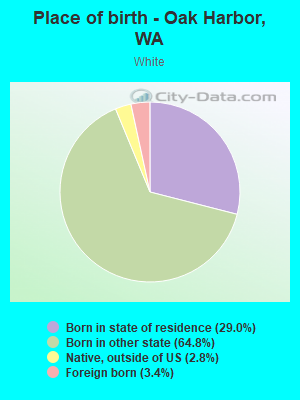
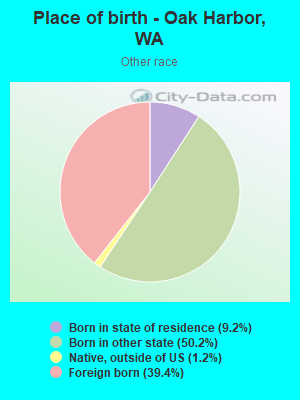
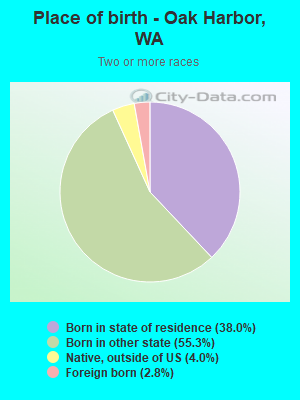
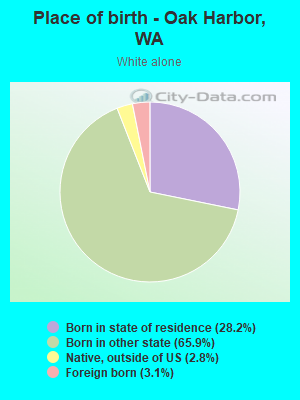
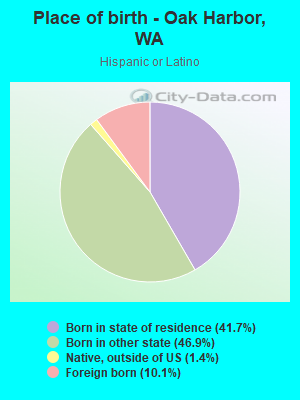
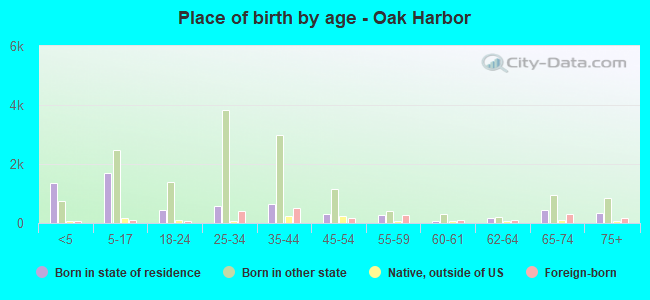
Place of birth - Born in state of residence (%)
Place of birth - Born in state of residence (%) - White
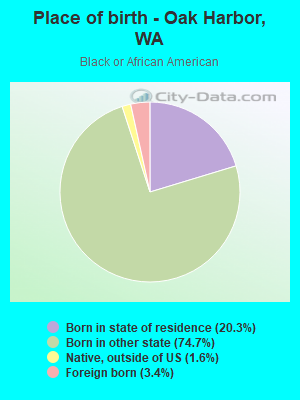
Place of birth - Born in state of residence (%) - Black or African American
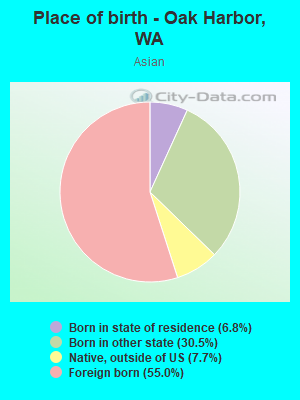
Place of birth - Born in state of residence (%) - Asian
Place of birth - Born in state of residence (%) - Hispanic or Latino
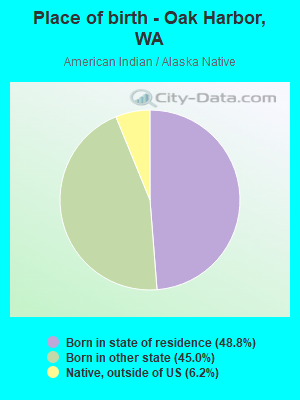
Place of birth - Born in state of residence (%) - American Indian and Alaska Native
Place of birth - Born in state of residence (%) - Multirace
Place of birth - Born in state of residence (%) - Other Race
Place of birth - Born in other state (%)
Place of birth - Born in other state (%) - White
Place of birth - Born in other state (%) - Black or African American
Place of birth - Born in other state (%) - Asian
Place of birth - Born in other state (%) - Hispanic or Latino
Place of birth - Born in other state (%) - American Indian and Alaska Native
Place of birth - Born in other state (%) - Multirace
Place of birth - Born in other state (%) - Other Race
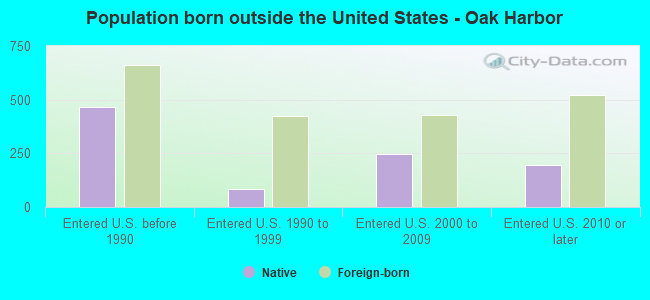
Place of birth - Native, outside of US (%)
Place of birth - Native, outside of US (%) - White
Place of birth - Native, outside of US (%) - Black or African American
Place of birth - Native, outside of US (%) - Asian
Place of birth - Native, outside of US (%) - Hispanic or Latino
Place of birth - Native, outside of US (%) - American Indian and Alaska Native
Place of birth - Native, outside of US (%) - Multirace
Place of birth - Native, outside of US (%) - Other Race
Place of birth - Foreign born (%)
Place of birth - Foreign born (%) - White
Place of birth - Foreign born (%) - Black or African American
Place of birth - Foreign born (%) - Asian
Place of birth - Foreign born (%) - Hispanic or Latino
Place of birth - Foreign born (%) - American Indian and Alaska Native
Place of birth - Foreign born (%) - Multirace
Place of birth - Foreign born (%) - Other Race
Residents speaking English at home (%)
Residents speaking English at home - Born in the United States (%)
Residents speaking English at home - Native, born elsewhere (%)
Residents speaking English at home - Foreign born (%)
Residents speaking Spanish at home (%)
Residents speaking Spanish at home - Born in the United States (%)
Residents speaking Spanish at home - Native, born elsewhere (%)
Residents speaking Spanish at home - Foreign born (%)
Residents speaking other language at home (%)
Residents speaking other language at home - Born in the United States (%)
Residents speaking other language at home - Native, born elsewhere (%)
Residents speaking other language at home - Foreign born (%)
Marital status - Never married (%)
Marital status - Now married (%)
Marital status - Separated (%)
Marital status - Widowed (%)
Marital status - Divorced (%)
Ancestries Reported - Arab (%)
Ancestries Reported - Czech (%)
Ancestries Reported - Danish (%)
Ancestries Reported - Dutch (%)
Ancestries Reported - English (%)
Ancestries Reported - French (%)
Ancestries Reported - French Canadian (%)
Ancestries Reported - German (%)
Ancestries Reported - Greek (%)
Ancestries Reported - Hungarian (%)
Ancestries Reported - Irish (%)
Ancestries Reported - Italian (%)
Ancestries Reported - Lithuanian (%)
Ancestries Reported - Norwegian (%)
Ancestries Reported - Polish (%)
Ancestries Reported - Portuguese (%)
Ancestries Reported - Russian (%)
Ancestries Reported - Scotch-Irish (%)
Ancestries Reported - Scottish (%)
Ancestries Reported - Slovak (%)
Ancestries Reported - Subsaharan African (%)
Ancestries Reported - Swedish (%)
Ancestries Reported - Swiss (%)
Ancestries Reported - Ukrainian (%)
Ancestries Reported - United States (%)
Ancestries Reported - Welsh (%)
Ancestries Reported - West Indian (%)
Ancestries Reported - Other (%)
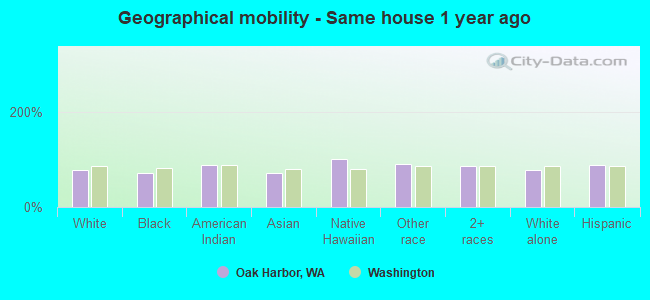
Geographical mobility - Same house 1 year ago (%)
Geographical mobility - Same house 1 year ago (%) - White
Geographical mobility - Same house 1 year ago (%) - Black or African American
Geographical mobility - Same house 1 year ago (%) - Asian
Geographical mobility - Same house 1 year ago (%) - Hispanic or Latino
Geographical mobility - Same house 1 year ago (%) - American Indian and Alaska Native
Geographical mobility - Same house 1 year ago (%) - Multirace
Geographical mobility - Same house 1 year ago (%) - Other Race
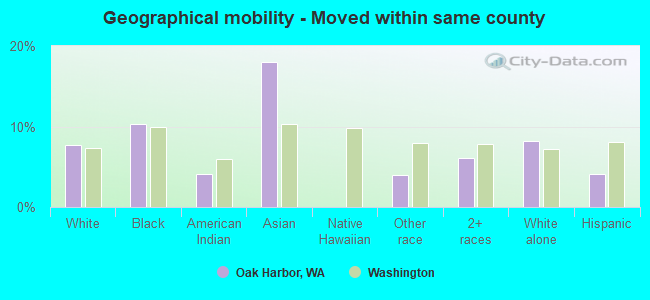
Geographical mobility - Moved within same county (%)
Geographical mobility - Moved within same county (%) - White
Geographical mobility - Moved within same county (%) - Black or African American
Geographical mobility - Moved within same county (%) - Asian
Geographical mobility - Moved within same county (%) - Hispanic or Latino
Geographical mobility - Moved within same county (%) - American Indian and Alaska Native
Geographical mobility - Moved within same county (%) - Multirace
Geographical mobility - Moved within same county (%) - Other Race
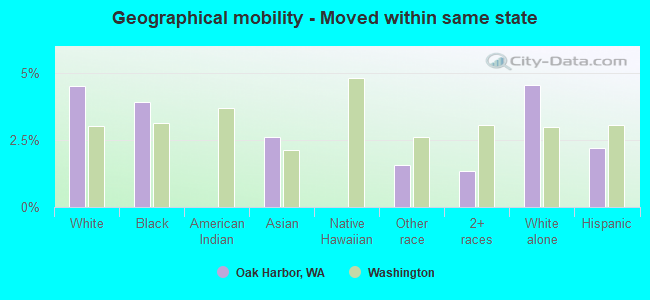
Geographical mobility - Moved from different county within same state (%)
Geographical mobility - Moved from different county within same state (%) - White
Geographical mobility - Moved from different county within same state (%) - Black or African American
Geographical mobility - Moved from different county within same state (%) - Asian
Geographical mobility - Moved from different county within same state (%) - Hispanic or Latino
Geographical mobility - Moved from different county within same state (%) - American Indian and Alaska Native
Geographical mobility - Moved from different county within same state (%) - Multirace
Geographical mobility - Moved from different county within same state (%) - Other Race
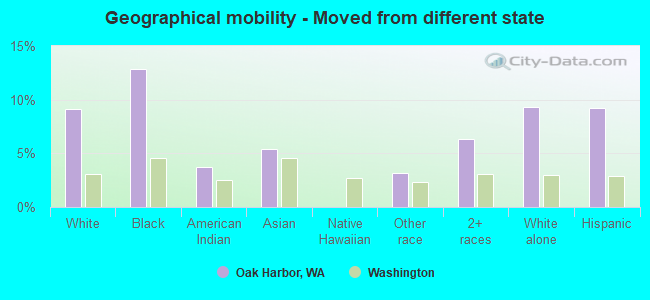
Geographical mobility - Moved from different state (%)
Geographical mobility - Moved from different state (%) - White
Geographical mobility - Moved from different state (%) - Black or African American
Geographical mobility - Moved from different state (%) - Asian
Geographical mobility - Moved from different state (%) - Hispanic or Latino
Geographical mobility - Moved from different state (%) - American Indian and Alaska Native
Geographical mobility - Moved from different state (%) - Multirace
Geographical mobility - Moved from different state (%) - Other Race
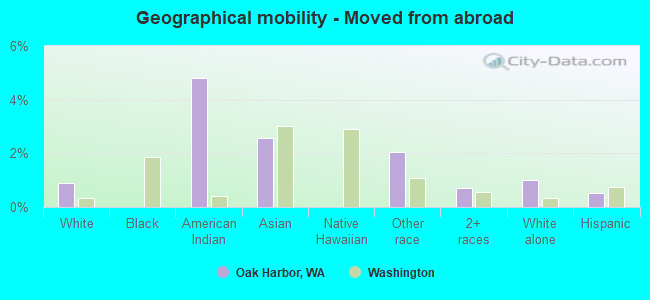
Geographical mobility - Moved from abroad (%)
Geographical mobility - Moved from abroad (%) - White
Geographical mobility - Moved from abroad (%) - Black or African American
Geographical mobility - Moved from abroad (%) - Asian
Geographical mobility - Moved from abroad (%) - Hispanic or Latino
Geographical mobility - Moved from abroad (%) - American Indian and Alaska Native
Geographical mobility - Moved from abroad (%) - Multirace
Geographical mobility - Moved from abroad (%) - Other Race
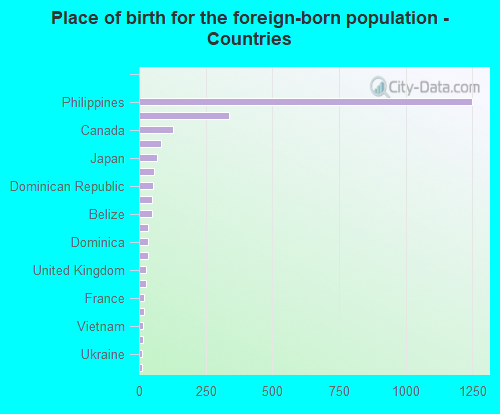
Place of birth for the foreign-born population - Ireland (%)
Place of birth for the foreign-born population - Denmark (%)
Place of birth for the foreign-born population - Norway (%)
Place of birth for the foreign-born population - Sweden (%)
Place of birth for the foreign-born population - United Kingdom (%)
Place of birth for the foreign-born population - England (%)
Place of birth for the foreign-born population - Scotland (%)
Place of birth for the foreign-born population - Other Northern Europe (%)
Place of birth for the foreign-born population - Austria (%)
Place of birth for the foreign-born population - Belgium (%)
Place of birth for the foreign-born population - France (%)
Place of birth for the foreign-born population - Germany (%)
Place of birth for the foreign-born population - Netherlands (%)
Place of birth for the foreign-born population - Switzerland (%)
Place of birth for the foreign-born population - Other Western Europe (%)
Place of birth for the foreign-born population - Greece (%)
Place of birth for the foreign-born population - Italy (%)
Place of birth for the foreign-born population - Portugal (%)
Place of birth for the foreign-born population - Spain (%)
Place of birth for the foreign-born population - Other Southern Europe (%)
Place of birth for the foreign-born population - Albania (%)
Place of birth for the foreign-born population - Belarus (%)
Place of birth for the foreign-born population - Bosnia and Herzegovina (%)
Place of birth for the foreign-born population - Bulgaria (%)
Place of birth for the foreign-born population - Croatia (%)
Place of birth for the foreign-born population - Czechoslovakia (%)
Place of birth for the foreign-born population - Hungary (%)
Place of birth for the foreign-born population - Latvia (%)
Place of birth for the foreign-born population - Lithuania (%)
Place of birth for the foreign-born population - North Macedonia (Macedonia) (%)
Place of birth for the foreign-born population - Moldova (%)
Place of birth for the foreign-born population - Poland (%)
Place of birth for the foreign-born population - Romania (%)
Place of birth for the foreign-born population - Russia (%)
Place of birth for the foreign-born population - Serbia (%)
Place of birth for the foreign-born population - Ukraine (%)
Place of birth for the foreign-born population - Other Eastern Europe (%)
Place of birth for the foreign-born population - China (%)
Place of birth for the foreign-born population - Hong Kong (%)
Place of birth for the foreign-born population - Taiwan (%)
Place of birth for the foreign-born population - Japan (%)
Place of birth for the foreign-born population - Korea (%)
Place of birth for the foreign-born population - Other Eastern Asia (%)
Place of birth for the foreign-born population - Afghanistan (%)
Place of birth for the foreign-born population - Bangladesh (%)
Place of birth for the foreign-born population - India (%)
Place of birth for the foreign-born population - Iran (%)
Place of birth for the foreign-born population - Kazakhstan (%)
Place of birth for the foreign-born population - Nepal (%)
Place of birth for the foreign-born population - Pakistan (%)
Place of birth for the foreign-born population - Sri Lanka (%)
Place of birth for the foreign-born population - Uzbekistan (%)
Place of birth for the foreign-born population - Other South Central Asia (%)
Place of birth for the foreign-born population - Burma (%)
Place of birth for the foreign-born population - Cambodia (%)
Place of birth for the foreign-born population - Indonesia (%)
Place of birth for the foreign-born population - Laos (%)
Place of birth for the foreign-born population - Malaysia (%)
Place of birth for the foreign-born population - Philippines (%)
Place of birth for the foreign-born population - Singapore (%)
Place of birth for the foreign-born population - Thailand (%)
Place of birth for the foreign-born population - Vietnam (%)
Place of birth for the foreign-born population - Other South Eastern Asia (%)
Place of birth for the foreign-born population - Armenia (%)
Place of birth for the foreign-born population - Iraq (%)
Place of birth for the foreign-born population - Israel (%)
Place of birth for the foreign-born population - Jordan (%)
Place of birth for the foreign-born population - Kuwait (%)
Place of birth for the foreign-born population - Lebanon (%)
Place of birth for the foreign-born population - Saudi Arabia (%)
Place of birth for the foreign-born population - Syria (%)
Place of birth for the foreign-born population - Turkey (%)
Place of birth for the foreign-born population - Yemen (%)
Place of birth for the foreign-born population - Other Western Asia (%)
Place of birth for the foreign-born population - Eritrea (%)
Place of birth for the foreign-born population - Ethiopia (%)
Place of birth for the foreign-born population - Kenya (%)
Place of birth for the foreign-born population - Somalia (%)
Place of birth for the foreign-born population - Uganda (%)
Place of birth for the foreign-born population - Zimbabwe (%)
Place of birth for the foreign-born population - Other Eastern Africa (%)
Place of birth for the foreign-born population - Cameroon (%)
Place of birth for the foreign-born population - Congo (%)
Place of birth for the foreign-born population - Democratic Republic of Congo (Zaire) (%)
Place of birth for the foreign-born population - Other Middle Africa (%)
Place of birth for the foreign-born population - Egypt (%)
Place of birth for the foreign-born population - Morocco (%)
Place of birth for the foreign-born population - Sudan (%)
Place of birth for the foreign-born population - Other Northern Africa (%)
Place of birth for the foreign-born population - South Africa (%)
Place of birth for the foreign-born population - Other Southern Africa (%)
Place of birth for the foreign-born population - Cabo Verde (%)
Place of birth for the foreign-born population - Ghana (%)
Place of birth for the foreign-born population - Liberia (%)
Place of birth for the foreign-born population - Nigeria (%)
Place of birth for the foreign-born population - Senegal (%)
Place of birth for the foreign-born population - Sierra Leone (%)
Place of birth for the foreign-born population - Other Western Africa (%)
Place of birth for the foreign-born population - Australia (%)
Place of birth for the foreign-born population - New Zealand (%)
Place of birth for the foreign-born population - Fiji (%)
Place of birth for the foreign-born population - Micronesia (%)
Place of birth for the foreign-born population - Bahamas (%)
Place of birth for the foreign-born population - Barbados (%)
Place of birth for the foreign-born population - Cuba (%)
Place of birth for the foreign-born population - Dominica (%)
Place of birth for the foreign-born population - Dominican Republic (%)
Place of birth for the foreign-born population - Grenada (%)
Place of birth for the foreign-born population - Haiti (%)
Place of birth for the foreign-born population - Jamaica (%)
Place of birth for the foreign-born population - St. Vincent and the Grenadines (%)
Place of birth for the foreign-born population - Trinidad and Tobago (%)
Place of birth for the foreign-born population - West Indies (%)
Place of birth for the foreign-born population - Other Caribbean (%)
Place of birth for the foreign-born population - Belize (%)
Place of birth for the foreign-born population - Costa Rica (%)
Place of birth for the foreign-born population - El Salvador (%)
Place of birth for the foreign-born population - Guatemala (%)
Place of birth for the foreign-born population - Honduras (%)
Place of birth for the foreign-born population - Mexico (%)
Place of birth for the foreign-born population - Nicaragua (%)
Place of birth for the foreign-born population - Panama (%)
Place of birth for the foreign-born population - Other Central America (%)
Place of birth for the foreign-born population - Argentina (%)
Place of birth for the foreign-born population - Bolivia (%)
Place of birth for the foreign-born population - Brazil (%)
Place of birth for the foreign-born population - Chile (%)
Place of birth for the foreign-born population - Colombia (%)
Place of birth for the foreign-born population - Ecuador (%)
Place of birth for the foreign-born population - Guyana (%)
Place of birth for the foreign-born population - Peru (%)
Place of birth for the foreign-born population - Uruguay (%)
Place of birth for the foreign-born population - Venezuela (%)
Place of birth for the foreign-born population - Other South America (%)
Place of birth for the foreign-born population - Canada (%)
Place of birth for the foreign-born population - Other Northern America (%)
Place of birth for the foreign-born population - Other (%)
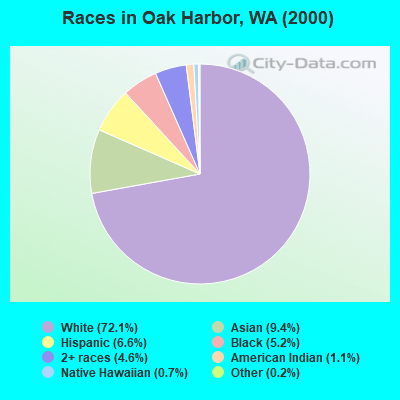
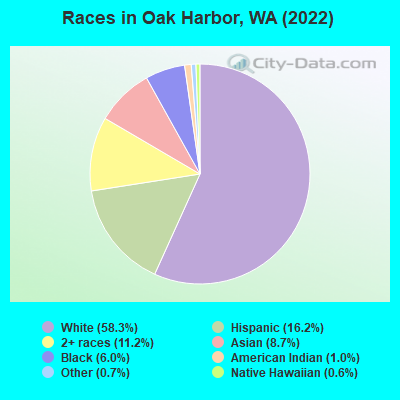
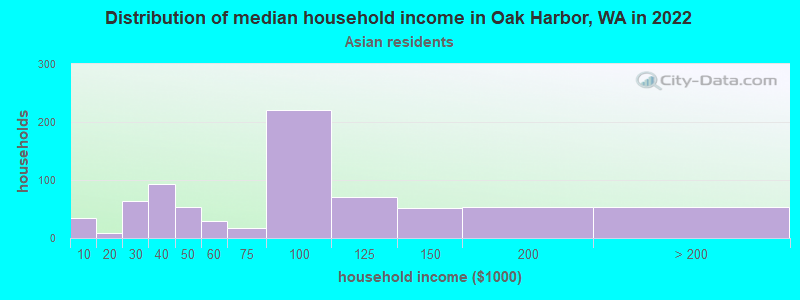
According to 2022 data, the most numerous races in Oak Harbor, WA are White alone (14,272 residents), Hispanic (3,965 residents), and Asian alone (2,125 residents). 85.5% of Oak Harbor residents speak English at home. 9.6% of Oak Harbor, WA residents are foreign-born (5.9% born in Asia, 1.9% born in Latin America), which is 56.0% less than the foreign-born rate of 15.0% across the entire state of Washington.
Race distribution in Oak Harbor
2000 2022
4,652,490 78.9% White alone 441,509 7.5% Hispanic 319,401 5.4% Asian alone 184,631 3.1% Black alone 175,926 3.0% Two or more races 85,396 1.4% American Indian alone 22,779 0.4% Native Hawaiian and Other 11,989 0.2% Other race alone
4,941,456 63.5% White alone 1,093,313 14.0% Hispanic 755,832 9.7% Asian alone 523,448 6.7% Two or more races 299,537 3.8% Black alone 69,024 0.9% American Indian alone 52,231 0.7% Native Hawaiian and Other 50,945 0.7% Other race alone
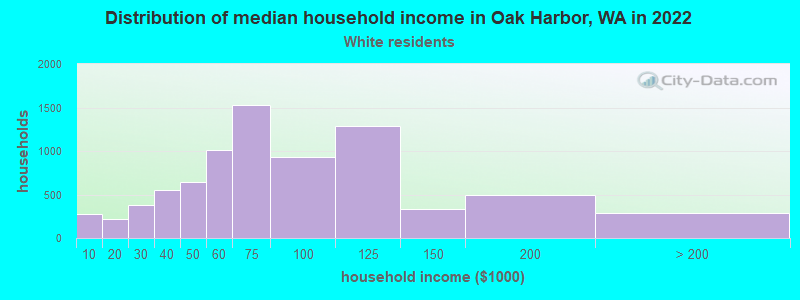
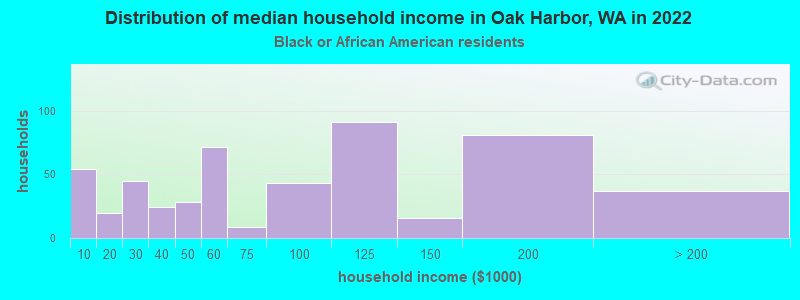
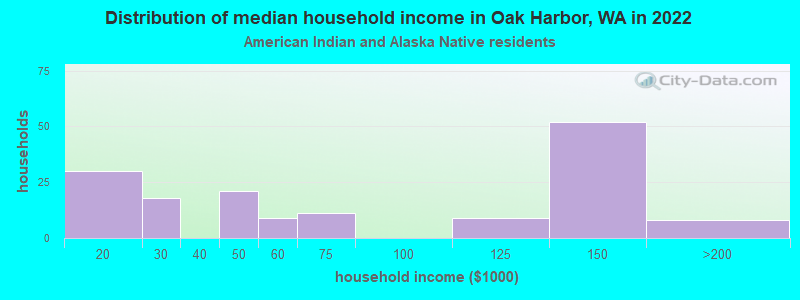
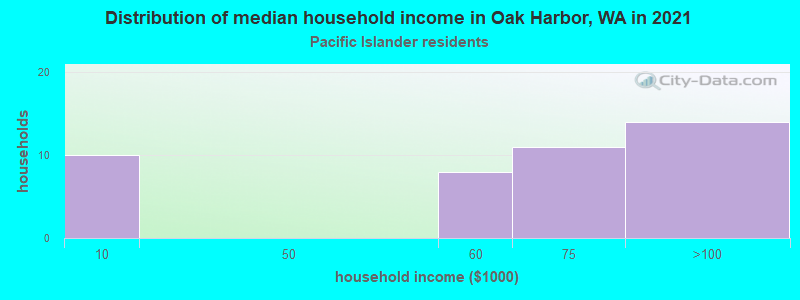
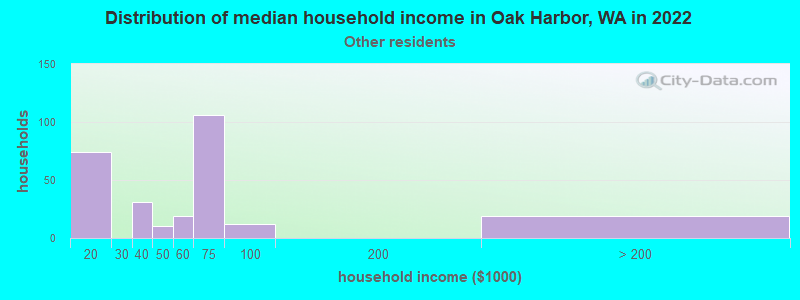
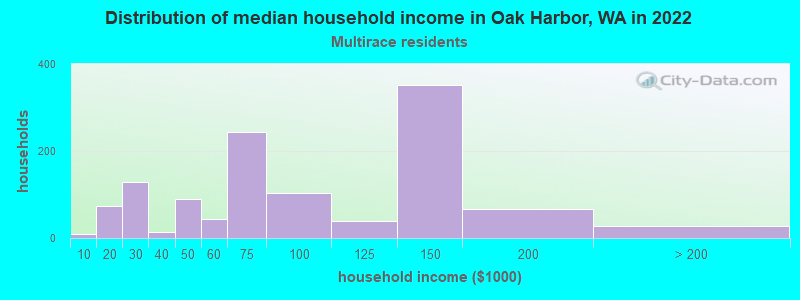
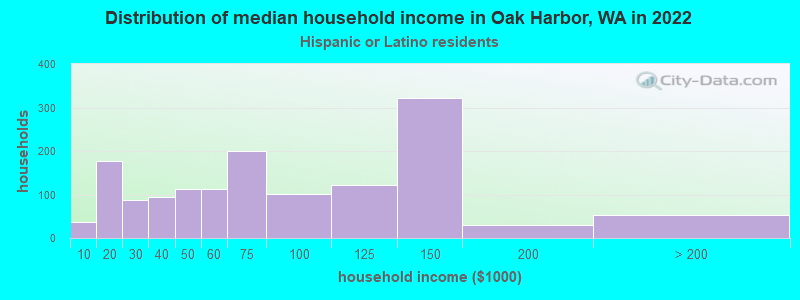
Income and house value in Oak Harbor Median household income in 2022 $66,840 White non-Hispanic householders$56,937 Black householders$63,366 Asian householders$61,421 Native Hawaiian and other Pacific Islander householders$65,731 Some other race householders$68,120 Two or more races householders$83,612 Hispanic or Latino race householdersMedian 2022 house value $520,754 White Non-Hispanic householders$518,725 Black or African American householders$410,516 American Indian or Alaska Native householders $491,673 Asian householders$486,262 Native Hawaiian and other Pacific Islander householders$490,996 Some other race householders$363,175 Two or more races householders$477,132 Hispanic or Latino householders
Median age by race in Oak Harbor
34.6 Median age for White residents32.7 36.0 49.2 Median age for Black or African American residents50.2 35.2 39.2 Median age for American Indian / Alaska Native residents35.2 18.5 40.8 Median age for Asian residents23.8 46.9 29.3 Median age for Native Hawaiian / Pacific Islander residents6.2 28.8 41.6 Median age for Other race residents23.1 32.2 20.3 Median age for Two or more races residents18.7 26.3 35.1 Median age for White alone residents33.4 37.3 26.8 Median age for Hispanic or Latino residents26.9 27.0
Owner/renter occupied households by race in Oak Harbor
House owners and renters - White residents 3,669 47.7% Owner occupied4,029 52.3% Renter occupiedHouse owners and renters - Black or African American residents 122 16.0% Owner occupied638 84.0% Renter occupiedHouse owners and renters - American Indian / Alaska Native residents 152 52.7% Owner occupied136 47.3% Renter occupiedHouse owners and renters - Asian residents 254 47.1% Owner occupied286 52.9% Renter occupiedHouse owners and renters - Native Hawaiian / Pacific Islander residents 56 100.0% Renter occupiedHouse owners and renters - Other race residents 111 39.0% Owner occupied173 61.0% Renter occupiedHouse owners and renters - Two or more races residents 640 73.3% Owner occupied233 26.7% Renter occupiedHouse owners and renters - White alone residents 3,367 46.8% Owner occupied3,833 53.2% Renter occupiedHouse owners and renters - Hispanic or Latino residents 879 59.9% Owner occupied588 40.1% Renter occupied
Language usage in Oak Harbor
English speakers - Total 85.5% of residents of Oak Harbor speak English at home.
8.3% of residents speak Spanish at home 1,175 64.0% Speak English very well660 36.0% Speak English less than very well5.8% of residents speak other language at home 822 64.5% Speak English very well452 35.5% Speak English less than very well
English speakers - Born in the United States 93.2% of residents of Oak Harbor speak English at home.
5.8% of residents speak Spanish at home 718 90.0% Speak English very well80 10.0% Speak English less than very well0.9% of residents speak other language at home 111 87.4% Speak English very well16 12.6% Speak English less than very well
English speakers - Native, born elsewhere 76.4% of residents of Oak Harbor speak English at home.
5.7% of residents speak Spanish at home 54 100.0% Speak English very well14.1% of residents speak other language at home 99 73.9% Speak English very well35 26.1% Speak English less than very well
English speakers - Foreign-born 23.1% of residents of Oak Harbor speak English at home.
25.1% of residents speak Spanish at home 132 25.2% Speak English very well392 74.8% Speak English less than very well46.5% of residents speak other language at home 651 67.0% Speak English very well320 33.0% Speak English less than very well
White (Caucasian) - Speak only English Native:
95.2% (13,244)Foreign-born:
44.6% (238)
White (Caucasian) - Speak another language Native:
4.3% (592)Foreign-born:
28.8% (154)
Black or African American - Speak only English Native:
99.6% (1,157)Foreign-born:
39.4% (29)
Black or African American - Speak another language Native:
1.8% (21)Foreign-born:
62.9% (46)
Asian - Speak only English Native:
68.1% (718)Foreign-born:
16.8% (198)
Asian - Speak another language Native:
32.5% (343)Foreign-born:
83.3% (981)
Native Hawaiian / Pacific Islander - Speak another language Native:
54.8% (45)Foreign-born:
96.0% (31)
Other race - Speak another language Native:
54.6% (313)Foreign-born:
100.0% (128)
Two or more races - Speak only English Native:
89.4% (2,950)Foreign-born:
9.8% (26)
Two or more races - Speak another language Native:
8.2% (271)Foreign-born:
90.6% (242)
White alone - Speak only English Native:
98.5% (12,530)Foreign-born:
53.4% (238)
White alone - Speak another language Native:
1.5% (197)Foreign-born:
29.0% (129)
Hispanic or Latino - Speak another language Native:
41.7% (1,247)Foreign-born:
98.8% (394)
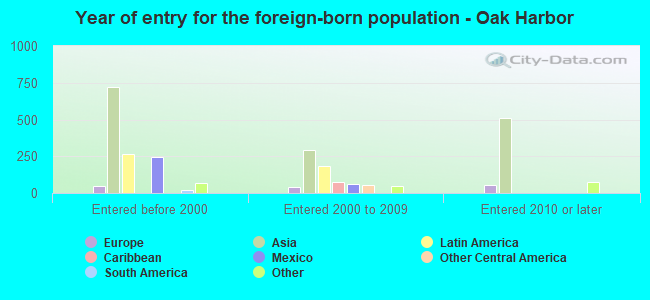
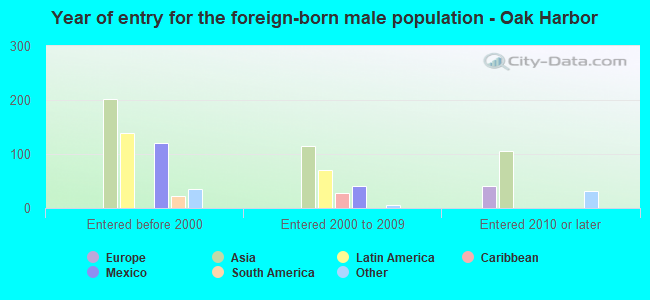
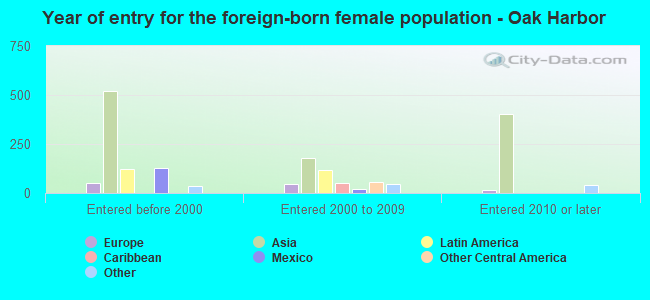
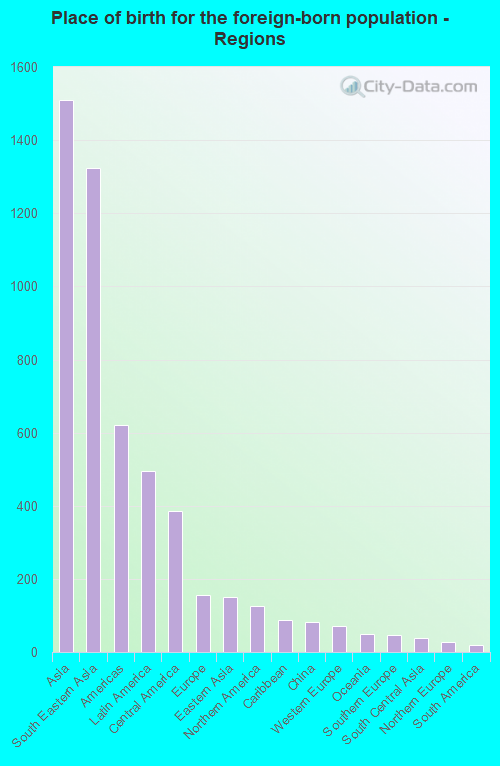
Foreign-born residents in Oak Harbor 2,355 residents are foreign born (5.9% Asia , 1.9% Latin America ).
This city:
9.6%Washington:
14.9%
Marital status for residents in Oak Harbor Marital status - White (Caucasian) population 15 years and over
Males 27.7% Never married59.5% Now married1.2% Separated3.0% Widowed8.6% DivorcedFemales 18.9% Never married55.6% Now married1.5% Separated7.4% Widowed16.6% DivorcedWomen who gave birth in the past 12 months Now married:
76.7% (306)Unmarried:
23.3% (93)
Women who did not give birth in the past 12 months Now married:
64.1% (2,023)Unmarried:
35.9% (1,134)
Marital status - Black or African American population 15 years and over
Males 32.4% Never married63.1% Now married3.6% Separated0.0% Widowed0.9% DivorcedFemales 24.3% Never married47.6% Now married11.8% Separated5.7% Widowed10.6% DivorcedWomen who gave birth in the past 12 months Now married:
100.0% (83)Unmarried:
0.0% (0)
Women who did not give birth in the past 12 months Now married:
56.1% (143)Unmarried:
43.9% (112)
Marital status - American Indian / Alaska Native population 15 years and over
Males 25.0% Never married69.8% Now married0.0% Separated0.0% Widowed5.2% DivorcedFemales 25.9% Never married74.1% Now married0.0% Separated0.0% Widowed0.0% DivorcedWomen who gave birth in the past 12 months Now married:
100.0% (11)Unmarried:
0.0% (0)
Women who did not give birth in the past 12 months Now married:
39.1% (11)Unmarried:
60.9% (17)
Marital status - Asian population 15 years and over
Males 22.5% Never married71.4% Now married0.0% Separated0.0% Widowed6.1% DivorcedFemales 19.0% Never married66.2% Now married1.5% Separated12.5% Widowed0.8% DivorcedWomen who gave birth in the past 12 months Now married:
100.0% (74)Unmarried:
0.0% (0)
Women who did not give birth in the past 12 months Now married:
61.4% (311)Unmarried:
38.6% (195)
Marital status - Native Hawaiian / Pacific Islander population 15 years and over
Males 88.5% Never married11.5% Now married0.0% Separated0.0% Widowed0.0% DivorcedFemales 42.2% Never married54.7% Now married3.1% Separated0.0% Widowed0.0% DivorcedWomen who did not give birth in the past 12 months Now married:
57.8% (40)Unmarried:
42.2% (29)
Marital status - Other race population 15 years and over
Males 40.6% Never married52.6% Now married0.0% Separated0.0% Widowed6.8% DivorcedFemales 11.5% Never married79.2% Now married0.0% Separated4.3% Widowed5.0% DivorcedWomen who gave birth in the past 12 months Now married:
42.9% (11)Unmarried:
57.1% (14)
Women who did not give birth in the past 12 months Now married:
88.3% (249)Unmarried:
11.7% (33)
Marital status - Two or more races population 15 years and over
Males 42.1% Never married53.8% Now married0.0% Separated0.0% Widowed4.0% DivorcedFemales 30.3% Never married40.0% Now married6.3% Separated12.1% Widowed11.3% DivorcedWomen who gave birth in the past 12 months Now married:
100.0% (115)Unmarried:
0.0% (0)
Women who did not give birth in the past 12 months Now married:
42.7% (586)Unmarried:
57.3% (786)
Marital status - White alone, not Hispanic / Latino population 15 years and over
Males 27.2% Never married59.5% Now married1.2% Separated3.3% Widowed8.9% DivorcedFemales 17.8% Never married55.2% Now married1.4% Separated8.2% Widowed17.4% DivorcedWomen who gave birth in the past 12 months Now married:
80.3% (261)Unmarried:
19.7% (64)
Women who did not give birth in the past 12 months Now married:
64.2% (1,887)Unmarried:
35.8% (1,050)
Marital status - Hispanic or Latino population 15 years and over
Males 26.9% Never married66.3% Now married0.8% Separated0.0% Widowed6.0% DivorcedFemales 22.2% Never married69.2% Now married1.2% Separated2.6% Widowed4.8% DivorcedWomen who gave birth in the past 12 months Now married:
63.3% (85)Unmarried:
36.7% (50)
Women who did not give birth in the past 12 months Now married:
74.5% (672)Unmarried:
25.5% (230)
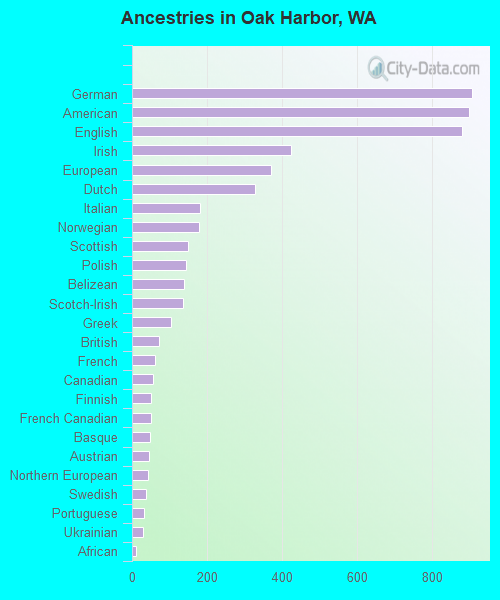
Ancestries in Oak Harbor
907 7.9% German899 7.9% American880 7.7% English425 3.7% Irish370 3.2% European329 2.9% Dutch181 1.6% Italian179 1.6% Norwegian150 1.3% Scottish144 1.3% Polish138 1.2% Belizean136 1.2% Scotch-Irish104 0.9% Greek73 0.6% British62 0.5% French57 0.5% Canadian51 0.4% Finnish50 0.4% French Canadian49 0.4% Basque46 0.4% Austrian44 0.4% Northern European38 0.3% Swedish32 0.3% Portuguese30 0.3% Ukrainian12 0.1% African11 0.10% Lithuanian8 0.07% Danish6 0.05% Scandinavian
Geographical mobility in Oak Harbor Same house 1 year ago 12,087 78.1% White (Caucasian)954 72.3% Black or African American298 87.5% American Indian / Alaska Native1,566 72.1% Asian150 100.0% Native Hawaiian / Pacific Islander756 91.2% Other race4,149 85.7% Two or more races10,834 76.8% White alone, not Hispanic / Latino3,420 88.4% Hispanic or LatinoMoved within same county 1,188 7.7% White / Caucasian137 10.4% Black or African American14 4.1% American Indian / Alaska Native391 18.0% Asian33 4.0% Other race297 6.1% Two or more races1,160 8.2% White alone, not Hispanic / Latino157 4.1% Hispanic or LatinoMoved within same state 697 4.5% White / Caucasian52 3.9% Black or African American56 2.6% Asian13 1.6% Other race65 1.4% Two or more races643 4.6% White alone, not Hispanic / Latino85 2.2% Hispanic or LatinoMoved from different state 1,407 9.1% White / Caucasian169 12.8% Black or African American13 3.7% American Indian / Alaska Native117 5.4% Asian27 3.2% Other race309 6.4% Two or more races1,311 9.3% White alone, not Hispanic / Latino358 9.2% Hispanic or LatinoMoved from abroad 141 0.9% White16 4.8% American Indian / Alaska Native56 2.6% Asian17 2.0% Other race34 0.7% Two or more races141 1.0% White alone, not Hispanic / Latino21 0.5% Hispanic or Latino
Children Nativity (place of birth) in Oak Harbor
Children under 6 years - Living with two parents Both parents native 1,714 100.0% NativeBoth parents foreign-born 118 100.0% NativeOne native, one foreign-born parent 246 100.0% NativeChildren under 6 years - Living with one parent Native parent 681 100.0% NativeForeign-born parent 99 100.0% NativeChildren 6 to 17 years - Living with two parents Both parents native 1,822 100.0% NativeBoth parents foreign-born 81 65.6% Native42 34.4% Foreign-bornOne native, one foreign-born parent 607 100.0% NativeChildren 6 to 17 years - Living with one parent Native parent 921 100.0% NativeForeign-born parent 133 52.5% Native120 47.5% Foreign-born
Grandparents responsible for own grandchildren in Oak Harbor
Grandparents (30 to 59 years) White / Caucasian 51 54.9% Responsible for grandchildren42 45.1% Not responsible for grandchildrenAsian 16 48.1% Responsible for grandchildren17 51.9% Not responsible for grandchildrenWhite alone, not Hispanic / Latino 50 52.1% Responsible for grandchildren46 47.9% Not responsible for grandchildrenGrandparents (60 years and over) White / Caucasian 31 18.3% Responsible for grandchildren138 81.7% Not responsible for grandchildrenAsian 61 100.0% Not responsible for grandchildrenWhite alone, not Hispanic / Latino 32 24.6% Responsible for grandchildren97 75.4% Not responsible for grandchildren