Races in Oak Park, Michigan (MI) Detailed Stats
Data:
Races - White alone (%)
Races - White alone (% change since 2000)
Races - Black alone (%)
Races - Black alone (% change since 2000)
Races - American Indian alone (%)
Races - American Indian alone (% change since 2000)
Races - Asian alone (%)
Races - Asian alone (% change since 2000)
Races - Hispanic (%)
Races - Hispanic (% change since 2000)
Races - Native Hawaiian and Other Pacific Islander alone (%)
Races - Native Hawaiian and Other Pacific Islander alone (% change since 2000)
Races - Two or more races(%)
Races - Two or more races(% change since 2000)
Races - Other race alone (%)
Races - Other race alone (% change since 2000)
Racial diversity
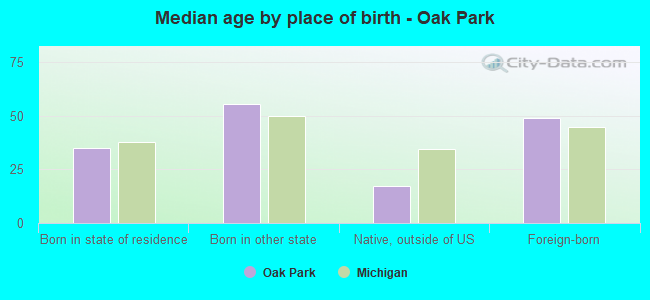
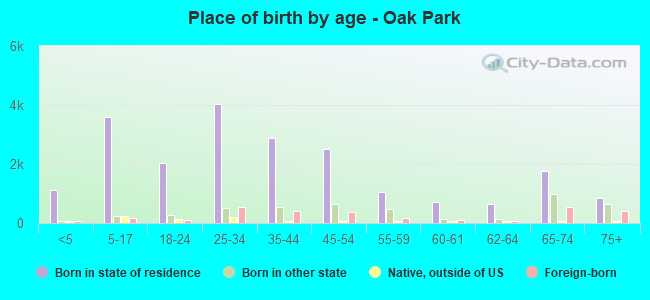
Place of birth - Born in state of residence (%)
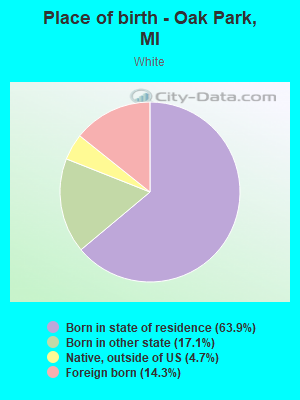
Place of birth - Born in state of residence (%) - White
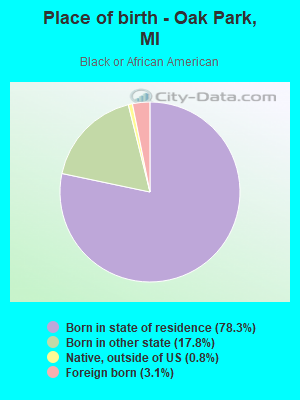
Place of birth - Born in state of residence (%) - Black or African American
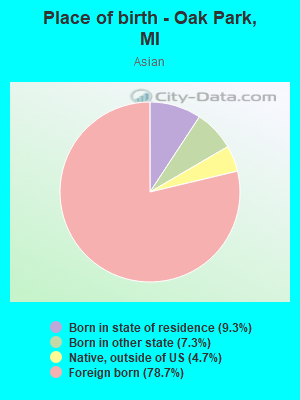
Place of birth - Born in state of residence (%) - Asian
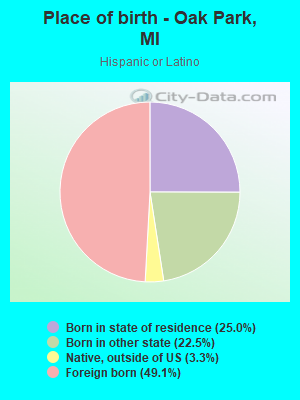
Place of birth - Born in state of residence (%) - Hispanic or Latino
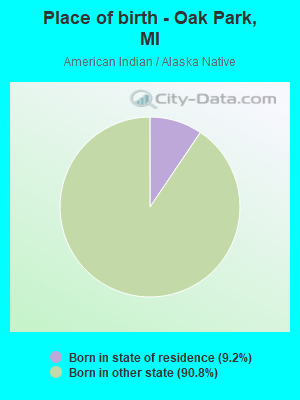
Place of birth - Born in state of residence (%) - American Indian and Alaska Native
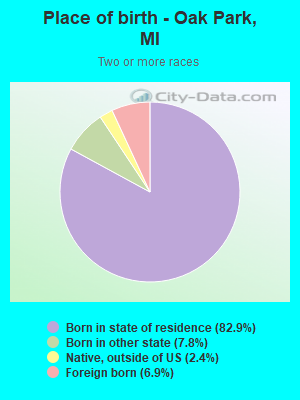
Place of birth - Born in state of residence (%) - Multirace
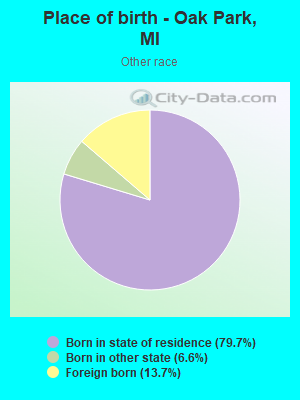
Place of birth - Born in state of residence (%) - Other Race
Place of birth - Born in other state (%)
Place of birth - Born in other state (%) - White
Place of birth - Born in other state (%) - Black or African American
Place of birth - Born in other state (%) - Asian
Place of birth - Born in other state (%) - Hispanic or Latino
Place of birth - Born in other state (%) - American Indian and Alaska Native
Place of birth - Born in other state (%) - Multirace
Place of birth - Born in other state (%) - Other Race
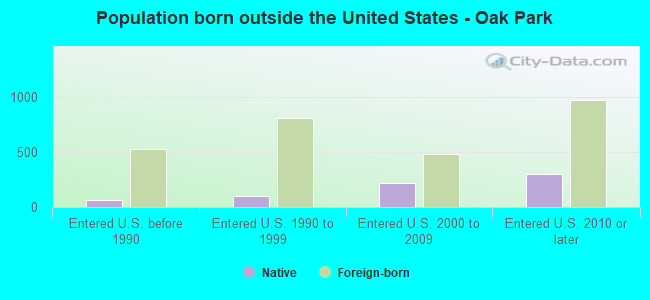
Place of birth - Native, outside of US (%)
Place of birth - Native, outside of US (%) - White
Place of birth - Native, outside of US (%) - Black or African American
Place of birth - Native, outside of US (%) - Asian
Place of birth - Native, outside of US (%) - Hispanic or Latino
Place of birth - Native, outside of US (%) - American Indian and Alaska Native
Place of birth - Native, outside of US (%) - Multirace
Place of birth - Native, outside of US (%) - Other Race
Place of birth - Foreign born (%)
Place of birth - Foreign born (%) - White
Place of birth - Foreign born (%) - Black or African American
Place of birth - Foreign born (%) - Asian
Place of birth - Foreign born (%) - Hispanic or Latino
Place of birth - Foreign born (%) - American Indian and Alaska Native
Place of birth - Foreign born (%) - Multirace
Place of birth - Foreign born (%) - Other Race
Residents speaking English at home (%)
Residents speaking English at home - Born in the United States (%)
Residents speaking English at home - Native, born elsewhere (%)
Residents speaking English at home - Foreign born (%)
Residents speaking Spanish at home (%)
Residents speaking Spanish at home - Born in the United States (%)
Residents speaking Spanish at home - Native, born elsewhere (%)
Residents speaking Spanish at home - Foreign born (%)
Residents speaking other language at home (%)
Residents speaking other language at home - Born in the United States (%)
Residents speaking other language at home - Native, born elsewhere (%)
Residents speaking other language at home - Foreign born (%)
Marital status - Never married (%)
Marital status - Now married (%)
Marital status - Separated (%)
Marital status - Widowed (%)
Marital status - Divorced (%)
Ancestries Reported - Arab (%)
Ancestries Reported - Czech (%)
Ancestries Reported - Danish (%)
Ancestries Reported - Dutch (%)
Ancestries Reported - English (%)
Ancestries Reported - French (%)
Ancestries Reported - French Canadian (%)
Ancestries Reported - German (%)
Ancestries Reported - Greek (%)
Ancestries Reported - Hungarian (%)
Ancestries Reported - Irish (%)
Ancestries Reported - Italian (%)
Ancestries Reported - Lithuanian (%)
Ancestries Reported - Norwegian (%)
Ancestries Reported - Polish (%)
Ancestries Reported - Portuguese (%)
Ancestries Reported - Russian (%)
Ancestries Reported - Scotch-Irish (%)
Ancestries Reported - Scottish (%)
Ancestries Reported - Slovak (%)
Ancestries Reported - Subsaharan African (%)
Ancestries Reported - Swedish (%)
Ancestries Reported - Swiss (%)
Ancestries Reported - Ukrainian (%)
Ancestries Reported - United States (%)
Ancestries Reported - Welsh (%)
Ancestries Reported - West Indian (%)
Ancestries Reported - Other (%)
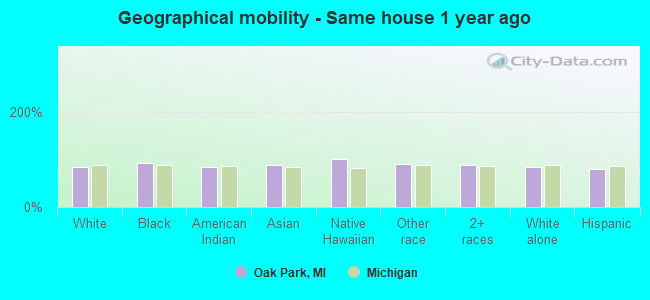
Geographical mobility - Same house 1 year ago (%)
Geographical mobility - Same house 1 year ago (%) - White
Geographical mobility - Same house 1 year ago (%) - Black or African American
Geographical mobility - Same house 1 year ago (%) - Asian
Geographical mobility - Same house 1 year ago (%) - Hispanic or Latino
Geographical mobility - Same house 1 year ago (%) - American Indian and Alaska Native
Geographical mobility - Same house 1 year ago (%) - Multirace
Geographical mobility - Same house 1 year ago (%) - Other Race
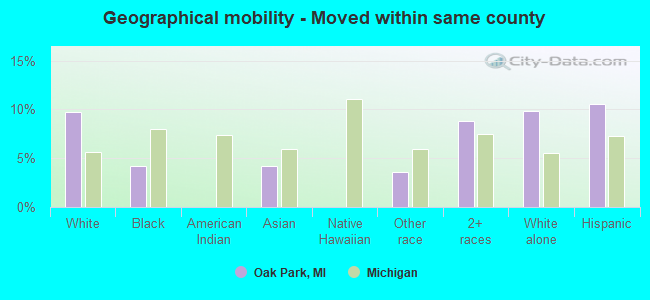
Geographical mobility - Moved within same county (%)
Geographical mobility - Moved within same county (%) - White
Geographical mobility - Moved within same county (%) - Black or African American
Geographical mobility - Moved within same county (%) - Asian
Geographical mobility - Moved within same county (%) - Hispanic or Latino
Geographical mobility - Moved within same county (%) - American Indian and Alaska Native
Geographical mobility - Moved within same county (%) - Multirace
Geographical mobility - Moved within same county (%) - Other Race
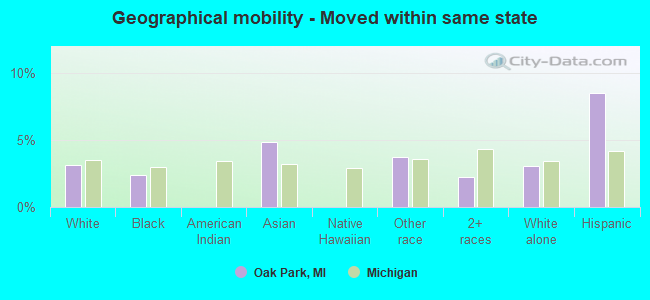
Geographical mobility - Moved from different county within same state (%)
Geographical mobility - Moved from different county within same state (%) - White
Geographical mobility - Moved from different county within same state (%) - Black or African American
Geographical mobility - Moved from different county within same state (%) - Asian
Geographical mobility - Moved from different county within same state (%) - Hispanic or Latino
Geographical mobility - Moved from different county within same state (%) - American Indian and Alaska Native
Geographical mobility - Moved from different county within same state (%) - Multirace
Geographical mobility - Moved from different county within same state (%) - Other Race
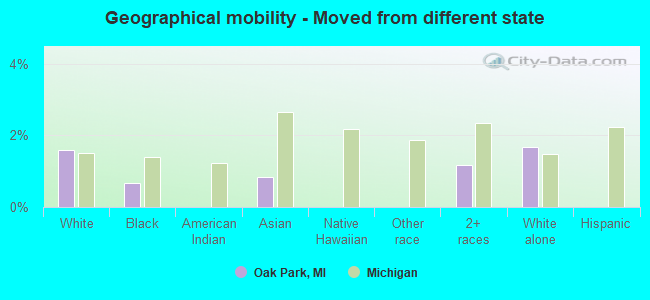
Geographical mobility - Moved from different state (%)
Geographical mobility - Moved from different state (%) - White
Geographical mobility - Moved from different state (%) - Black or African American
Geographical mobility - Moved from different state (%) - Asian
Geographical mobility - Moved from different state (%) - Hispanic or Latino
Geographical mobility - Moved from different state (%) - American Indian and Alaska Native
Geographical mobility - Moved from different state (%) - Multirace
Geographical mobility - Moved from different state (%) - Other Race
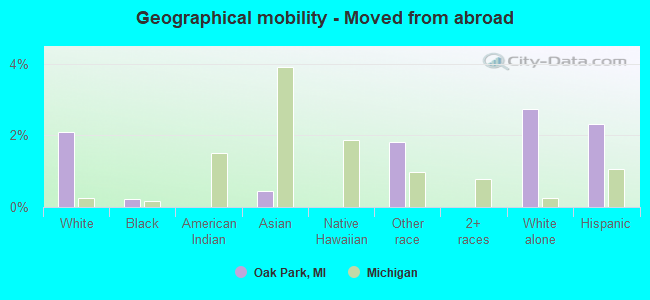
Geographical mobility - Moved from abroad (%)
Geographical mobility - Moved from abroad (%) - White
Geographical mobility - Moved from abroad (%) - Black or African American
Geographical mobility - Moved from abroad (%) - Asian
Geographical mobility - Moved from abroad (%) - Hispanic or Latino
Geographical mobility - Moved from abroad (%) - American Indian and Alaska Native
Geographical mobility - Moved from abroad (%) - Multirace
Geographical mobility - Moved from abroad (%) - Other Race
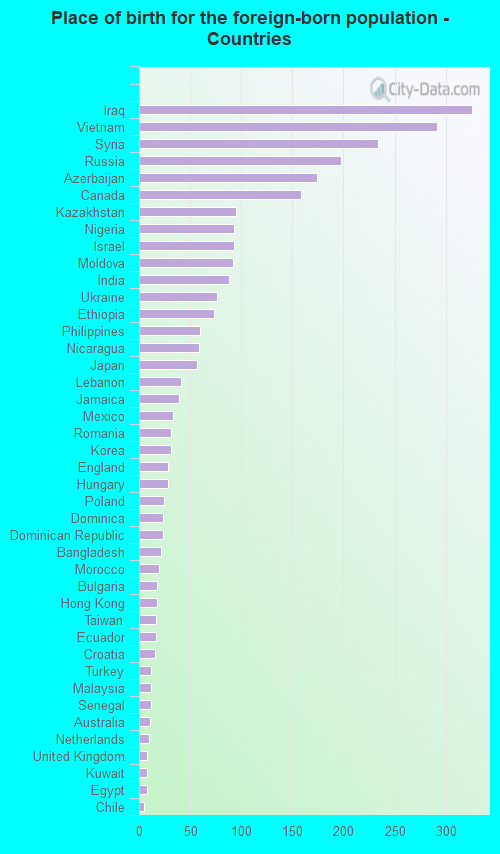
Place of birth for the foreign-born population - Ireland (%)
Place of birth for the foreign-born population - Denmark (%)
Place of birth for the foreign-born population - Norway (%)
Place of birth for the foreign-born population - Sweden (%)
Place of birth for the foreign-born population - United Kingdom (%)
Place of birth for the foreign-born population - England (%)
Place of birth for the foreign-born population - Scotland (%)
Place of birth for the foreign-born population - Other Northern Europe (%)
Place of birth for the foreign-born population - Austria (%)
Place of birth for the foreign-born population - Belgium (%)
Place of birth for the foreign-born population - France (%)
Place of birth for the foreign-born population - Germany (%)
Place of birth for the foreign-born population - Netherlands (%)
Place of birth for the foreign-born population - Switzerland (%)
Place of birth for the foreign-born population - Other Western Europe (%)
Place of birth for the foreign-born population - Greece (%)
Place of birth for the foreign-born population - Italy (%)
Place of birth for the foreign-born population - Portugal (%)
Place of birth for the foreign-born population - Spain (%)
Place of birth for the foreign-born population - Other Southern Europe (%)
Place of birth for the foreign-born population - Albania (%)
Place of birth for the foreign-born population - Belarus (%)
Place of birth for the foreign-born population - Bosnia and Herzegovina (%)
Place of birth for the foreign-born population - Bulgaria (%)
Place of birth for the foreign-born population - Croatia (%)
Place of birth for the foreign-born population - Czechoslovakia (%)
Place of birth for the foreign-born population - Hungary (%)
Place of birth for the foreign-born population - Latvia (%)
Place of birth for the foreign-born population - Lithuania (%)
Place of birth for the foreign-born population - North Macedonia (Macedonia) (%)
Place of birth for the foreign-born population - Moldova (%)
Place of birth for the foreign-born population - Poland (%)
Place of birth for the foreign-born population - Romania (%)
Place of birth for the foreign-born population - Russia (%)
Place of birth for the foreign-born population - Serbia (%)
Place of birth for the foreign-born population - Ukraine (%)
Place of birth for the foreign-born population - Other Eastern Europe (%)
Place of birth for the foreign-born population - China (%)
Place of birth for the foreign-born population - Hong Kong (%)
Place of birth for the foreign-born population - Taiwan (%)
Place of birth for the foreign-born population - Japan (%)
Place of birth for the foreign-born population - Korea (%)
Place of birth for the foreign-born population - Other Eastern Asia (%)
Place of birth for the foreign-born population - Afghanistan (%)
Place of birth for the foreign-born population - Bangladesh (%)
Place of birth for the foreign-born population - India (%)
Place of birth for the foreign-born population - Iran (%)
Place of birth for the foreign-born population - Kazakhstan (%)
Place of birth for the foreign-born population - Nepal (%)
Place of birth for the foreign-born population - Pakistan (%)
Place of birth for the foreign-born population - Sri Lanka (%)
Place of birth for the foreign-born population - Uzbekistan (%)
Place of birth for the foreign-born population - Other South Central Asia (%)
Place of birth for the foreign-born population - Burma (%)
Place of birth for the foreign-born population - Cambodia (%)
Place of birth for the foreign-born population - Indonesia (%)
Place of birth for the foreign-born population - Laos (%)
Place of birth for the foreign-born population - Malaysia (%)
Place of birth for the foreign-born population - Philippines (%)
Place of birth for the foreign-born population - Singapore (%)
Place of birth for the foreign-born population - Thailand (%)
Place of birth for the foreign-born population - Vietnam (%)
Place of birth for the foreign-born population - Other South Eastern Asia (%)
Place of birth for the foreign-born population - Armenia (%)
Place of birth for the foreign-born population - Iraq (%)
Place of birth for the foreign-born population - Israel (%)
Place of birth for the foreign-born population - Jordan (%)
Place of birth for the foreign-born population - Kuwait (%)
Place of birth for the foreign-born population - Lebanon (%)
Place of birth for the foreign-born population - Saudi Arabia (%)
Place of birth for the foreign-born population - Syria (%)
Place of birth for the foreign-born population - Turkey (%)
Place of birth for the foreign-born population - Yemen (%)
Place of birth for the foreign-born population - Other Western Asia (%)
Place of birth for the foreign-born population - Eritrea (%)
Place of birth for the foreign-born population - Ethiopia (%)
Place of birth for the foreign-born population - Kenya (%)
Place of birth for the foreign-born population - Somalia (%)
Place of birth for the foreign-born population - Uganda (%)
Place of birth for the foreign-born population - Zimbabwe (%)
Place of birth for the foreign-born population - Other Eastern Africa (%)
Place of birth for the foreign-born population - Cameroon (%)
Place of birth for the foreign-born population - Congo (%)
Place of birth for the foreign-born population - Democratic Republic of Congo (Zaire) (%)
Place of birth for the foreign-born population - Other Middle Africa (%)
Place of birth for the foreign-born population - Egypt (%)
Place of birth for the foreign-born population - Morocco (%)
Place of birth for the foreign-born population - Sudan (%)
Place of birth for the foreign-born population - Other Northern Africa (%)
Place of birth for the foreign-born population - South Africa (%)
Place of birth for the foreign-born population - Other Southern Africa (%)
Place of birth for the foreign-born population - Cabo Verde (%)
Place of birth for the foreign-born population - Ghana (%)
Place of birth for the foreign-born population - Liberia (%)
Place of birth for the foreign-born population - Nigeria (%)
Place of birth for the foreign-born population - Senegal (%)
Place of birth for the foreign-born population - Sierra Leone (%)
Place of birth for the foreign-born population - Other Western Africa (%)
Place of birth for the foreign-born population - Australia (%)
Place of birth for the foreign-born population - New Zealand (%)
Place of birth for the foreign-born population - Fiji (%)
Place of birth for the foreign-born population - Micronesia (%)
Place of birth for the foreign-born population - Bahamas (%)
Place of birth for the foreign-born population - Barbados (%)
Place of birth for the foreign-born population - Cuba (%)
Place of birth for the foreign-born population - Dominica (%)
Place of birth for the foreign-born population - Dominican Republic (%)
Place of birth for the foreign-born population - Grenada (%)
Place of birth for the foreign-born population - Haiti (%)
Place of birth for the foreign-born population - Jamaica (%)
Place of birth for the foreign-born population - St. Vincent and the Grenadines (%)
Place of birth for the foreign-born population - Trinidad and Tobago (%)
Place of birth for the foreign-born population - West Indies (%)
Place of birth for the foreign-born population - Other Caribbean (%)
Place of birth for the foreign-born population - Belize (%)
Place of birth for the foreign-born population - Costa Rica (%)
Place of birth for the foreign-born population - El Salvador (%)
Place of birth for the foreign-born population - Guatemala (%)
Place of birth for the foreign-born population - Honduras (%)
Place of birth for the foreign-born population - Mexico (%)
Place of birth for the foreign-born population - Nicaragua (%)
Place of birth for the foreign-born population - Panama (%)
Place of birth for the foreign-born population - Other Central America (%)
Place of birth for the foreign-born population - Argentina (%)
Place of birth for the foreign-born population - Bolivia (%)
Place of birth for the foreign-born population - Brazil (%)
Place of birth for the foreign-born population - Chile (%)
Place of birth for the foreign-born population - Colombia (%)
Place of birth for the foreign-born population - Ecuador (%)
Place of birth for the foreign-born population - Guyana (%)
Place of birth for the foreign-born population - Peru (%)
Place of birth for the foreign-born population - Uruguay (%)
Place of birth for the foreign-born population - Venezuela (%)
Place of birth for the foreign-born population - Other South America (%)
Place of birth for the foreign-born population - Canada (%)
Place of birth for the foreign-born population - Other Northern America (%)
Place of birth for the foreign-born population - Other (%)
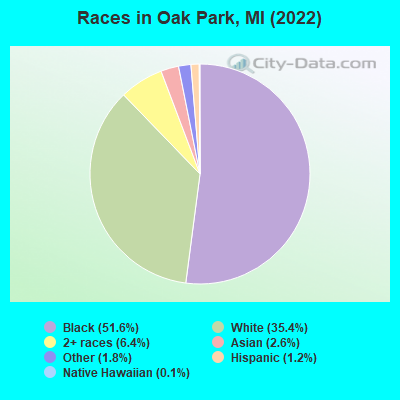
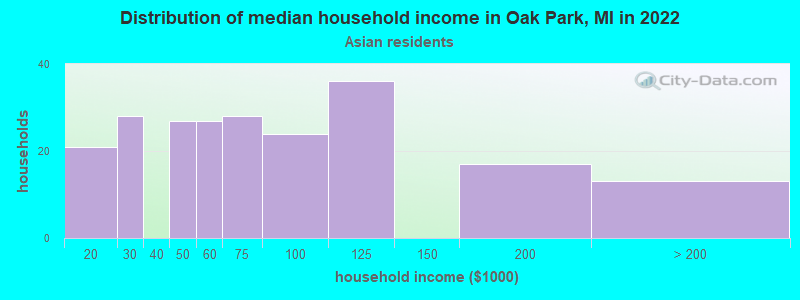
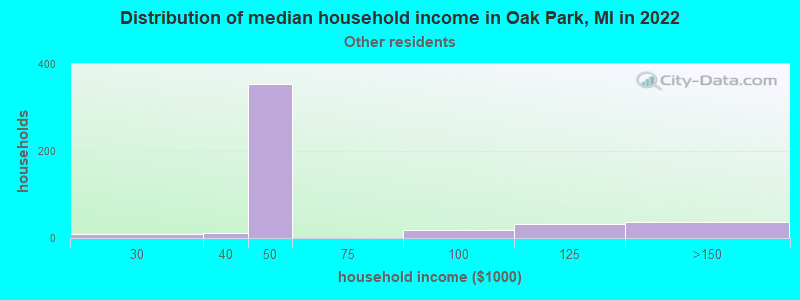
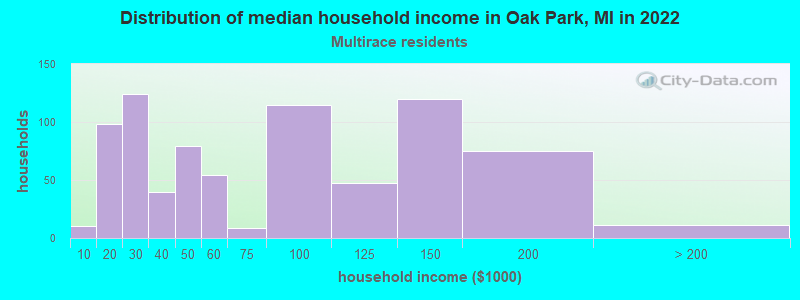
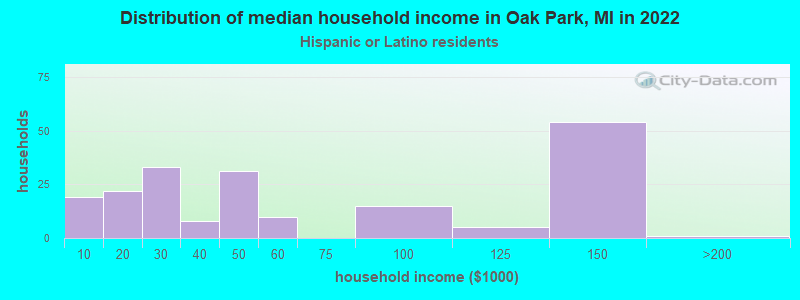
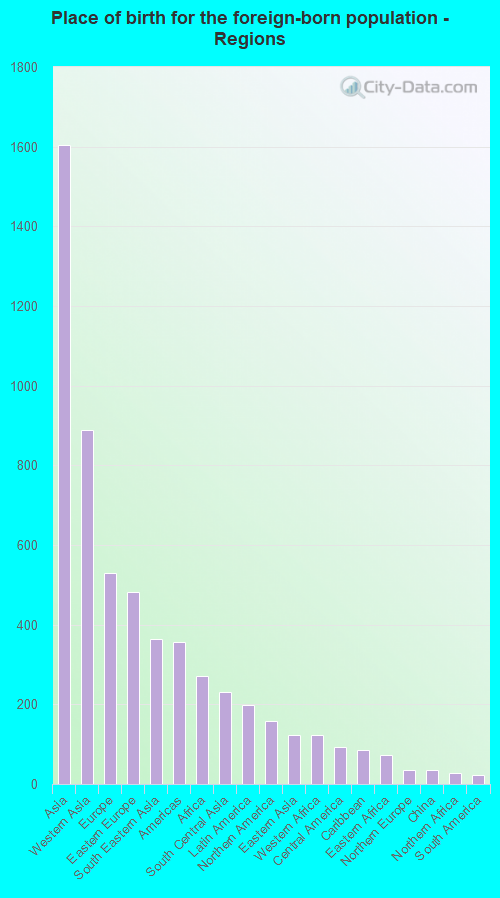
According to 2022 data, the most numerous races in Oak Park, MI are White alone (10,419 residents), Black alone (15,199 residents), and Hispanic (353 residents). 87.1% of Oak Park residents speak English at home. 9.4% of Oak Park, MI residents are foreign-born (5.4% born in Asia, 1.8% born in Europe), which is 36.3% greater than the foreign-born rate of 6.0% across the entire state of Michigan.
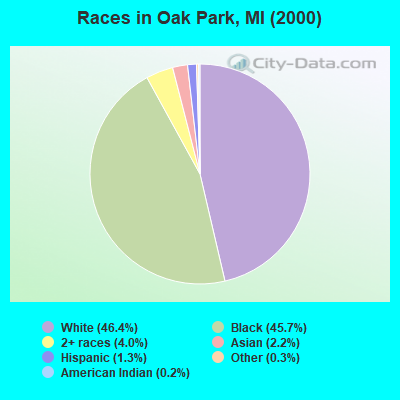
Race distribution in Oak Park
2000 2022
7,806,691 78.6% White alone 1,402,047 14.1% Black alone 323,877 3.3% Hispanic 175,311 1.8% Asian alone 163,487 1.6% Two or more races 53,421 0.5% American Indian alone 11,465 0.1% Other race alone 2,145 0.02% Native Hawaiian and Other
7,289,051 72.6% White alone 1,310,464 13.1% Black alone 572,405 5.7% Hispanic 450,031 4.5% Two or more races 335,732 3.3% Asian alone 45,217 0.5% Other race alone 29,011 0.3% American Indian alone 2,207 0.02% Native Hawaiian and Other
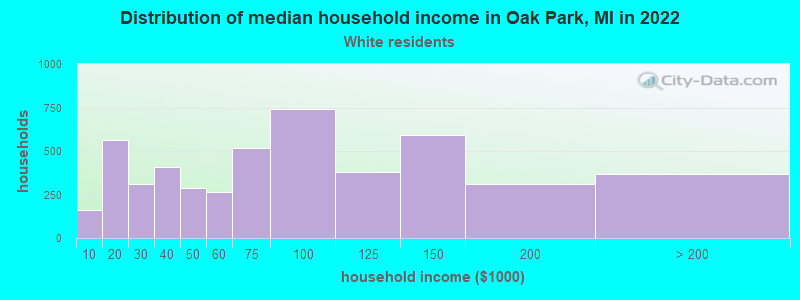
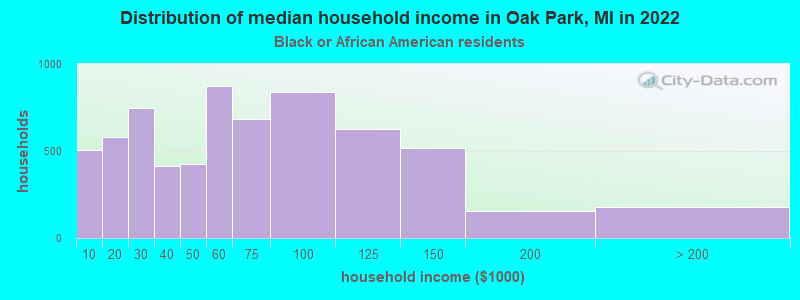
Income and house value in Oak Park Median household income in 2022 $75,148 White non-Hispanic householders$57,548 Black householders$73,829 Asian householders$51,620 Some other race householdersMedian 2022 house value $188,016 White Non-Hispanic householders$200,190 Black or African American householders$95,868 American Indian or Alaska Native householders $182,267 Asian householders$240,938 Some other race householders$188,185 Two or more races householders$178,886 Hispanic or Latino householders
Median age by race in Oak Park
37.0 Median age for White residents36.8 37.0 41.7 Median age for Black or African American residents39.6 46.5 69.2 Median age for American Indian / Alaska Native residents-505,050,504.5 70.1 48.4 Median age for Asian residents68.6 37.9 -670,531,400.3 Median age for Native Hawaiian / Pacific Islander residents-674,772,035.8 -699,588,476.7 33.6 Median age for Other race residents35.5 34.2 28.6 Median age for Two or more races residents29.5 26.4 36.7 Median age for White alone residents37.0 36.4 39.4 Median age for Hispanic or Latino residents50.3 38.6
Owner/renter occupied households by race in Oak Park
House owners and renters - White residents 3,186 66.1% Owner occupied1,637 33.9% Renter occupiedHouse owners and renters - Black or African American residents 3,556 53.9% Owner occupied3,037 46.1% Renter occupiedHouse owners and renters - American Indian / Alaska Native residents 19 100.0% Renter occupiedHouse owners and renters - Asian residents 118 54.8% Owner occupied98 45.2% Renter occupiedHouse owners and renters - Other race residents 242 68.6% Owner occupied111 31.4% Renter occupiedHouse owners and renters - Two or more races residents 522 64.8% Owner occupied284 35.2% Renter occupiedHouse owners and renters - White alone residents 3,173 65.8% Owner occupied1,648 34.2% Renter occupiedHouse owners and renters - Hispanic or Latino residents 88 43.9% Owner occupied112 56.1% Renter occupied
Language usage in Oak Park
English speakers - Total 87.1% of residents of Oak Park speak English at home.
1.7% of residents speak Spanish at home 431 91.7% Speak English very well39 8.3% Speak English less than very well11.0% of residents speak other language at home 1,579 50.9% Speak English very well1,525 49.1% Speak English less than very well
English speakers - Born in the United States 94.2% of residents of Oak Park speak English at home.
2.0% of residents speak Spanish at home 84 91.3% Speak English very well8 8.7% Speak English less than very well3.5% of residents speak other language at home 161 98.8% Speak English very well2 1.2% Speak English less than very well
English speakers - Native, born elsewhere 74.2% of residents of Oak Park speak English at home.
36.2% of residents speak other language at home 91 39.1% Speak English very well142 60.9% Speak English less than very well
English speakers - Foreign-born 13.7% of residents of Oak Park speak English at home.
6.7% of residents speak Spanish at home 151 80.7% Speak English very well36 19.3% Speak English less than very well77.2% of residents speak other language at home 805 37.3% Speak English very well1,355 62.7% Speak English less than very well
White (Caucasian) - Speak only English Native:
93.0% (7,703)Foreign-born:
16.3% (235)
White (Caucasian) - Speak another language Native:
6.8% (564)Foreign-born:
82.2% (1,187)
Black or African American - Speak only English Native:
97.6% (13,971)Foreign-born:
15.3% (72)
Black or African American - Speak another language Native:
2.4% (345)Foreign-born:
92.0% (434)
Asian - Speak only English Native:
39.5% (60)Foreign-born:
10.3% (62)
Asian - Speak another language Native:
59.8% (91)Foreign-born:
89.6% (537)
Other race - Speak only English Native:
89.2% (659)Foreign-born:
4.1% (5)
Other race - Speak another language Native:
4.0% (29)Foreign-born:
99.3% (111)
Two or more races - Speak another language Native:
7.2% (130)Foreign-born:
100.0% (153)
White alone - Speak only English Native:
92.6% (7,719)Foreign-born:
15.9% (238)
White alone - Speak another language Native:
7.6% (635)Foreign-born:
83.1% (1,241)
Hispanic or Latino - Speak only English Native:
63.1% (109)Foreign-born:
4.0% (7)
Hispanic or Latino - Speak another language Native:
36.8% (63)Foreign-born:
96.7% (179)
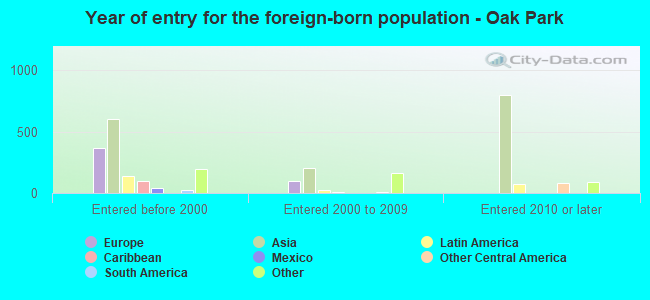
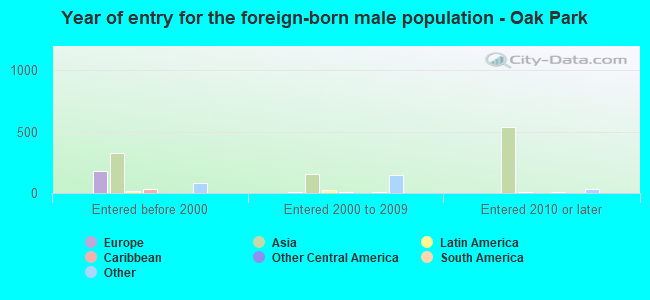
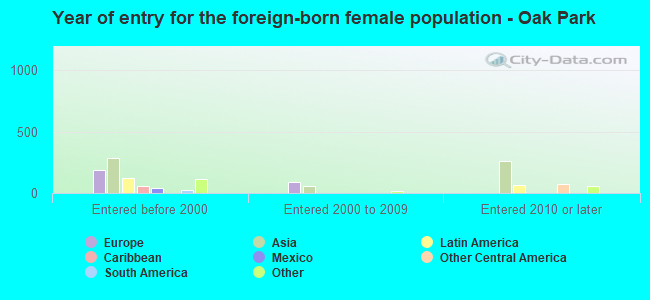
Foreign-born residents in Oak Park 2,774 residents are foreign born (5.4% Asia , 1.8% Europe ).
This city:
9.4%Michigan:
6.9%
Marital status for residents in Oak Park Marital status - White (Caucasian) population 15 years and over
Males 49.3% Never married43.1% Now married0.4% Separated1.4% Widowed5.9% DivorcedFemales 32.0% Never married40.8% Now married1.1% Separated10.3% Widowed15.7% DivorcedWomen who gave birth in the past 12 months Now married:
100.0% (95)Unmarried:
0.0% (0)
Women who did not give birth in the past 12 months Now married:
37.6% (885)Unmarried:
62.4% (1,471)
Marital status - Black or African American population 15 years and over
Males 48.9% Never married35.2% Now married3.0% Separated2.5% Widowed10.5% DivorcedFemales 45.7% Never married22.5% Now married2.9% Separated9.3% Widowed19.6% DivorcedWomen who gave birth in the past 12 months Now married:
18.6% (19)Unmarried:
81.4% (85)
Women who did not give birth in the past 12 months Now married:
18.8% (757)Unmarried:
81.2% (3,262)
Marital status - Asian population 15 years and over
Males 33.3% Never married64.4% Now married0.0% Separated0.0% Widowed2.3% DivorcedFemales 26.2% Never married44.4% Now married0.0% Separated11.1% Widowed18.2% DivorcedWomen who did not give birth in the past 12 months Now married:
45.1% (74)Unmarried:
54.9% (90)
Marital status - Other race population 15 years and over
Males 12.3% Never married79.3% Now married0.0% Separated0.0% Widowed8.4% DivorcedFemales 2.3% Never married79.1% Now married0.0% Separated0.0% Widowed18.6% DivorcedWomen who did not give birth in the past 12 months Now married:
69.2% (214)Unmarried:
30.8% (95)
Marital status - Two or more races population 15 years and over
Males 37.7% Never married54.3% Now married0.0% Separated0.0% Widowed7.9% DivorcedFemales 26.9% Never married47.6% Now married0.0% Separated3.5% Widowed22.0% DivorcedWomen who gave birth in the past 12 months Now married:
100.0% (15)Unmarried:
0.0% (0)
Women who did not give birth in the past 12 months Now married:
53.7% (265)Unmarried:
46.3% (228)
Marital status - White alone, not Hispanic / Latino population 15 years and over
Males 49.3% Never married43.1% Now married0.4% Separated1.4% Widowed5.9% DivorcedFemales 32.3% Never married41.1% Now married1.1% Separated10.1% Widowed15.5% DivorcedWomen who gave birth in the past 12 months Now married:
100.0% (97)Unmarried:
0.0% (0)
Women who did not give birth in the past 12 months Now married:
37.4% (895)Unmarried:
62.6% (1,497)
Marital status - Hispanic or Latino population 15 years and over
Males 18.3% Never married45.2% Now married0.0% Separated0.0% Widowed36.5% DivorcedFemales 13.6% Never married23.2% Now married0.0% Separated9.0% Widowed54.2% DivorcedWomen who did not give birth in the past 12 months Now married:
33.6% (43)Unmarried:
66.4% (86)
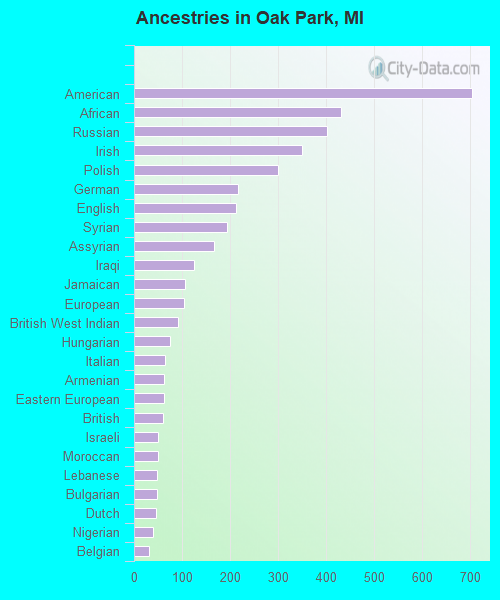
Ancestries in Oak Park
704 4.1% American430 2.5% African401 2.3% Russian350 2.0% Irish299 1.7% Polish216 1.2% German213 1.2% English194 1.1% Syrian167 1.0% Assyrian125 0.7% Iraqi106 0.6% Jamaican104 0.6% European92 0.5% British West Indian75 0.4% Hungarian65 0.4% Italian62 0.4% Armenian62 0.4% Eastern European61 0.4% British51 0.3% Israeli49 0.3% Moroccan48 0.3% Lebanese47 0.3% Bulgarian45 0.3% Dutch40 0.2% Nigerian31 0.2% Belgian29 0.2% Scotch-Irish25 0.1% Senegalese25 0.1% Swedish24 0.1% Norwegian23 0.1% Yugoslavian20 0.1% Ukrainian15 0.09% French15 0.09% Romanian13 0.07% Arab12 0.07% Turkish11 0.06% Finnish11 0.06% Canadian8 0.05% Lithuanian7 0.04% French Canadian7 0.04% Egyptian6 0.03% Greek3 0.02% Scandinavian1 0.01% Welsh
Geographical mobility in Oak Park Same house 1 year ago 8,492 82.9% White (Caucasian)14,158 93.1% Black or African American21 83.4% American Indian / Alaska Native692 89.4% Asian32 100.0% Native Hawaiian / Pacific Islander758 91.1% Other race1,917 86.7% Two or more races8,540 82.7% White alone, not Hispanic / Latino281 79.8% Hispanic or LatinoMoved within same county 1,000 9.8% White / Caucasian640 4.2% Black or African American32 4.2% Asian30 3.6% Other race194 8.8% Two or more races1,019 9.9% White alone, not Hispanic / Latino37 10.5% Hispanic or LatinoMoved within same state 318 3.1% White / Caucasian361 2.4% Black or African American37 4.8% Asian31 3.7% Other race49 2.2% Two or more races314 3.0% White alone, not Hispanic / Latino30 8.5% Hispanic or LatinoMoved from different state 164 1.6% White / Caucasian102 0.7% Black or African American6 0.8% Asian26 1.2% Two or more races174 1.7% White alone, not Hispanic / LatinoMoved from abroad 215 2.1% White33 0.2% Black or African American3 0.4% Asian15 1.8% Other race282 2.7% White alone, not Hispanic / Latino8 2.3% Hispanic or Latino
Children Nativity (place of birth) in Oak Park
Children under 6 years - Living with two parents Both parents native 836 100.0% NativeBoth parents foreign-born 17 100.0% NativeOne native, one foreign-born parent 61 100.0% NativeChildren under 6 years - Living with one parent Native parent 438 100.0% NativeForeign-born parent 74 100.0% NativeChildren 6 to 17 years - Living with two parents Both parents native 1,648 100.0% NativeBoth parents foreign-born 106 44.9% Native130 55.1% Foreign-bornOne native, one foreign-born parent 95 87.7% Native13 12.3% Foreign-bornChildren 6 to 17 years - Living with one parent Native parent 1,878 100.0% NativeForeign-born parent 166 46.9% Native187 53.1% Foreign-born
Grandparents responsible for own grandchildren in Oak Park
Grandparents (30 to 59 years) White / Caucasian 38 87.4% Responsible for grandchildren5 12.6% Not responsible for grandchildrenBlack or African American 31 60.3% Responsible for grandchildren20 39.7% Not responsible for grandchildrenTwo or more races 28 100.0% Responsible for grandchildrenWhite alone, not Hispanic / Latino 39 87.6% Responsible for grandchildren6 12.4% Not responsible for grandchildrenGrandparents (60 years and over) White / Caucasian 20 100.0% Not responsible for grandchildrenBlack or African American 10 5.3% Responsible for grandchildren186 94.7% Not responsible for grandchildrenTwo or more races 20 69.0% Responsible for grandchildren9 31.0% Not responsible for grandchildrenWhite alone, not Hispanic / Latino 20 100.0% Not responsible for grandchildren