Races in Oakway, South Carolina (SC) Detailed Stats
Ancestries, Foreign-born residents, place of birth
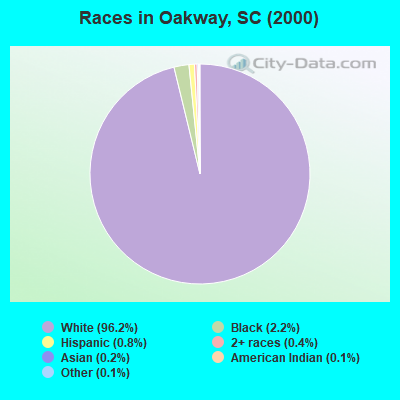
Race distribution in Oakway

- 8,27796.2%White alone
- 1882.2%Black alone
- 670.8%Hispanic
- 350.4%Two or more races
- 150.2%Asian alone
- 90.1%Other race alone
- 100.1%American Indian alone
- 10.01%Native Hawaiian and Other
Pacific Islander alone
2000
2022
-
- 2,652,29166.1%White alone
- 1,178,48629.4%Black alone
- 95,0762.4%Hispanic
- 35,5680.9%Asian alone
- 33,2900.8%Two or more races
- 12,7650.3%American Indian alone
- 3,2660.08%Other race alone
- 1,2700.03%Native Hawaiian and Other
Pacific Islander alone

-
- 3,301,73962.5%White alone
- 1,313,29024.9%Black alone
- 343,7836.5%Hispanic
- 190,5083.6%Two or more races
- 89,8881.7%Asian alone
- 29,3900.6%Other race alone
- 12,1120.2%American Indian alone
- 1,9240.04%Native Hawaiian and Other
Pacific Islander alone

Income and house value in Oakway
- Median household income in 2022
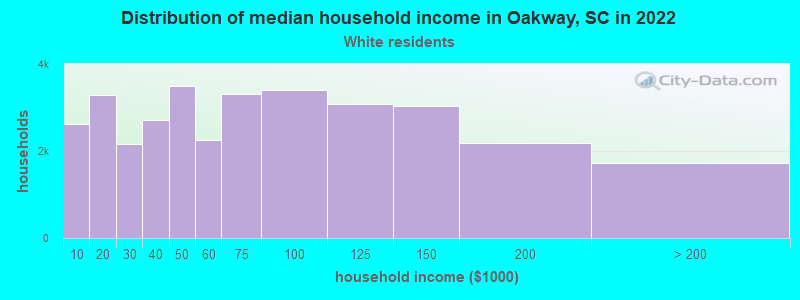
- $65,146White non-Hispanic householders
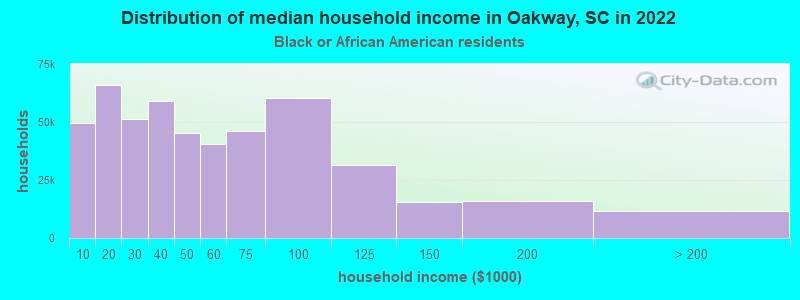
- $54,631Black householders
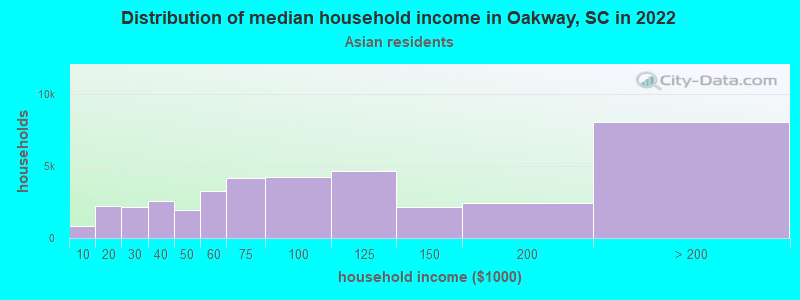
- $10,230Asian householders
- $22,126Some other race householders
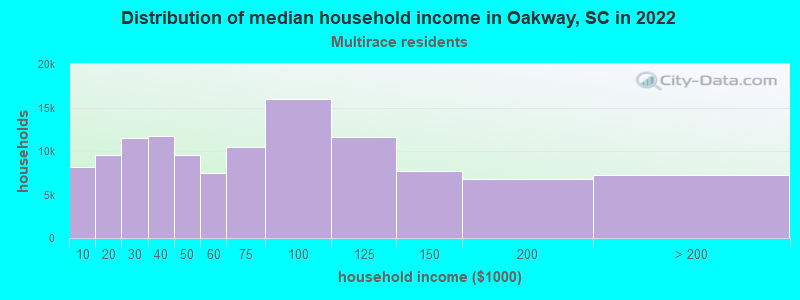
- $91,768Two or more races householders
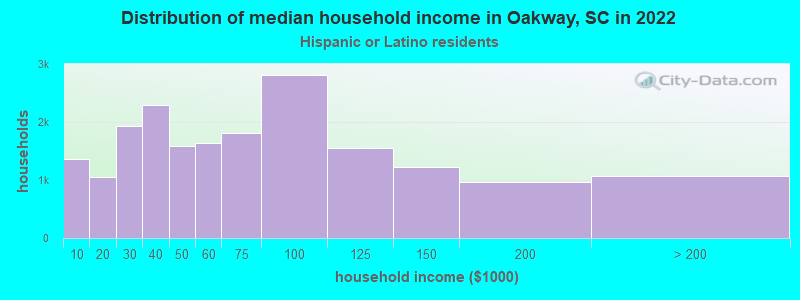
- $21,853Hispanic or Latino race householders
- Median 2022 house value
- $261,629White Non-Hispanic householders
- $395,608Black or African American householders
- $197,804American Indian or Alaska Native householders
- $197,804Asian householders
Household income for White non-Hispanic householders
Household income for Black householders
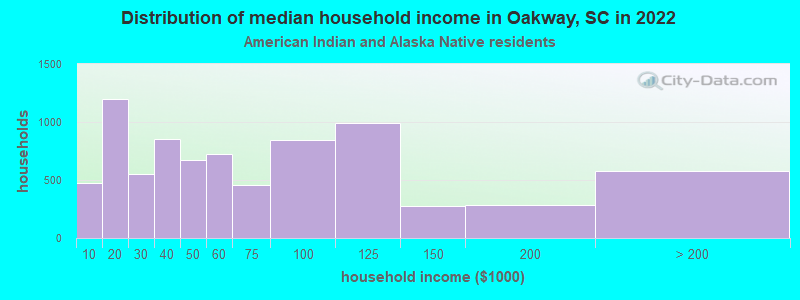
Household income for American Indian and Alaska Native householders
Household income for Asian householders
Household income for Two or more races householders
Household income for Hispanic or Latino race householders
Zip code: 29693