Races in Oconomowoc, Wisconsin (WI) Detailed Stats
Ancestries, Foreign-born residents, place of birth
Settings
X


Recent posts about races in Oconomowoc, Wisconsin on our local forum with over 2,400,000 registered users:
 | Please help, moving to Hartland, WI or Oconomowoc, WI (10 replies) |
| Waukesha--What's it like? (89 replies) |
| How does Door County compare to New Hampshire? (54 replies) |
| Living in the Pewaukee Area of Wisconsin (8 replies) |
| Relocating to Milwaukee from South Florida (26 replies) |
| Questions about Living in Waukesha (10 replies) |
Latest news about races in Oconomowoc, WI collected exclusively by city-data.com from local newspapers, TV, and radio stations
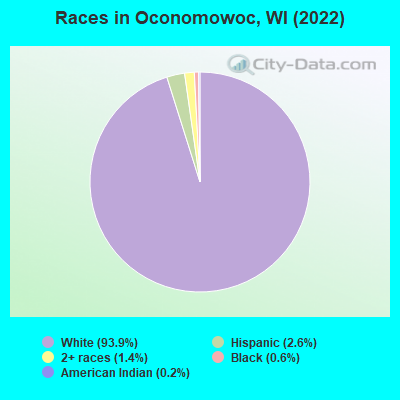
According to 2022 data, the most numerous races in Oconomowoc, WI are White alone (17,208 residents), Hispanic (477 residents), and Black alone (101 residents). 96.5% of Oconomowoc residents speak English at home. 2.3% of Oconomowoc, WI residents are foreign-born (0.9% born in Europe, 0.7% born in Latin America, 0.3% born in Asia, 0.3% born in Africa), which is 117.0% less than the foreign-born rate of 5.0% across the entire state of Wisconsin.
Race distribution in Oconomowoc
2000
2022

- 11,97596.7%White alone
- 2041.6%Hispanic
- 580.5%Two or more races
- 650.5%Asian alone
- 370.3%Black alone
- 330.3%American Indian alone
- 90.07%Other race alone
- 10.01%Native Hawaiian and Other
Pacific Islander alone

-
- 17,20893.9%White alone
- 4772.6%Hispanic
- 2581.4%Two or more races
- 1010.6%Black alone
- 360.2%American Indian alone
- 170.09%Asian alone
- 170.09%Other race alone
2000
2022
-
- 4,681,63087.3%White alone
- 300,2455.6%Black alone
- 192,9213.6%Hispanic
- 87,9951.6%Asian alone
- 51,9211.0%Two or more races
- 43,9800.8%American Indian alone
- 3,6370.07%Other race alone
- 1,3460.03%Native Hawaiian and Other
Pacific Islander alone

-
- 4,654,03179.0%White alone
- 447,0227.6%Hispanic
- 345,6785.9%Black alone
- 217,5323.7%Two or more races
- 172,2422.9%Asian alone
- 33,7620.6%American Indian alone
- 19,6800.3%Other race alone
- 2,5920.04%Native Hawaiian and Other
Pacific Islander alone

Income and house value in Oconomowoc
- Median household income in 2022
- $101,124White non-Hispanic householders
- $14,270Black householders
- $78,289Two or more races householders
- Median 2022 house value
- $364,501White Non-Hispanic householders
- $276,696Black or African American householders
- $362,780American Indian or Alaska Native householders
- $276,696Asian householders
- $338,184Two or more races householders
- $338,184Hispanic or Latino householders
Household income for White non-Hispanic householders

Household income for Black householders

Household income for Two or more races householders

Household income for Hispanic or Latino race householders

Median age by race in Oconomowoc
- 42.9Median age for White residents
- 41.2Males
- 46.4Females
- 34.5Median age for Black or African American residents
- 27.3Males
- 33.8Females
- 62.3Median age for American Indian / Alaska Native residents
- -1,272,916,665.4Males
- -689,393,938.7Females
- 16.7Median age for Asian residents
- -685,185,184.5Males
- -716,805,941.7Females
- -825,688,072.6Median age for Native Hawaiian / Pacific Islander residents
- -862,745,097.2Males
- -666,666,666.0Females
- 40.4Median age for Other race residents
- -672,116,257.3Males
- -668,202,764.3Females
- 18.6Median age for Two or more races residents
- 21.5Males
- 21.0Females
- 43.9Median age for White alone residents
- 41.3Males
- 47.2Females
- 19.5Median age for Hispanic or Latino residents
- 17.6Males
- 21.9Females
Owner/renter occupied households by race in Oconomowoc
- House owners and renters - White residents
- 5,26370.2%Owner occupied
- 2,23129.8%Renter occupied
- House owners and renters - Black or African American residents
- 11.4%Owner occupied
- 8398.6%Renter occupied
- House owners and renters - American Indian / Alaska Native residents
- 19100.0%Owner occupied
- House owners and renters - Other race residents
- 18100.0%Owner occupied
- House owners and renters - Two or more races residents
- 1840.3%Owner occupied
- 2659.7%Renter occupied
- House owners and renters - White alone residents
- 5,19370.1%Owner occupied
- 2,21729.9%Renter occupied
- House owners and renters - Hispanic or Latino residents
- 6553.5%Owner occupied
- 5646.5%Renter occupied
Language usage in Oconomowoc
- English speakers - Total
- 96.5% of residents of Oconomowoc speak English at home.
- 0.4% of residents speak Spanish at home
- 2938.2%Speak English very well
- 4761.8%Speak English less than very well
- 3.1% of residents speak other language at home
- 41977.9%Speak English very well
- 11922.1%Speak English less than very well
- English speakers - Born in the United States
- 95.6% of residents of Oconomowoc speak English at home.
- 0.7% of residents speak Spanish at home
- 25100.0%Speak English very well
- 4.7% of residents speak other language at home
- 13273.7%Speak English very well
- 4726.3%Speak English less than very well
All residents speak only English at home
- English speakers - Foreign-born
- 38.8% of residents of Oconomowoc speak English at home.
- 63.8% of residents speak other language at home
- 22985.4%Speak English very well
- 3914.6%Speak English less than very well
White (Caucasian) - Speak only English
| Native: | 98.0% (15,866) |
| Foreign-born: | 34.9% (111) |
White (Caucasian) - Speak another language
| Native: | 2.0% (330) |
| Foreign-born: | 64.9% (207) |
Asian - Speak only English
| Native: | 100.0% (2) |
| Foreign-born: | 89.1% (14) |
Two or more races - Speak only English
| Native: | 100.0% (378) |
| Foreign-born: | 100.0% (13) |
White alone - Speak only English
| Native: | 97.9% (15,693) |
| Foreign-born: | 23.6% (77) |
White alone - Speak another language
| Native: | 2.1% (343) |
| Foreign-born: | 78.9% (257) |
Hispanic or Latino - Speak only English
| Native: | 97.0% (364) |
| Foreign-born: | 99.4% (42) |
Foreign-born residents in Oconomowoc
422 residents are foreign born (0.9% Europe, 0.7% Latin America, 0.3% Asia, 0.3% Africa).
| This city: | 2.3% |
| Wisconsin: | 5.0% |


Marital status for residents in Oconomowoc
Marital status - White (Caucasian) population 15 years and over
- Males
- 28.9%Never married
- 58.6%Now married
- 1.6%Separated
- 3.0%Widowed
- 7.9%Divorced
- Females
- 23.0%Never married
- 53.6%Now married
- 0.2%Separated
- 9.9%Widowed
- 13.3%Divorced
Women who gave birth in the past 12 months
| Now married: | 65.3% (74) |
| Unmarried: | 34.7% (39) |
Women who did not give birth in the past 12 months
| Now married: | 49.3% (1,644) |
| Unmarried: | 50.7% (1,690) |
Marital status - Black or African American population 15 years and over
- Males
- 61.4%Never married
- 31.6%Now married
- 0.0%Separated
- 0.0%Widowed
- 7.0%Divorced
- Females
- 3.7%Never married
- 1.9%Now married
- 92.6%Separated
- 1.9%Widowed
- 0.0%Divorced
Women who did not give birth in the past 12 months
| Now married: | 96.2% (49) |
| Unmarried: | 3.8% (2) |
Marital status - American Indian / Alaska Native population 15 years and over
- Males
- 0.0%Never married
- 0.0%Now married
- 0.0%Separated
- 0.0%Widowed
- 100.0%Divorced
- Females
- 0.0%Never married
- 45.5%Now married
- 0.0%Separated
- 54.5%Widowed
- 0.0%Divorced
Women who did not give birth in the past 12 months
| Now married: | 100.0% (9) |
| Unmarried: | 0.0% (0) |
Marital status - Asian population 15 years and over
- Males
- 100.0%Never married
- 0.0%Now married
- 0.0%Separated
- 0.0%Widowed
- 0.0%Divorced
- Females
- 77.8%Never married
- 22.2%Now married
- 0.0%Separated
- 0.0%Widowed
- 0.0%Divorced
Women who did not give birth in the past 12 months
| Now married: | 0.0% (0) |
| Unmarried: | 100.0% (8) |
Marital status - Other race population 15 years and over
- Males
- 37.5%Never married
- 62.5%Now married
- 0.0%Separated
- 0.0%Widowed
- 0.0%Divorced
- Females
- 100.0%Never married
- 0.0%Now married
- 0.0%Separated
- 0.0%Widowed
- 0.0%Divorced
Women who did not give birth in the past 12 months
| Now married: | 0.0% (0) |
| Unmarried: | 100.0% (5) |
Marital status - Two or more races population 15 years and over
- Males
- 64.9%Never married
- 29.7%Now married
- 0.0%Separated
- 0.0%Widowed
- 5.4%Divorced
- Females
- 78.6%Never married
- 12.7%Now married
- 0.0%Separated
- 4.8%Widowed
- 4.0%Divorced
Women who did not give birth in the past 12 months
| Now married: | 4.6% (6) |
| Unmarried: | 95.4% (130) |
Marital status - White alone, not Hispanic / Latino population 15 years and over
- Males
- 28.6%Never married
- 58.8%Now married
- 1.6%Separated
- 3.0%Widowed
- 8.0%Divorced
- Females
- 23.1%Never married
- 53.1%Now married
- 0.2%Separated
- 10.1%Widowed
- 13.5%Divorced
Women who gave birth in the past 12 months
| Now married: | 61.0% (62) |
| Unmarried: | 39.0% (40) |
Women who did not give birth in the past 12 months
| Now married: | 48.6% (1,611) |
| Unmarried: | 51.4% (1,702) |
Marital status - Hispanic or Latino population 15 years and over
- Males
- 68.8%Never married
- 31.2%Now married
- 0.0%Separated
- 0.0%Widowed
- 0.0%Divorced
- Females
- 44.0%Never married
- 55.4%Now married
- 0.0%Separated
- 0.0%Widowed
- 0.6%Divorced
Women who gave birth in the past 12 months
| Now married: | 100.0% (12) |
| Unmarried: | 0.0% (0) |
Women who did not give birth in the past 12 months
| Now married: | 46.7% (61) |
| Unmarried: | 53.3% (70) |
Ancestries in Oconomowoc

- 3,77350.0%German
- 5216.9%Polish
- 4305.7%Irish
- 4055.4%Norwegian
- 3724.9%English
- 3364.5%European
- 2483.3%American
- 1181.6%Italian
- 731.0%Finnish
- 690.9%Scottish
- 630.8%Brazilian
- 630.8%Swedish
- 600.8%Scandinavian
- 520.7%Greek
- 470.6%Croatian
- 450.6%French
- 430.6%Eastern European
- 340.5%French Canadian
- 320.4%Dutch
- 260.3%Hungarian
- 220.3%Lithuanian
- 150.2%Russian
- 150.2%Serbian
- 130.2%Latvian
- 130.2%Czech
- 130.2%Iranian
- 120.2%Welsh
- 80.1%Scotch-Irish
- 80.1%British
- 60.08%Northern European
- 60.08%Slovene
- 40.05%African
- 10.01%Austrian

Geographical mobility in Oconomowoc

- Same house 1 year ago
- 15,24187.6%White (Caucasian)
- 5853.6%Black or African American
- 41100.0%American Indian / Alaska Native
- 1690.6%Asian
- 1469.8%Other race
- 34993.3%Two or more races
- 15,03087.5%White alone, not Hispanic / Latino
- 43794.1%Hispanic or Latino

-
- Moved within same county
- 1,4248.2%White / Caucasian
- 16.0%Asian
- 527.6%Other race
- 369.5%Two or more races
- 1,4278.3%White alone, not Hispanic / Latino
- 92.0%Hispanic or Latino

-
- Moved within same state
- 4622.7%White / Caucasian
- 5147.6%Black or African American
- 4702.7%White alone, not Hispanic / Latino

-
- Moved from different state
- 2831.6%White / Caucasian
- 2681.6%White alone, not Hispanic / Latino
- 143.0%Hispanic or Latino

-
- Moved from abroad
- 670.4%White
- 520.3%White alone, not Hispanic / Latino

Children Nativity (place of birth) in Oconomowoc
Place of birth for residents in Oconomowoc
![Place of birth for the foreign-born population - Regions]()
- 172Europe
- 147Americas
- 125Latin America
- 122South America
- 86Western Europe
- 50Asia
- 50Africa
- 50Southern Africa
- 31Northern Europe
- 29Eastern Europe
- 26South Central Asia
- 23Southern Europe
- 23Western Asia
- 21Northern America
- 2Caribbean

![Place of birth for the foreign-born population - Countries]()
- 86Germany
- 71Brazil
- 50South Africa
- 50Colombia
- 29Russia
- 23United Kingdom
- 23Greece
- 21Canada
- 14Kazakhstan
- 11Iran
- 7England
- 2Cuba

Grandparents responsible for own grandchildren in Oconomowoc
Zip codes: 53066.