Races in Odessa, Florida (FL) Detailed Stats
Data:
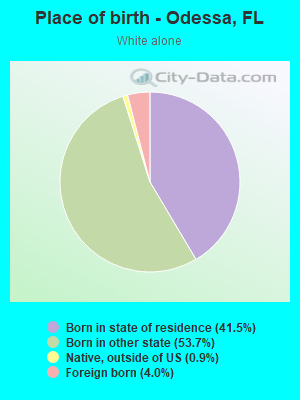
Races - White alone (%)
Races - White alone (% change since 2000)
Races - Black alone (%)
Races - Black alone (% change since 2000)
Races - American Indian alone (%)
Races - American Indian alone (% change since 2000)
Races - Asian alone (%)
Races - Asian alone (% change since 2000)
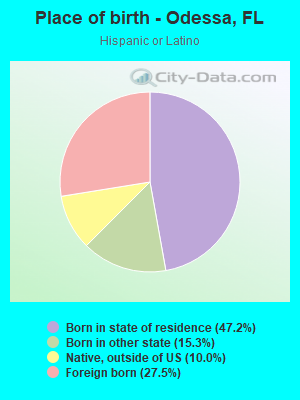
Races - Hispanic (%)
Races - Hispanic (% change since 2000)
Races - Native Hawaiian and Other Pacific Islander alone (%)
Races - Native Hawaiian and Other Pacific Islander alone (% change since 2000)
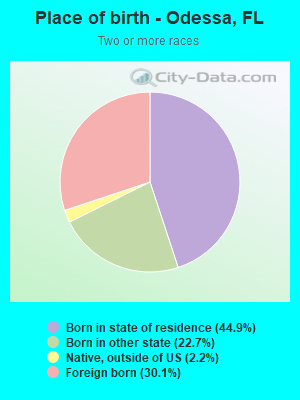
Races - Two or more races(%)
Races - Two or more races(% change since 2000)
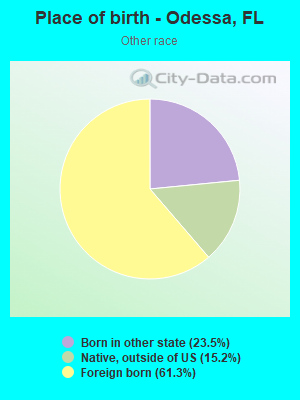
Races - Other race alone (%)
Races - Other race alone (% change since 2000)
Racial diversity
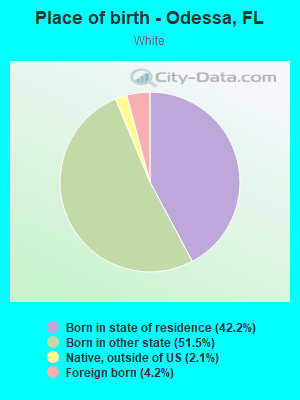
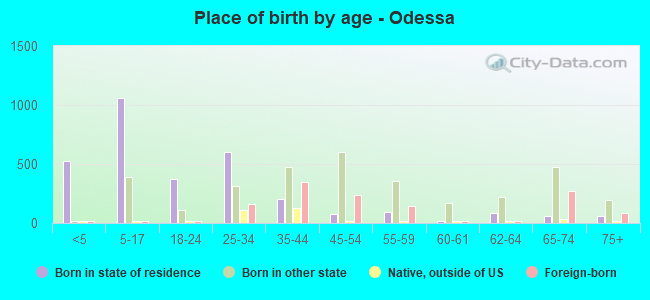
Place of birth - Born in state of residence (%)
Place of birth - Born in state of residence (%) - White
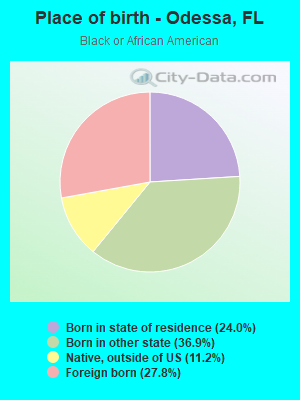
Place of birth - Born in state of residence (%) - Black or African American
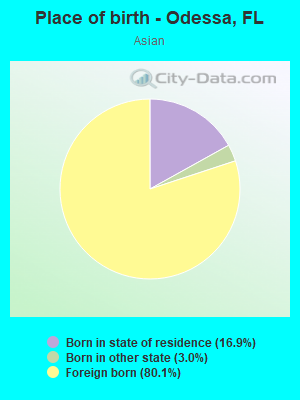
Place of birth - Born in state of residence (%) - Asian
Place of birth - Born in state of residence (%) - Hispanic or Latino
Place of birth - Born in state of residence (%) - American Indian and Alaska Native
Place of birth - Born in state of residence (%) - Multirace
Place of birth - Born in state of residence (%) - Other Race
Place of birth - Born in other state (%)
Place of birth - Born in other state (%) - White
Place of birth - Born in other state (%) - Black or African American
Place of birth - Born in other state (%) - Asian
Place of birth - Born in other state (%) - Hispanic or Latino
Place of birth - Born in other state (%) - American Indian and Alaska Native
Place of birth - Born in other state (%) - Multirace
Place of birth - Born in other state (%) - Other Race
Place of birth - Native, outside of US (%)
Place of birth - Native, outside of US (%) - White
Place of birth - Native, outside of US (%) - Black or African American
Place of birth - Native, outside of US (%) - Asian
Place of birth - Native, outside of US (%) - Hispanic or Latino
Place of birth - Native, outside of US (%) - American Indian and Alaska Native
Place of birth - Native, outside of US (%) - Multirace
Place of birth - Native, outside of US (%) - Other Race
Place of birth - Foreign born (%)
Place of birth - Foreign born (%) - White
Place of birth - Foreign born (%) - Black or African American
Place of birth - Foreign born (%) - Asian
Place of birth - Foreign born (%) - Hispanic or Latino
Place of birth - Foreign born (%) - American Indian and Alaska Native
Place of birth - Foreign born (%) - Multirace
Place of birth - Foreign born (%) - Other Race
Residents speaking English at home (%)
Residents speaking English at home - Born in the United States (%)
Residents speaking English at home - Native, born elsewhere (%)
Residents speaking English at home - Foreign born (%)
Residents speaking Spanish at home (%)
Residents speaking Spanish at home - Born in the United States (%)
Residents speaking Spanish at home - Native, born elsewhere (%)
Residents speaking Spanish at home - Foreign born (%)
Residents speaking other language at home (%)
Residents speaking other language at home - Born in the United States (%)
Residents speaking other language at home - Native, born elsewhere (%)
Residents speaking other language at home - Foreign born (%)
Marital status - Never married (%)
Marital status - Now married (%)
Marital status - Separated (%)
Marital status - Widowed (%)
Marital status - Divorced (%)
Ancestries Reported - Arab (%)
Ancestries Reported - Czech (%)
Ancestries Reported - Danish (%)
Ancestries Reported - Dutch (%)
Ancestries Reported - English (%)
Ancestries Reported - French (%)
Ancestries Reported - French Canadian (%)
Ancestries Reported - German (%)
Ancestries Reported - Greek (%)
Ancestries Reported - Hungarian (%)
Ancestries Reported - Irish (%)
Ancestries Reported - Italian (%)
Ancestries Reported - Lithuanian (%)
Ancestries Reported - Norwegian (%)
Ancestries Reported - Polish (%)
Ancestries Reported - Portuguese (%)
Ancestries Reported - Russian (%)
Ancestries Reported - Scotch-Irish (%)
Ancestries Reported - Scottish (%)
Ancestries Reported - Slovak (%)
Ancestries Reported - Subsaharan African (%)
Ancestries Reported - Swedish (%)
Ancestries Reported - Swiss (%)
Ancestries Reported - Ukrainian (%)
Ancestries Reported - United States (%)
Ancestries Reported - Welsh (%)
Ancestries Reported - West Indian (%)
Ancestries Reported - Other (%)
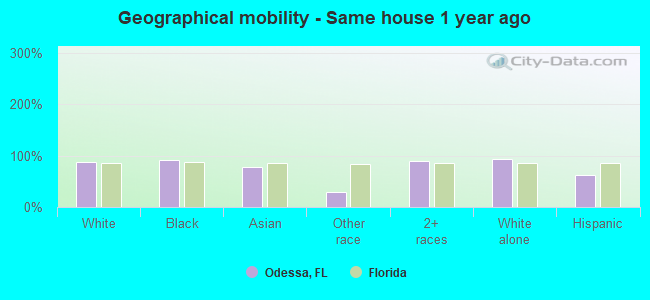
Geographical mobility - Same house 1 year ago (%)
Geographical mobility - Same house 1 year ago (%) - White
Geographical mobility - Same house 1 year ago (%) - Black or African American
Geographical mobility - Same house 1 year ago (%) - Asian
Geographical mobility - Same house 1 year ago (%) - Hispanic or Latino
Geographical mobility - Same house 1 year ago (%) - American Indian and Alaska Native
Geographical mobility - Same house 1 year ago (%) - Multirace
Geographical mobility - Same house 1 year ago (%) - Other Race
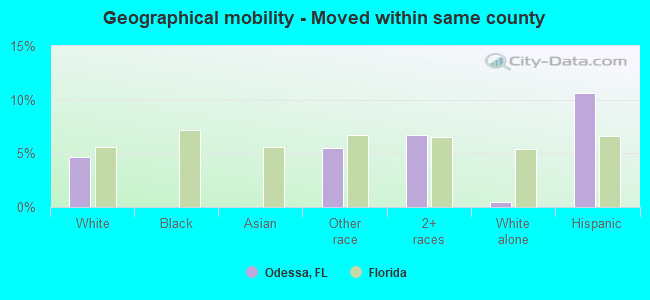
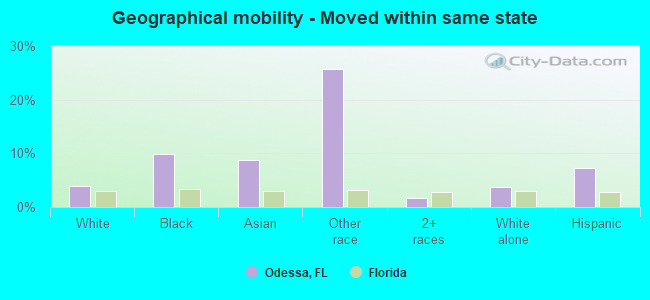
Geographical mobility - Moved within same county (%)
Geographical mobility - Moved within same county (%) - White
Geographical mobility - Moved within same county (%) - Black or African American
Geographical mobility - Moved within same county (%) - Asian
Geographical mobility - Moved within same county (%) - Hispanic or Latino
Geographical mobility - Moved within same county (%) - American Indian and Alaska Native
Geographical mobility - Moved within same county (%) - Multirace
Geographical mobility - Moved within same county (%) - Other Race
Geographical mobility - Moved from different county within same state (%)
Geographical mobility - Moved from different county within same state (%) - White
Geographical mobility - Moved from different county within same state (%) - Black or African American
Geographical mobility - Moved from different county within same state (%) - Asian
Geographical mobility - Moved from different county within same state (%) - Hispanic or Latino
Geographical mobility - Moved from different county within same state (%) - American Indian and Alaska Native
Geographical mobility - Moved from different county within same state (%) - Multirace
Geographical mobility - Moved from different county within same state (%) - Other Race
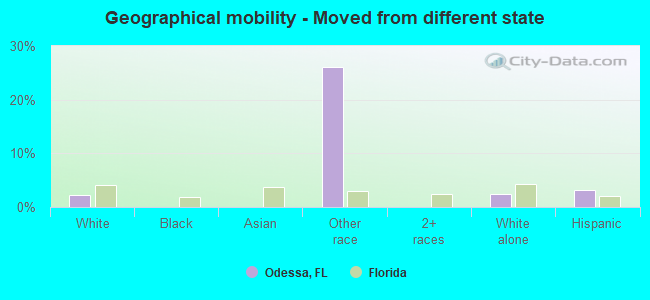
Geographical mobility - Moved from different state (%)
Geographical mobility - Moved from different state (%) - White
Geographical mobility - Moved from different state (%) - Black or African American
Geographical mobility - Moved from different state (%) - Asian
Geographical mobility - Moved from different state (%) - Hispanic or Latino
Geographical mobility - Moved from different state (%) - American Indian and Alaska Native
Geographical mobility - Moved from different state (%) - Multirace
Geographical mobility - Moved from different state (%) - Other Race
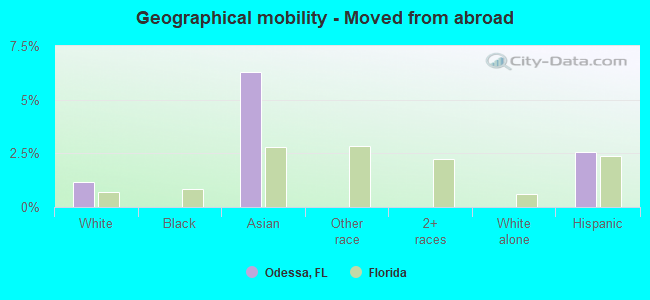
Geographical mobility - Moved from abroad (%)
Geographical mobility - Moved from abroad (%) - White
Geographical mobility - Moved from abroad (%) - Black or African American
Geographical mobility - Moved from abroad (%) - Asian
Geographical mobility - Moved from abroad (%) - Hispanic or Latino
Geographical mobility - Moved from abroad (%) - American Indian and Alaska Native
Geographical mobility - Moved from abroad (%) - Multirace
Geographical mobility - Moved from abroad (%) - Other Race
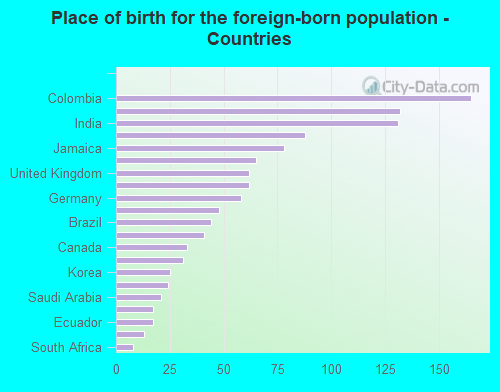
Place of birth for the foreign-born population - Ireland (%)
Place of birth for the foreign-born population - Denmark (%)
Place of birth for the foreign-born population - Norway (%)
Place of birth for the foreign-born population - Sweden (%)
Place of birth for the foreign-born population - United Kingdom (%)
Place of birth for the foreign-born population - England (%)
Place of birth for the foreign-born population - Scotland (%)
Place of birth for the foreign-born population - Other Northern Europe (%)
Place of birth for the foreign-born population - Austria (%)
Place of birth for the foreign-born population - Belgium (%)
Place of birth for the foreign-born population - France (%)
Place of birth for the foreign-born population - Germany (%)
Place of birth for the foreign-born population - Netherlands (%)
Place of birth for the foreign-born population - Switzerland (%)
Place of birth for the foreign-born population - Other Western Europe (%)
Place of birth for the foreign-born population - Greece (%)
Place of birth for the foreign-born population - Italy (%)
Place of birth for the foreign-born population - Portugal (%)
Place of birth for the foreign-born population - Spain (%)
Place of birth for the foreign-born population - Other Southern Europe (%)
Place of birth for the foreign-born population - Albania (%)
Place of birth for the foreign-born population - Belarus (%)
Place of birth for the foreign-born population - Bosnia and Herzegovina (%)
Place of birth for the foreign-born population - Bulgaria (%)
Place of birth for the foreign-born population - Croatia (%)
Place of birth for the foreign-born population - Czechoslovakia (%)
Place of birth for the foreign-born population - Hungary (%)
Place of birth for the foreign-born population - Latvia (%)
Place of birth for the foreign-born population - Lithuania (%)
Place of birth for the foreign-born population - North Macedonia (Macedonia) (%)
Place of birth for the foreign-born population - Moldova (%)
Place of birth for the foreign-born population - Poland (%)
Place of birth for the foreign-born population - Romania (%)
Place of birth for the foreign-born population - Russia (%)
Place of birth for the foreign-born population - Serbia (%)
Place of birth for the foreign-born population - Ukraine (%)
Place of birth for the foreign-born population - Other Eastern Europe (%)
Place of birth for the foreign-born population - China (%)
Place of birth for the foreign-born population - Hong Kong (%)
Place of birth for the foreign-born population - Taiwan (%)
Place of birth for the foreign-born population - Japan (%)
Place of birth for the foreign-born population - Korea (%)
Place of birth for the foreign-born population - Other Eastern Asia (%)
Place of birth for the foreign-born population - Afghanistan (%)
Place of birth for the foreign-born population - Bangladesh (%)
Place of birth for the foreign-born population - India (%)
Place of birth for the foreign-born population - Iran (%)
Place of birth for the foreign-born population - Kazakhstan (%)
Place of birth for the foreign-born population - Nepal (%)
Place of birth for the foreign-born population - Pakistan (%)
Place of birth for the foreign-born population - Sri Lanka (%)
Place of birth for the foreign-born population - Uzbekistan (%)
Place of birth for the foreign-born population - Other South Central Asia (%)
Place of birth for the foreign-born population - Burma (%)
Place of birth for the foreign-born population - Cambodia (%)
Place of birth for the foreign-born population - Indonesia (%)
Place of birth for the foreign-born population - Laos (%)
Place of birth for the foreign-born population - Malaysia (%)
Place of birth for the foreign-born population - Philippines (%)
Place of birth for the foreign-born population - Singapore (%)
Place of birth for the foreign-born population - Thailand (%)
Place of birth for the foreign-born population - Vietnam (%)
Place of birth for the foreign-born population - Other South Eastern Asia (%)
Place of birth for the foreign-born population - Armenia (%)
Place of birth for the foreign-born population - Iraq (%)
Place of birth for the foreign-born population - Israel (%)
Place of birth for the foreign-born population - Jordan (%)
Place of birth for the foreign-born population - Kuwait (%)
Place of birth for the foreign-born population - Lebanon (%)
Place of birth for the foreign-born population - Saudi Arabia (%)
Place of birth for the foreign-born population - Syria (%)
Place of birth for the foreign-born population - Turkey (%)
Place of birth for the foreign-born population - Yemen (%)
Place of birth for the foreign-born population - Other Western Asia (%)
Place of birth for the foreign-born population - Eritrea (%)
Place of birth for the foreign-born population - Ethiopia (%)
Place of birth for the foreign-born population - Kenya (%)
Place of birth for the foreign-born population - Somalia (%)
Place of birth for the foreign-born population - Uganda (%)
Place of birth for the foreign-born population - Zimbabwe (%)
Place of birth for the foreign-born population - Other Eastern Africa (%)
Place of birth for the foreign-born population - Cameroon (%)
Place of birth for the foreign-born population - Congo (%)
Place of birth for the foreign-born population - Democratic Republic of Congo (Zaire) (%)
Place of birth for the foreign-born population - Other Middle Africa (%)
Place of birth for the foreign-born population - Egypt (%)
Place of birth for the foreign-born population - Morocco (%)
Place of birth for the foreign-born population - Sudan (%)
Place of birth for the foreign-born population - Other Northern Africa (%)
Place of birth for the foreign-born population - South Africa (%)
Place of birth for the foreign-born population - Other Southern Africa (%)
Place of birth for the foreign-born population - Cabo Verde (%)
Place of birth for the foreign-born population - Ghana (%)
Place of birth for the foreign-born population - Liberia (%)
Place of birth for the foreign-born population - Nigeria (%)
Place of birth for the foreign-born population - Senegal (%)
Place of birth for the foreign-born population - Sierra Leone (%)
Place of birth for the foreign-born population - Other Western Africa (%)
Place of birth for the foreign-born population - Australia (%)
Place of birth for the foreign-born population - New Zealand (%)
Place of birth for the foreign-born population - Fiji (%)
Place of birth for the foreign-born population - Micronesia (%)
Place of birth for the foreign-born population - Bahamas (%)
Place of birth for the foreign-born population - Barbados (%)
Place of birth for the foreign-born population - Cuba (%)
Place of birth for the foreign-born population - Dominica (%)
Place of birth for the foreign-born population - Dominican Republic (%)
Place of birth for the foreign-born population - Grenada (%)
Place of birth for the foreign-born population - Haiti (%)
Place of birth for the foreign-born population - Jamaica (%)
Place of birth for the foreign-born population - St. Vincent and the Grenadines (%)
Place of birth for the foreign-born population - Trinidad and Tobago (%)
Place of birth for the foreign-born population - West Indies (%)
Place of birth for the foreign-born population - Other Caribbean (%)
Place of birth for the foreign-born population - Belize (%)
Place of birth for the foreign-born population - Costa Rica (%)
Place of birth for the foreign-born population - El Salvador (%)
Place of birth for the foreign-born population - Guatemala (%)
Place of birth for the foreign-born population - Honduras (%)
Place of birth for the foreign-born population - Mexico (%)
Place of birth for the foreign-born population - Nicaragua (%)
Place of birth for the foreign-born population - Panama (%)
Place of birth for the foreign-born population - Other Central America (%)
Place of birth for the foreign-born population - Argentina (%)
Place of birth for the foreign-born population - Bolivia (%)
Place of birth for the foreign-born population - Brazil (%)
Place of birth for the foreign-born population - Chile (%)
Place of birth for the foreign-born population - Colombia (%)
Place of birth for the foreign-born population - Ecuador (%)
Place of birth for the foreign-born population - Guyana (%)
Place of birth for the foreign-born population - Peru (%)
Place of birth for the foreign-born population - Uruguay (%)
Place of birth for the foreign-born population - Venezuela (%)
Place of birth for the foreign-born population - Other South America (%)
Place of birth for the foreign-born population - Canada (%)
Place of birth for the foreign-born population - Other Northern America (%)
Place of birth for the foreign-born population - Other (%)
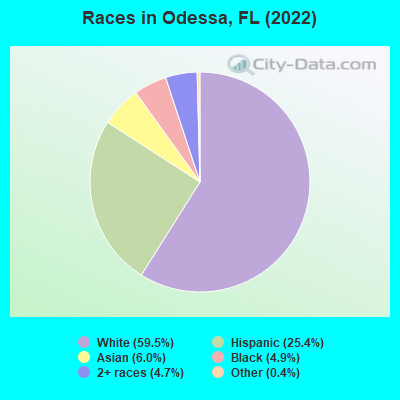
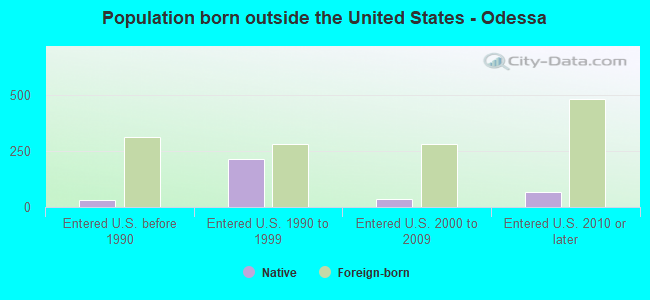
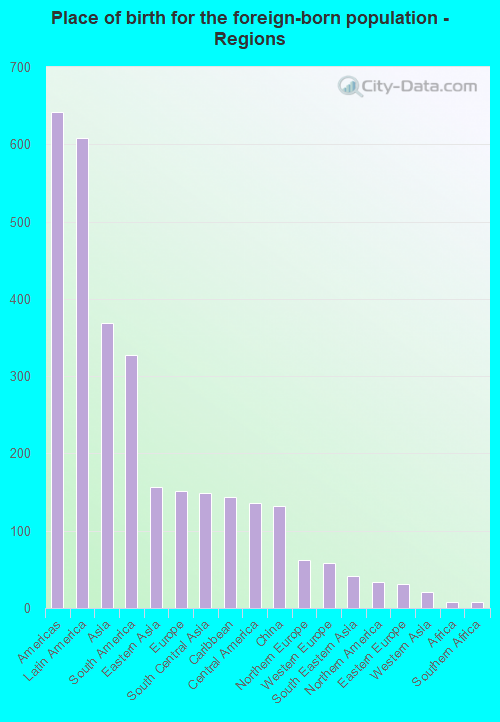
According to 2022 data, the most numerous races in Odessa, FL are White alone (4,800 residents), Hispanic (2,044 residents), and Black alone (395 residents). 76.2% of Odessa residents speak English at home. 14.5% of Odessa, FL residents are foreign-born (7.7% born in Latin America, 4.7% born in Asia, 1.9% born in Europe), which is 44.3% less than the foreign-born rate of 21.0% across the entire state of Florida.
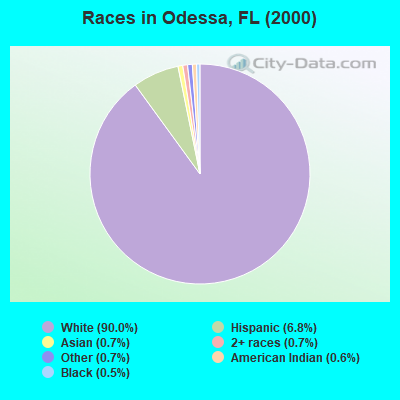
Race distribution in Odessa
2000 2022
10,458,509 65.4% White alone 2,682,715 16.8% Hispanic 2,264,268 14.2% Black alone 261,693 1.6% Asian alone 236,954 1.5% Two or more races 42,358 0.3% American Indian alone 28,994 0.2% Other race alone 6,887 0.04% Native Hawaiian and Other
11,309,403 50.8% White alone 6,025,039 27.1% Hispanic 3,241,015 14.6% Black alone 861,630 3.9% Two or more races 623,692 2.8% Asian alone 152,054 0.7% Other race alone 22,504 0.1% American Indian alone 9,486 0.04% Native Hawaiian and Other
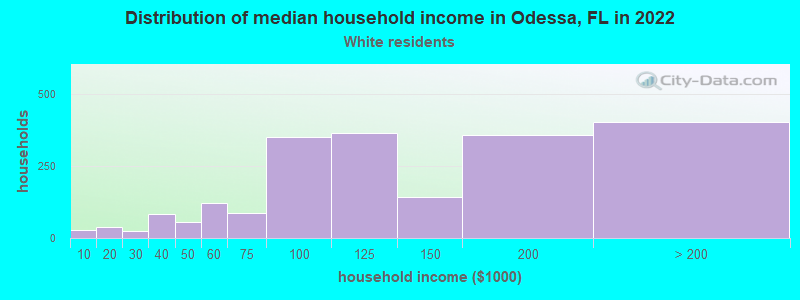
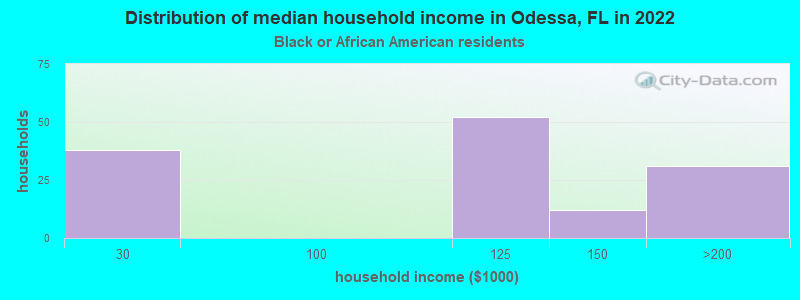
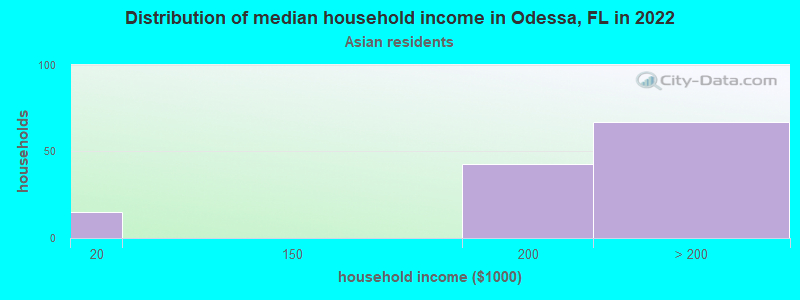
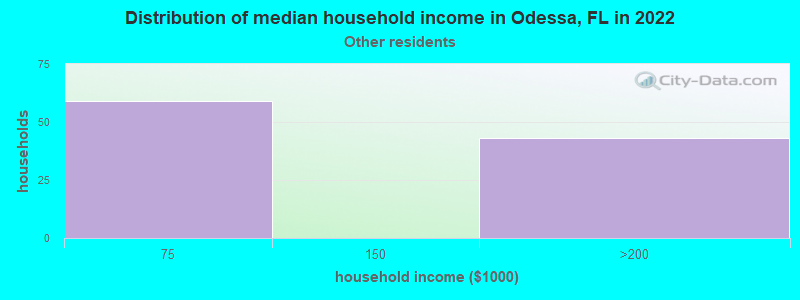
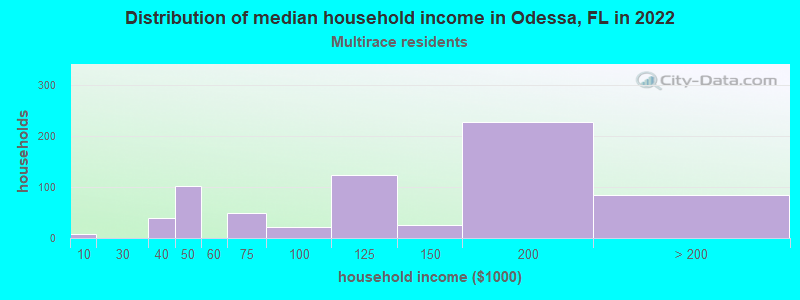
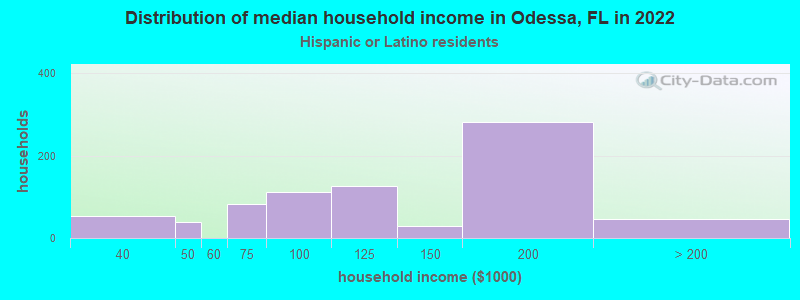
Income and house value in Odessa Median household income in 2022 $117,144 White non-Hispanic householdersover $200,000 Asian householders$131,889 Two or more races householders$118,023 Hispanic or Latino race householdersMedian 2022 house value $823,055 White Non-Hispanic householders$232,764 Black or African American householders $403,458 Asian householders$786,434 Hispanic or Latino householders
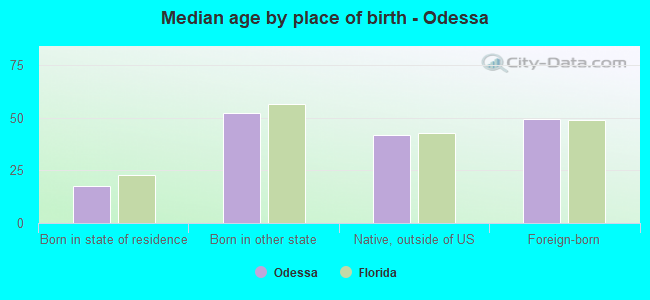
Median age by race in Odessa
39.3 Median age for White residents38.8 41.0 41.3 Median age for Black or African American residents41.2 20.4 -513,238,288.7 Median age for American Indian / Alaska Native residents-769,874,476.2 -501,002,003.5 48.7 Median age for Asian residents32.9 51.2 -835,555,554.7 Median age for Native Hawaiian / Pacific Islander residents-858,307,848.3 -444,051,825.2 36.0 Median age for Other race residents-766,478,342.0 33.3 34.3 Median age for Two or more races residents26.4 45.0 40.1 Median age for White alone residents37.6 42.5 32.3 Median age for Hispanic or Latino residents19.8 35.6
Owner/renter occupied households by race in Odessa
House owners and renters - White residents 1,467 74.6% Owner occupied499 25.4% Renter occupiedHouse owners and renters - Black or African American residents 82 70.3% Owner occupied34 29.7% Renter occupiedHouse owners and renters - Asian residents 120 90.1% Owner occupied13 9.9% Renter occupiedHouse owners and renters - Other race residents 69 68.1% Owner occupied32 31.9% Renter occupiedHouse owners and renters - Two or more races residents 490 76.0% Owner occupied155 24.0% Renter occupiedHouse owners and renters - White alone residents 1,402 81.3% Owner occupied323 18.7% Renter occupiedHouse owners and renters - Hispanic or Latino residents 419 61.7% Owner occupied260 38.3% Renter occupied
Language usage in Odessa
English speakers - Total 76.2% of residents of Odessa speak English at home.
13.9% of residents speak Spanish at home 826 79.0% Speak English very well220 21.0% Speak English less than very well10.1% of residents speak other language at home 575 75.5% Speak English very well187 24.5% Speak English less than very well
English speakers - Born in the United States 90.5% of residents of Odessa speak English at home.
5.4% of residents speak Spanish at home 156 87.2% Speak English very well23 12.8% Speak English less than very well4.4% of residents speak other language at home 146 100.0% Speak English very well
English speakers - Native, born elsewhere 29.5% of residents of Odessa speak English at home.
63.4% of residents speak Spanish at home 144 77.0% Speak English very well43 23.0% Speak English less than very well6.1% of residents speak other language at home 18 100.0% Speak English very well
English speakers - Foreign-born 20.9% of residents of Odessa speak English at home.
32.3% of residents speak Spanish at home 307 71.2% Speak English very well124 28.8% Speak English less than very well47.0% of residents speak other language at home 441 70.4% Speak English very well185 29.6% Speak English less than very well
White (Caucasian) - Speak only English Native:
93.5% (4,325)Foreign-born:
54.3% (117)
White (Caucasian) - Speak another language Native:
5.9% (273)Foreign-born:
45.9% (99)
Black or African American - Speak only English Native:
89.6% (260)Foreign-born:
57.5% (73)
Black or African American - Speak another language Native:
11.0% (32)Foreign-born:
40.6% (51)
Asian - Speak only English Native:
100.0% (98)Foreign-born:
14.2% (56)
Asian - Speak another language Native:
10.2% (10)Foreign-born:
83.6% (327)
Other race - Speak another language Native:
72.8% (81)Foreign-born:
99.9% (180)
Two or more races - Speak only English Native:
68.0% (823)Foreign-born:
4.6% (26)
Two or more races - Speak another language Native:
30.7% (371)Foreign-born:
97.5% (557)
White alone - Speak only English Native:
95.6% (4,115)Foreign-born:
48.2% (93)
White alone - Speak another language Native:
4.4% (187)Foreign-born:
50.0% (96)
Hispanic or Latino - Speak only English Native:
53.2% (679)Foreign-born:
9.0% (51)
Hispanic or Latino - Speak another language Native:
46.4% (593)Foreign-born:
90.1% (506)
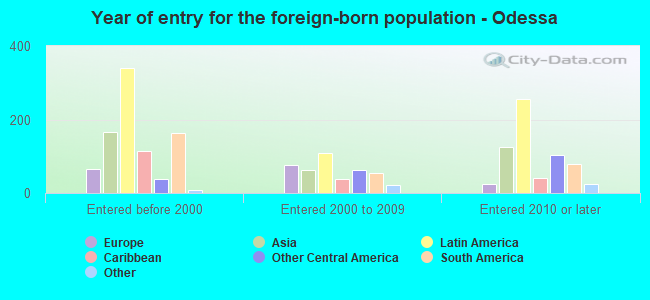
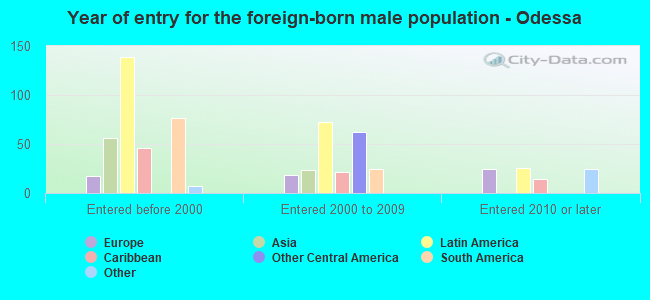
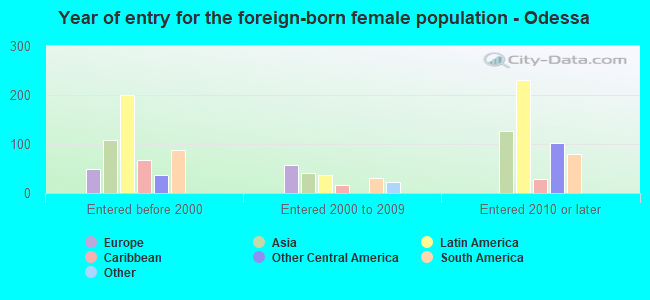
Foreign-born residents in Odessa 1,173 residents are foreign born (7.7% Latin America , 4.7% Asia , 1.9% Europe ).
This city:
14.5%Florida:
21.1%
Marital status for residents in Odessa Marital status - White (Caucasian) population 15 years and over
Males 25.1% Never married57.3% Now married5.5% Separated0.6% Widowed11.6% DivorcedFemales 23.6% Never married57.4% Now married0.6% Separated5.0% Widowed13.4% DivorcedWomen who gave birth in the past 12 months Now married:
100.0% (16)Unmarried:
0.0% (0)
Women who did not give birth in the past 12 months Now married:
45.6% (396)Unmarried:
54.4% (471)
Marital status - Black or African American population 15 years and over
Males 19.5% Never married57.7% Now married0.0% Separated0.0% Widowed22.8% DivorcedFemales 36.7% Never married44.6% Now married0.0% Separated18.7% Widowed0.0% DivorcedWomen who did not give birth in the past 12 months Now married:
45.7% (48)Unmarried:
54.3% (57)
Marital status - Asian population 15 years and over
Males 0.0% Never married70.7% Now married29.3% Separated0.0% Widowed0.0% DivorcedFemales 0.0% Never married62.9% Now married0.0% Separated10.8% Widowed26.2% DivorcedWomen who did not give birth in the past 12 months Now married:
100.0% (146)Unmarried:
0.0% (0)
Marital status - Other race population 15 years and over
Males 0.0% Never married100.0% Now married0.0% Separated0.0% Widowed0.0% DivorcedFemales 56.1% Never married28.8% Now married0.0% Separated0.0% Widowed15.1% DivorcedWomen who gave birth in the past 12 months Now married:
0.0% (0)Unmarried:
100.0% (105)
Women who did not give birth in the past 12 months Now married:
50.0% (71)Unmarried:
50.0% (71)
Marital status - Two or more races population 15 years and over
Males 50.8% Never married28.8% Now married0.0% Separated1.9% Widowed18.5% DivorcedFemales 7.4% Never married66.0% Now married5.0% Separated10.2% Widowed11.3% DivorcedWomen who gave birth in the past 12 months Now married:
100.0% (45)Unmarried:
0.0% (0)
Women who did not give birth in the past 12 months Now married:
85.9% (365)Unmarried:
14.1% (60)
Marital status - White alone, not Hispanic / Latino population 15 years and over
Males 25.8% Never married61.5% Now married1.5% Separated0.6% Widowed10.5% DivorcedFemales 23.8% Never married57.9% Now married0.7% Separated5.5% Widowed12.1% DivorcedWomen who gave birth in the past 12 months Now married:
100.0% (17)Unmarried:
0.0% (0)
Women who did not give birth in the past 12 months Now married:
48.4% (399)Unmarried:
51.6% (425)
Marital status - Hispanic or Latino population 15 years and over
Males 37.6% Never married28.2% Now married16.2% Separated0.0% Widowed18.0% DivorcedFemales 20.5% Never married59.9% Now married3.3% Separated6.7% Widowed9.6% DivorcedWomen who gave birth in the past 12 months Now married:
33.0% (34)Unmarried:
67.0% (68)
Women who did not give birth in the past 12 months Now married:
66.4% (326)Unmarried:
33.6% (165)
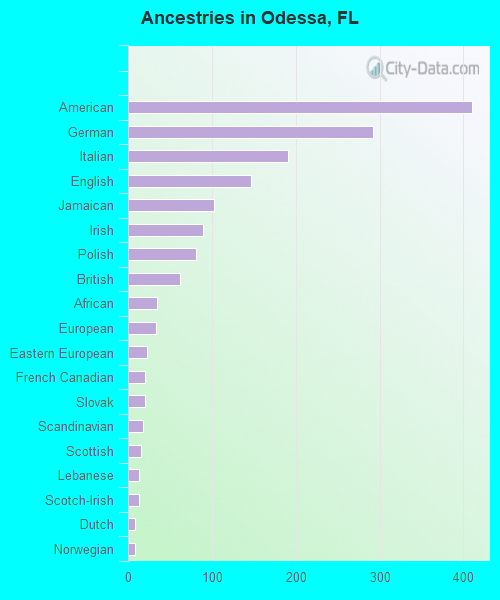
Ancestries in Odessa
410 13.3% American292 9.5% German191 6.2% Italian147 4.8% English102 3.3% Jamaican90 2.9% Irish81 2.6% Polish62 2.0% British34 1.1% African33 1.1% European23 0.7% Eastern European20 0.6% French Canadian20 0.6% Slovak18 0.6% Scandinavian15 0.5% Scottish13 0.4% Lebanese13 0.4% Scotch-Irish8 0.3% Dutch8 0.3% Norwegian
Children Nativity (place of birth) in Odessa
Children under 6 years - Living with two parents Both parents native 386 100.0% NativeBoth parents foreign-born 33 100.0% NativeOne native, one foreign-born parent 82 100.0% NativeChildren under 6 years - Living with one parent Native parent 150 100.0% NativeForeign-born parent 22 100.0% NativeChildren 6 to 17 years - Living with two parents Both parents native 802 99.7% Native2 0.3% Foreign-bornBoth parents foreign-born 181 88.8% Native23 11.2% Foreign-bornOne native, one foreign-born parent 89 100.0% NativeChildren 6 to 17 years - Living with one parent Native parent 145 100.0% NativeForeign-born parent 69 45.6% Native83 54.4% Foreign-born