Races in Odessa, Texas (TX) Detailed Stats
Data:
Races - White alone (%)
Races - White alone (% change since 2000)
Races - Black alone (%)
Races - Black alone (% change since 2000)
Races - American Indian alone (%)
Races - American Indian alone (% change since 2000)
Races - Asian alone (%)
Races - Asian alone (% change since 2000)
Races - Hispanic (%)
Races - Hispanic (% change since 2000)
Races - Native Hawaiian and Other Pacific Islander alone (%)
Races - Native Hawaiian and Other Pacific Islander alone (% change since 2000)
Races - Two or more races(%)
Races - Two or more races(% change since 2000)
Races - Other race alone (%)
Races - Other race alone (% change since 2000)
Racial diversity
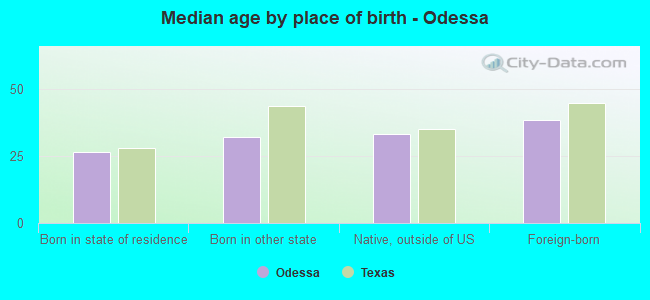
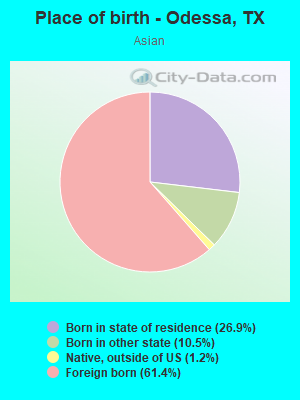
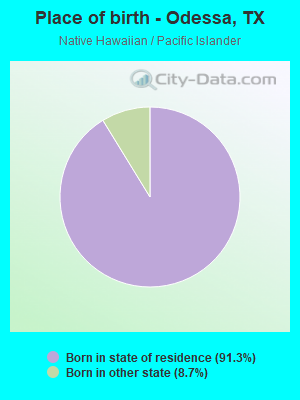
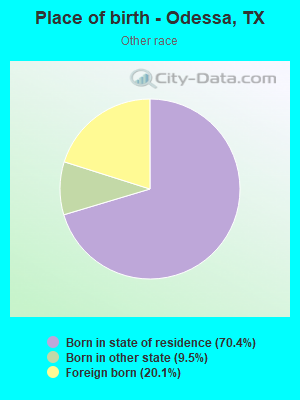
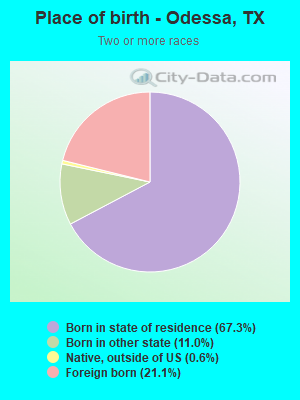
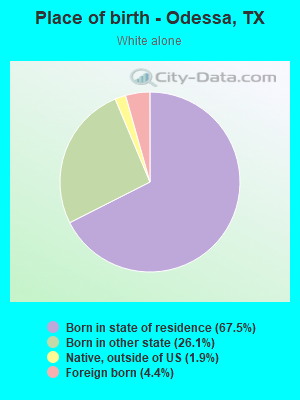
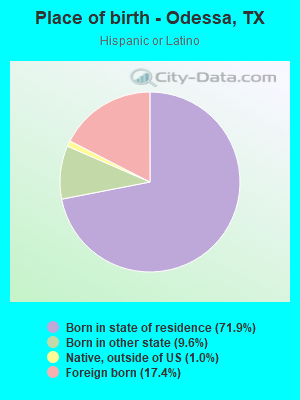
Place of birth - Born in state of residence (%)
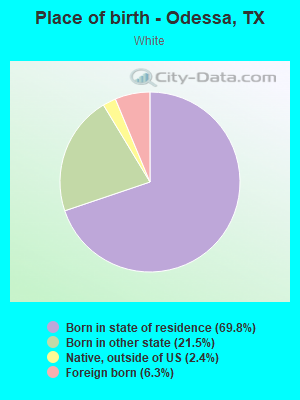
Place of birth - Born in state of residence (%) - White
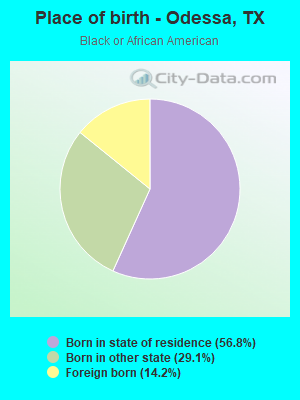
Place of birth - Born in state of residence (%) - Black or African American
Place of birth - Born in state of residence (%) - Asian
Place of birth - Born in state of residence (%) - Hispanic or Latino
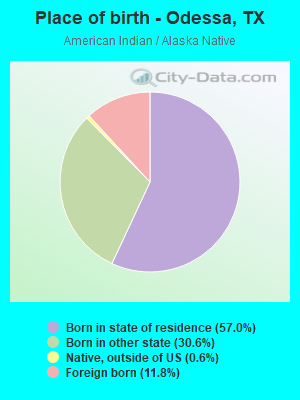
Place of birth - Born in state of residence (%) - American Indian and Alaska Native
Place of birth - Born in state of residence (%) - Multirace
Place of birth - Born in state of residence (%) - Other Race
Place of birth - Born in other state (%)
Place of birth - Born in other state (%) - White
Place of birth - Born in other state (%) - Black or African American
Place of birth - Born in other state (%) - Asian
Place of birth - Born in other state (%) - Hispanic or Latino
Place of birth - Born in other state (%) - American Indian and Alaska Native
Place of birth - Born in other state (%) - Multirace
Place of birth - Born in other state (%) - Other Race
Place of birth - Native, outside of US (%)
Place of birth - Native, outside of US (%) - White
Place of birth - Native, outside of US (%) - Black or African American
Place of birth - Native, outside of US (%) - Asian
Place of birth - Native, outside of US (%) - Hispanic or Latino
Place of birth - Native, outside of US (%) - American Indian and Alaska Native
Place of birth - Native, outside of US (%) - Multirace
Place of birth - Native, outside of US (%) - Other Race
Place of birth - Foreign born (%)
Place of birth - Foreign born (%) - White
Place of birth - Foreign born (%) - Black or African American
Place of birth - Foreign born (%) - Asian
Place of birth - Foreign born (%) - Hispanic or Latino
Place of birth - Foreign born (%) - American Indian and Alaska Native
Place of birth - Foreign born (%) - Multirace
Place of birth - Foreign born (%) - Other Race
Residents speaking English at home (%)
Residents speaking English at home - Born in the United States (%)
Residents speaking English at home - Native, born elsewhere (%)
Residents speaking English at home - Foreign born (%)
Residents speaking Spanish at home (%)
Residents speaking Spanish at home - Born in the United States (%)
Residents speaking Spanish at home - Native, born elsewhere (%)
Residents speaking Spanish at home - Foreign born (%)
Residents speaking other language at home (%)
Residents speaking other language at home - Born in the United States (%)
Residents speaking other language at home - Native, born elsewhere (%)
Residents speaking other language at home - Foreign born (%)
Marital status - Never married (%)
Marital status - Now married (%)
Marital status - Separated (%)
Marital status - Widowed (%)
Marital status - Divorced (%)
Ancestries Reported - Arab (%)
Ancestries Reported - Czech (%)
Ancestries Reported - Danish (%)
Ancestries Reported - Dutch (%)
Ancestries Reported - English (%)
Ancestries Reported - French (%)
Ancestries Reported - French Canadian (%)
Ancestries Reported - German (%)
Ancestries Reported - Greek (%)
Ancestries Reported - Hungarian (%)
Ancestries Reported - Irish (%)
Ancestries Reported - Italian (%)
Ancestries Reported - Lithuanian (%)
Ancestries Reported - Norwegian (%)
Ancestries Reported - Polish (%)
Ancestries Reported - Portuguese (%)
Ancestries Reported - Russian (%)
Ancestries Reported - Scotch-Irish (%)
Ancestries Reported - Scottish (%)
Ancestries Reported - Slovak (%)
Ancestries Reported - Subsaharan African (%)
Ancestries Reported - Swedish (%)
Ancestries Reported - Swiss (%)
Ancestries Reported - Ukrainian (%)
Ancestries Reported - United States (%)
Ancestries Reported - Welsh (%)
Ancestries Reported - West Indian (%)
Ancestries Reported - Other (%)
Geographical mobility - Same house 1 year ago (%)
Geographical mobility - Same house 1 year ago (%) - White
Geographical mobility - Same house 1 year ago (%) - Black or African American
Geographical mobility - Same house 1 year ago (%) - Asian
Geographical mobility - Same house 1 year ago (%) - Hispanic or Latino
Geographical mobility - Same house 1 year ago (%) - American Indian and Alaska Native
Geographical mobility - Same house 1 year ago (%) - Multirace
Geographical mobility - Same house 1 year ago (%) - Other Race
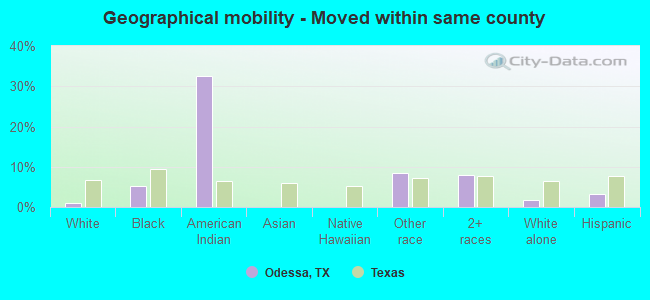
Geographical mobility - Moved within same county (%)
Geographical mobility - Moved within same county (%) - White
Geographical mobility - Moved within same county (%) - Black or African American
Geographical mobility - Moved within same county (%) - Asian
Geographical mobility - Moved within same county (%) - Hispanic or Latino
Geographical mobility - Moved within same county (%) - American Indian and Alaska Native
Geographical mobility - Moved within same county (%) - Multirace
Geographical mobility - Moved within same county (%) - Other Race
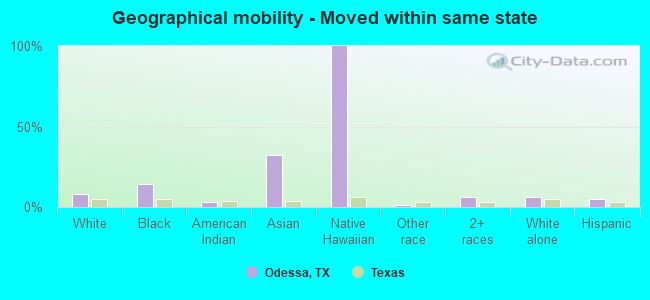
Geographical mobility - Moved from different county within same state (%)
Geographical mobility - Moved from different county within same state (%) - White
Geographical mobility - Moved from different county within same state (%) - Black or African American
Geographical mobility - Moved from different county within same state (%) - Asian
Geographical mobility - Moved from different county within same state (%) - Hispanic or Latino
Geographical mobility - Moved from different county within same state (%) - American Indian and Alaska Native
Geographical mobility - Moved from different county within same state (%) - Multirace
Geographical mobility - Moved from different county within same state (%) - Other Race
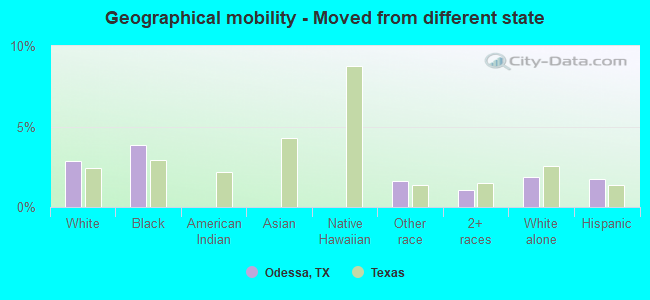
Geographical mobility - Moved from different state (%)
Geographical mobility - Moved from different state (%) - White
Geographical mobility - Moved from different state (%) - Black or African American
Geographical mobility - Moved from different state (%) - Asian
Geographical mobility - Moved from different state (%) - Hispanic or Latino
Geographical mobility - Moved from different state (%) - American Indian and Alaska Native
Geographical mobility - Moved from different state (%) - Multirace
Geographical mobility - Moved from different state (%) - Other Race
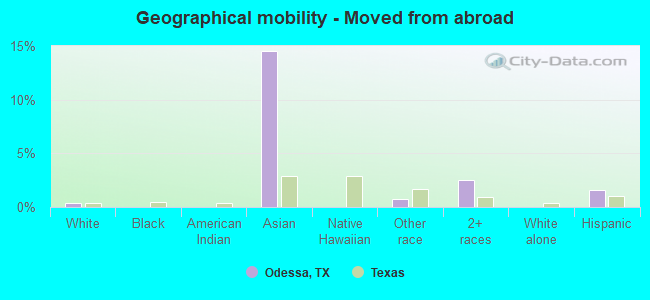
Geographical mobility - Moved from abroad (%)
Geographical mobility - Moved from abroad (%) - White
Geographical mobility - Moved from abroad (%) - Black or African American
Geographical mobility - Moved from abroad (%) - Asian
Geographical mobility - Moved from abroad (%) - Hispanic or Latino
Geographical mobility - Moved from abroad (%) - American Indian and Alaska Native
Geographical mobility - Moved from abroad (%) - Multirace
Geographical mobility - Moved from abroad (%) - Other Race
Place of birth for the foreign-born population - Ireland (%)
Place of birth for the foreign-born population - Denmark (%)
Place of birth for the foreign-born population - Norway (%)
Place of birth for the foreign-born population - Sweden (%)
Place of birth for the foreign-born population - United Kingdom (%)
Place of birth for the foreign-born population - England (%)
Place of birth for the foreign-born population - Scotland (%)
Place of birth for the foreign-born population - Other Northern Europe (%)
Place of birth for the foreign-born population - Austria (%)
Place of birth for the foreign-born population - Belgium (%)
Place of birth for the foreign-born population - France (%)
Place of birth for the foreign-born population - Germany (%)
Place of birth for the foreign-born population - Netherlands (%)
Place of birth for the foreign-born population - Switzerland (%)
Place of birth for the foreign-born population - Other Western Europe (%)
Place of birth for the foreign-born population - Greece (%)
Place of birth for the foreign-born population - Italy (%)
Place of birth for the foreign-born population - Portugal (%)
Place of birth for the foreign-born population - Spain (%)
Place of birth for the foreign-born population - Other Southern Europe (%)
Place of birth for the foreign-born population - Albania (%)
Place of birth for the foreign-born population - Belarus (%)
Place of birth for the foreign-born population - Bosnia and Herzegovina (%)
Place of birth for the foreign-born population - Bulgaria (%)
Place of birth for the foreign-born population - Croatia (%)
Place of birth for the foreign-born population - Czechoslovakia (%)
Place of birth for the foreign-born population - Hungary (%)
Place of birth for the foreign-born population - Latvia (%)
Place of birth for the foreign-born population - Lithuania (%)
Place of birth for the foreign-born population - North Macedonia (Macedonia) (%)
Place of birth for the foreign-born population - Moldova (%)
Place of birth for the foreign-born population - Poland (%)
Place of birth for the foreign-born population - Romania (%)
Place of birth for the foreign-born population - Russia (%)
Place of birth for the foreign-born population - Serbia (%)
Place of birth for the foreign-born population - Ukraine (%)
Place of birth for the foreign-born population - Other Eastern Europe (%)
Place of birth for the foreign-born population - China (%)
Place of birth for the foreign-born population - Hong Kong (%)
Place of birth for the foreign-born population - Taiwan (%)
Place of birth for the foreign-born population - Japan (%)
Place of birth for the foreign-born population - Korea (%)
Place of birth for the foreign-born population - Other Eastern Asia (%)
Place of birth for the foreign-born population - Afghanistan (%)
Place of birth for the foreign-born population - Bangladesh (%)
Place of birth for the foreign-born population - India (%)
Place of birth for the foreign-born population - Iran (%)
Place of birth for the foreign-born population - Kazakhstan (%)
Place of birth for the foreign-born population - Nepal (%)
Place of birth for the foreign-born population - Pakistan (%)
Place of birth for the foreign-born population - Sri Lanka (%)
Place of birth for the foreign-born population - Uzbekistan (%)
Place of birth for the foreign-born population - Other South Central Asia (%)
Place of birth for the foreign-born population - Burma (%)
Place of birth for the foreign-born population - Cambodia (%)
Place of birth for the foreign-born population - Indonesia (%)
Place of birth for the foreign-born population - Laos (%)
Place of birth for the foreign-born population - Malaysia (%)
Place of birth for the foreign-born population - Philippines (%)
Place of birth for the foreign-born population - Singapore (%)
Place of birth for the foreign-born population - Thailand (%)
Place of birth for the foreign-born population - Vietnam (%)
Place of birth for the foreign-born population - Other South Eastern Asia (%)
Place of birth for the foreign-born population - Armenia (%)
Place of birth for the foreign-born population - Iraq (%)
Place of birth for the foreign-born population - Israel (%)
Place of birth for the foreign-born population - Jordan (%)
Place of birth for the foreign-born population - Kuwait (%)
Place of birth for the foreign-born population - Lebanon (%)
Place of birth for the foreign-born population - Saudi Arabia (%)
Place of birth for the foreign-born population - Syria (%)
Place of birth for the foreign-born population - Turkey (%)
Place of birth for the foreign-born population - Yemen (%)
Place of birth for the foreign-born population - Other Western Asia (%)
Place of birth for the foreign-born population - Eritrea (%)
Place of birth for the foreign-born population - Ethiopia (%)
Place of birth for the foreign-born population - Kenya (%)
Place of birth for the foreign-born population - Somalia (%)
Place of birth for the foreign-born population - Uganda (%)
Place of birth for the foreign-born population - Zimbabwe (%)
Place of birth for the foreign-born population - Other Eastern Africa (%)
Place of birth for the foreign-born population - Cameroon (%)
Place of birth for the foreign-born population - Congo (%)
Place of birth for the foreign-born population - Democratic Republic of Congo (Zaire) (%)
Place of birth for the foreign-born population - Other Middle Africa (%)
Place of birth for the foreign-born population - Egypt (%)
Place of birth for the foreign-born population - Morocco (%)
Place of birth for the foreign-born population - Sudan (%)
Place of birth for the foreign-born population - Other Northern Africa (%)
Place of birth for the foreign-born population - South Africa (%)
Place of birth for the foreign-born population - Other Southern Africa (%)
Place of birth for the foreign-born population - Cabo Verde (%)
Place of birth for the foreign-born population - Ghana (%)
Place of birth for the foreign-born population - Liberia (%)
Place of birth for the foreign-born population - Nigeria (%)
Place of birth for the foreign-born population - Senegal (%)
Place of birth for the foreign-born population - Sierra Leone (%)
Place of birth for the foreign-born population - Other Western Africa (%)
Place of birth for the foreign-born population - Australia (%)
Place of birth for the foreign-born population - New Zealand (%)
Place of birth for the foreign-born population - Fiji (%)
Place of birth for the foreign-born population - Micronesia (%)
Place of birth for the foreign-born population - Bahamas (%)
Place of birth for the foreign-born population - Barbados (%)
Place of birth for the foreign-born population - Cuba (%)
Place of birth for the foreign-born population - Dominica (%)
Place of birth for the foreign-born population - Dominican Republic (%)
Place of birth for the foreign-born population - Grenada (%)
Place of birth for the foreign-born population - Haiti (%)
Place of birth for the foreign-born population - Jamaica (%)
Place of birth for the foreign-born population - St. Vincent and the Grenadines (%)
Place of birth for the foreign-born population - Trinidad and Tobago (%)
Place of birth for the foreign-born population - West Indies (%)
Place of birth for the foreign-born population - Other Caribbean (%)
Place of birth for the foreign-born population - Belize (%)
Place of birth for the foreign-born population - Costa Rica (%)
Place of birth for the foreign-born population - El Salvador (%)
Place of birth for the foreign-born population - Guatemala (%)
Place of birth for the foreign-born population - Honduras (%)
Place of birth for the foreign-born population - Mexico (%)
Place of birth for the foreign-born population - Nicaragua (%)
Place of birth for the foreign-born population - Panama (%)
Place of birth for the foreign-born population - Other Central America (%)
Place of birth for the foreign-born population - Argentina (%)
Place of birth for the foreign-born population - Bolivia (%)
Place of birth for the foreign-born population - Brazil (%)
Place of birth for the foreign-born population - Chile (%)
Place of birth for the foreign-born population - Colombia (%)
Place of birth for the foreign-born population - Ecuador (%)
Place of birth for the foreign-born population - Guyana (%)
Place of birth for the foreign-born population - Peru (%)
Place of birth for the foreign-born population - Uruguay (%)
Place of birth for the foreign-born population - Venezuela (%)
Place of birth for the foreign-born population - Other South America (%)
Place of birth for the foreign-born population - Canada (%)
Place of birth for the foreign-born population - Other Northern America (%)
Place of birth for the foreign-born population - Other (%)
Latest news about races in Odessa, TX collected exclusively by city-data.com from local newspapers, TV, and radio stations
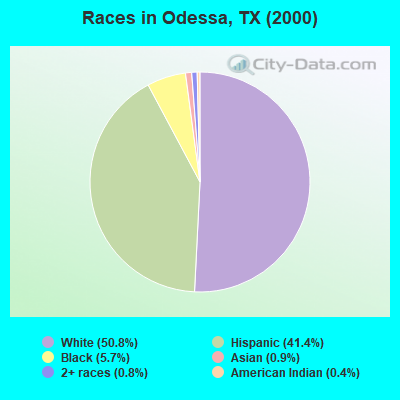
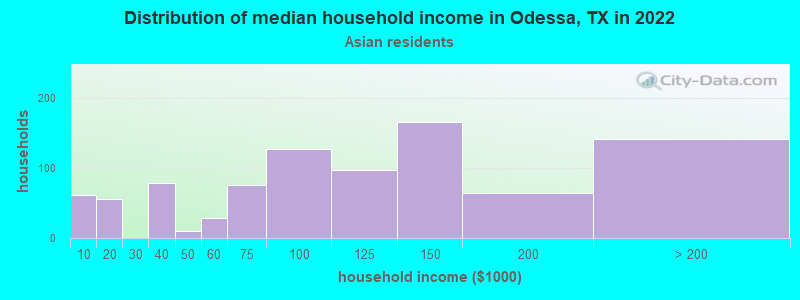
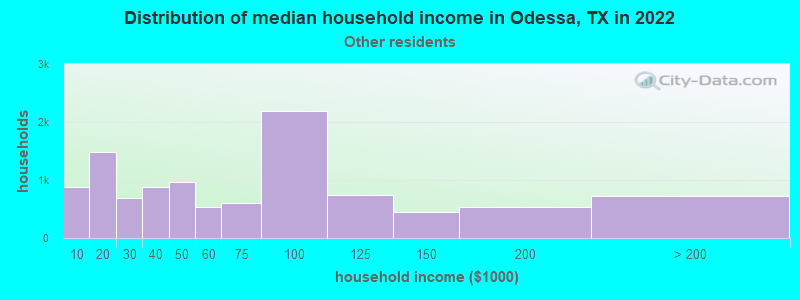
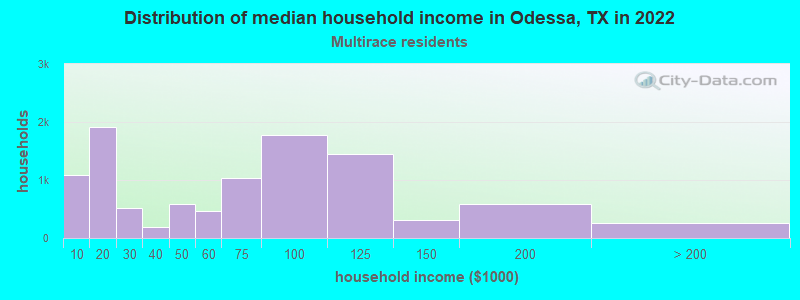
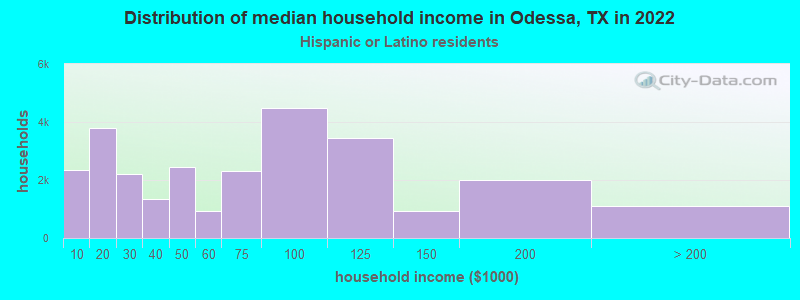
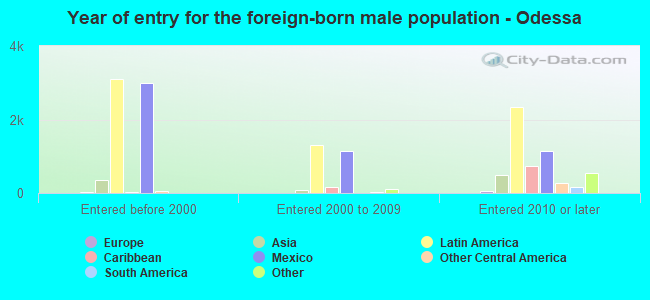
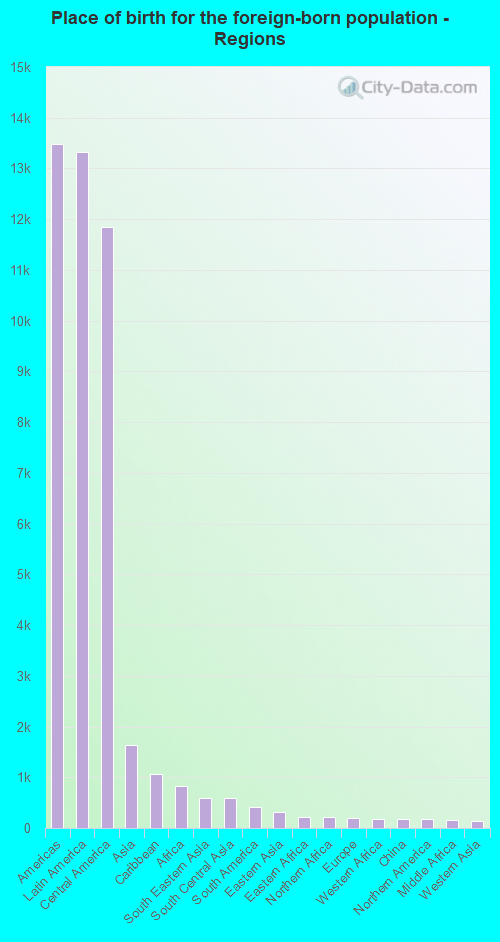
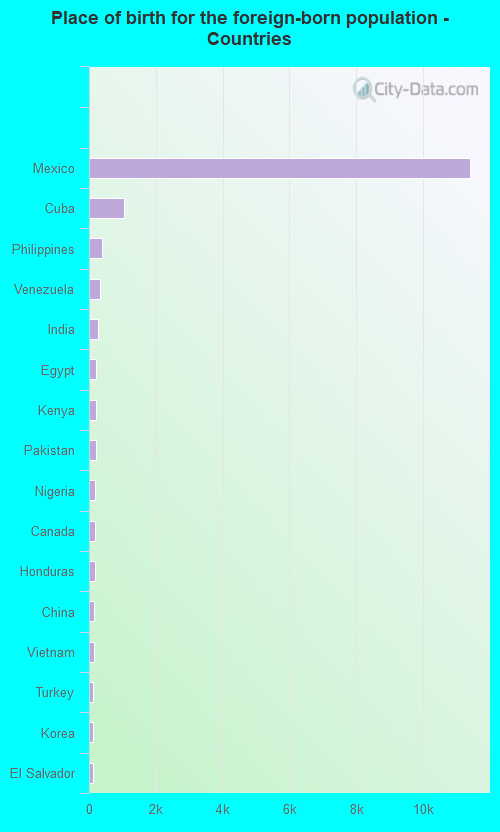
According to 2022 data, the most numerous races in Odessa, TX are Hispanic (72,986 residents), White alone (31,195 residents), and Black alone (6,069 residents). 52.0% of Odessa residents speak English at home. 14.4% of Odessa, TX residents are foreign-born (11.3% born in Latin America), which is 18.2% less than the foreign-born rate of 17.0% across the entire state of Texas.
Race distribution in Odessa
2000 2022
10,933,313 52.4% White alone 6,669,666 32.0% Hispanic 2,364,255 11.3% Black alone 554,445 2.7% Asian alone 230,567 1.1% Two or more races 68,859 0.3% American Indian alone 19,958 0.10% Other race alone 10,757 0.05% Native Hawaiian and Other
12,070,642 40.2% Hispanic 11,683,430 38.9% White alone 3,508,706 11.7% Black alone 1,608,173 5.4% Asian alone 956,560 3.2% Two or more races 125,763 0.4% Other race alone 47,023 0.2% American Indian alone 29,275 0.10% Native Hawaiian and Other
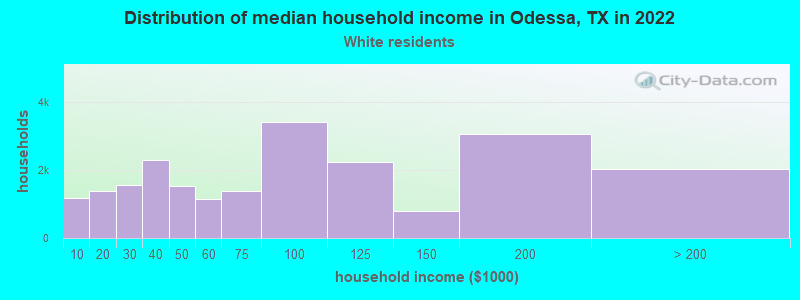
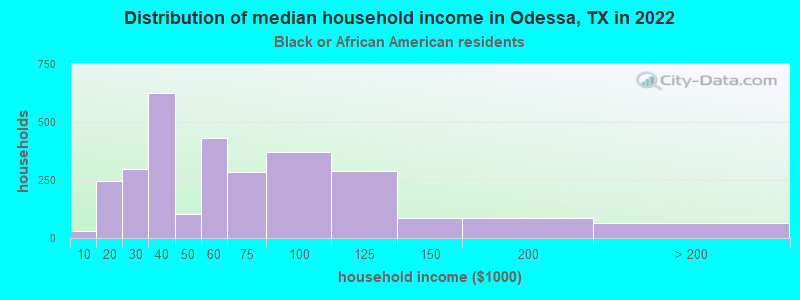
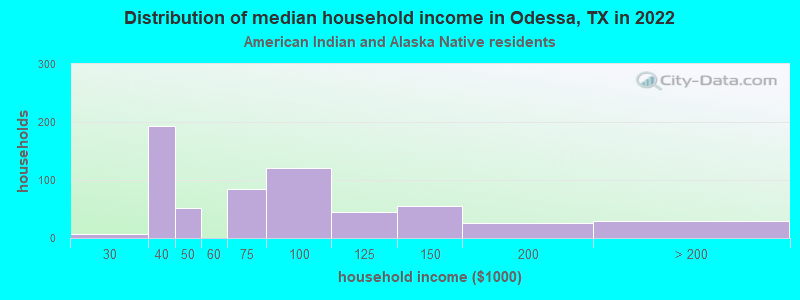
Income and house value in Odessa Median household income in 2022 $79,950 White non-Hispanic householders$53,880 Black householders$116,205 American Indian and Alaska Native householders$55,395 Asian householders$53,603 Some other race householders$66,127 Two or more races householders$61,718 Hispanic or Latino race householdersMedian 2022 house value $260,167 White Non-Hispanic householders$133,419 Black or African American householders$257,944 American Indian or Alaska Native householders $393,587 Asian householders$145,427 Some other race householders$162,771 Two or more races householders$144,982 Hispanic or Latino householders
Median age by race in Odessa
33.3 Median age for White residents31.2 35.2 26.9 Median age for Black or African American residents23.5 32.1 57.3 Median age for American Indian / Alaska Native residents77.3 38.4 33.7 Median age for Asian residents33.2 34.3 -666,666,666.0 Median age for Native Hawaiian / Pacific Islander residents-666,666,666.0 -666,666,666.0 29.5 Median age for Other race residents29.7 29.1 29.8 Median age for Two or more races residents30.1 29.8 38.5 Median age for White alone residents37.1 40.2 27.6 Median age for Hispanic or Latino residents27.5 27.8
Owner/renter occupied households by race in Odessa
House owners and renters - White residents 14,394 65.3% Owner occupied7,639 34.7% Renter occupiedHouse owners and renters - Black or African American residents 581 20.4% Owner occupied2,264 79.6% Renter occupiedHouse owners and renters - American Indian / Alaska Native residents 346 56.7% Owner occupied265 43.3% Renter occupiedHouse owners and renters - Asian residents 473 35.8% Owner occupied850 64.2% Renter occupiedHouse owners and renters - Native Hawaiian / Pacific Islander residents 103 100.0% Renter occupiedHouse owners and renters - Other race residents 6,894 62.1% Owner occupied4,204 37.9% Renter occupiedHouse owners and renters - Two or more races residents 6,136 60.3% Owner occupied4,039 39.7% Renter occupiedHouse owners and renters - White alone residents 9,721 66.1% Owner occupied4,983 33.9% Renter occupiedHouse owners and renters - Hispanic or Latino residents 17,129 62.7% Owner occupied10,185 37.3% Renter occupied
Language usage in Odessa
English speakers - Total 52.0% of residents of Odessa speak English at home.
43.6% of residents speak Spanish at home 35,594 76.3% Speak English very well11,063 23.7% Speak English less than very well4.4% of residents speak other language at home 3,043 65.0% Speak English very well1,635 35.0% Speak English less than very well
English speakers - Born in the United States 63.6% of residents of Odessa speak English at home.
34.2% of residents speak Spanish at home 6,065 94.0% Speak English very well388 6.0% Speak English less than very well2.2% of residents speak other language at home 283 67.1% Speak English very well139 32.9% Speak English less than very well
English speakers - Native, born elsewhere 92.8% of residents of Odessa speak English at home.
7.2% of residents speak Spanish at home 84 100.0% Speak English less than very well
English speakers - Foreign-born 13.4% of residents of Odessa speak English at home.
63.5% of residents speak Spanish at home 4,177 37.0% Speak English very well7,127 63.0% Speak English less than very well23.1% of residents speak other language at home 2,616 63.6% Speak English very well1,496 36.4% Speak English less than very well
White (Caucasian) - Speak only English Native:
79.8% (35,027)Foreign-born:
45.6% (1,481)
White (Caucasian) - Speak another language Native:
20.2% (8,855)Foreign-born:
54.4% (1,767)
Black or African American - Speak only English Native:
94.8% (5,957)Foreign-born:
4.0% (25)
Black or African American - Speak another language Native:
5.2% (324)Foreign-born:
100.0% (611)
American Indian / Alaska Native - Speak only English Native:
29.6% (306)Foreign-born:
7.5% (11)
American Indian / Alaska Native - Speak another language Native:
77.3% (800)Foreign-born:
92.5% (131)
Asian - Speak another language Native:
10.5% (106)Foreign-born:
100.0% (2,451)
Other race - Speak only English Native:
25.3% (5,470)Foreign-born:
9.4% (553)
Other race - Speak another language Native:
74.7% (16,133)Foreign-born:
90.6% (5,361)
Two or more races - Speak only English Native:
40.9% (6,929)Foreign-born:
6.4% (326)
Two or more races - Speak another language Native:
59.1% (10,006)Foreign-born:
93.6% (4,734)
White alone - Speak only English Native:
95.4% (25,440)Foreign-born:
45.3% (512)
White alone - Speak another language Native:
4.8% (1,281)Foreign-born:
49.8% (563)
Hispanic or Latino - Speak only English Native:
35.8% (18,948)Foreign-born:
11.2% (1,426)
Hispanic or Latino - Speak another language Native:
64.2% (33,912)Foreign-born:
88.8% (11,304)
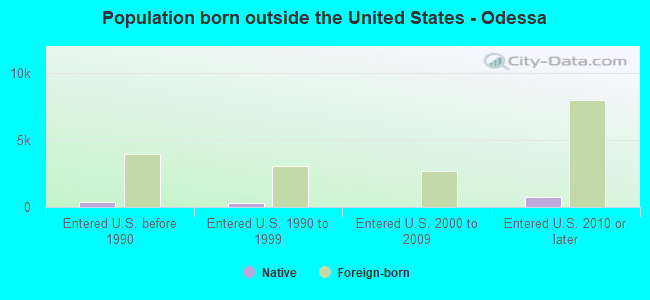
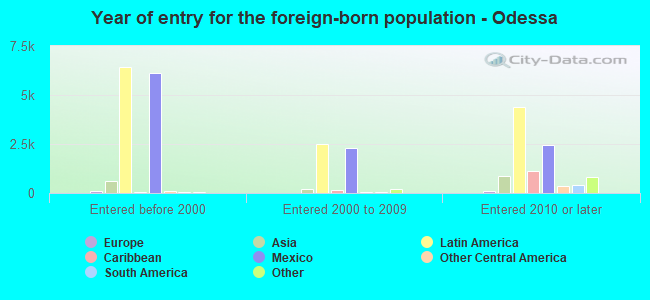
Foreign-born residents in Odessa 16,157 residents are foreign born (11.3% Latin America ).
This city:
14.4%Texas:
17.1%
Marital status for residents in Odessa Marital status - White (Caucasian) population 15 years and over
Males 36.6% Never married52.8% Now married1.8% Separated1.7% Widowed7.1% DivorcedFemales 21.6% Never married50.3% Now married4.5% Separated8.6% Widowed15.0% DivorcedWomen who gave birth in the past 12 months Now married:
58.6% (999)Unmarried:
41.4% (705)
Women who did not give birth in the past 12 months Now married:
54.5% (5,683)Unmarried:
45.5% (4,737)
Marital status - Black or African American population 15 years and over
Males 41.9% Never married36.9% Now married8.8% Separated2.1% Widowed10.4% DivorcedFemales 43.7% Never married32.9% Now married3.9% Separated6.9% Widowed12.6% DivorcedWomen who gave birth in the past 12 months Now married:
67.5% (134)Unmarried:
32.5% (65)
Women who did not give birth in the past 12 months Now married:
32.8% (556)Unmarried:
67.2% (1,141)
Marital status - American Indian / Alaska Native population 15 years and over
Males 33.5% Never married45.0% Now married1.2% Separated11.3% Widowed9.0% DivorcedFemales 31.8% Never married64.0% Now married0.0% Separated4.2% Widowed0.0% DivorcedWomen who gave birth in the past 12 months Now married:
100.0% (10)Unmarried:
0.0% (0)
Women who did not give birth in the past 12 months Now married:
53.8% (143)Unmarried:
46.2% (123)
Marital status - Asian population 15 years and over
Males 37.2% Never married60.7% Now married0.7% Separated0.5% Widowed0.9% DivorcedFemales 13.4% Never married82.3% Now married0.0% Separated1.1% Widowed3.2% DivorcedWomen who gave birth in the past 12 months Now married:
100.0% (30)Unmarried:
0.0% (0)
Women who did not give birth in the past 12 months Now married:
81.3% (490)Unmarried:
18.7% (113)
Marital status - Native Hawaiian / Pacific Islander population 15 years and over
Males 100.0% Never married0.0% Now married0.0% Separated0.0% Widowed0.0% DivorcedFemales 100.0% Never married0.0% Now married0.0% Separated0.0% Widowed0.0% DivorcedWomen who did not give birth in the past 12 months Now married:
0.0% (0)Unmarried:
100.0% (8)
Marital status - Other race population 15 years and over
Males 47.3% Never married38.8% Now married1.5% Separated5.0% Widowed7.4% DivorcedFemales 35.6% Never married39.8% Now married7.1% Separated5.4% Widowed12.2% DivorcedWomen who gave birth in the past 12 months Now married:
100.0% (478)Unmarried:
0.0% (0)
Women who did not give birth in the past 12 months Now married:
39.5% (2,674)Unmarried:
60.5% (4,091)
Marital status - Two or more races population 15 years and over
Males 48.5% Never married41.1% Now married0.5% Separated0.0% Widowed9.9% DivorcedFemales 36.7% Never married36.5% Now married2.3% Separated11.5% Widowed13.0% DivorcedWomen who gave birth in the past 12 months Now married:
80.1% (185)Unmarried:
19.9% (46)
Women who did not give birth in the past 12 months Now married:
37.0% (2,056)Unmarried:
63.0% (3,504)
Marital status - White alone, not Hispanic / Latino population 15 years and over
Males 29.8% Never married58.1% Now married0.7% Separated2.2% Widowed9.2% DivorcedFemales 16.6% Never married56.4% Now married0.4% Separated12.0% Widowed14.6% DivorcedWomen who gave birth in the past 12 months Now married:
100.0% (635)Unmarried:
0.0% (0)
Women who did not give birth in the past 12 months Now married:
55.8% (3,264)Unmarried:
44.2% (2,582)
Marital status - Hispanic or Latino population 15 years and over
Males 48.2% Never married40.2% Now married1.7% Separated2.7% Widowed7.2% DivorcedFemales 35.8% Never married38.5% Now married6.9% Separated6.4% Widowed12.4% DivorcedWomen who gave birth in the past 12 months Now married:
54.0% (1,099)Unmarried:
46.0% (935)
Women who did not give birth in the past 12 months Now married:
43.9% (7,447)Unmarried:
56.1% (9,521)
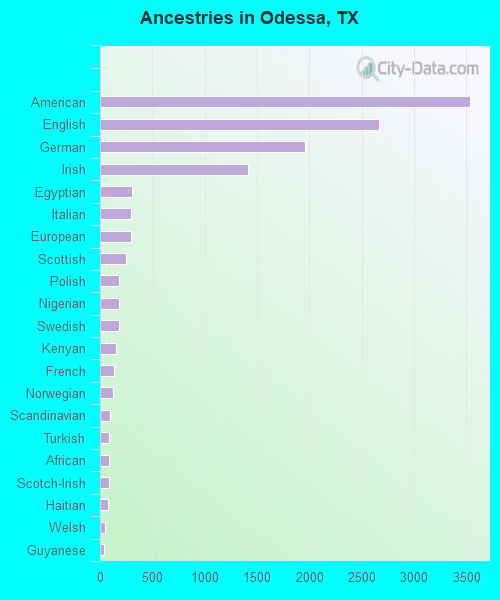
Ancestries in Odessa
3,541 4.6% American2,667 3.4% English1,962 2.5% German1,413 1.8% Irish304 0.4% Egyptian299 0.4% Italian292 0.4% European244 0.3% Scottish182 0.2% Polish182 0.2% Nigerian180 0.2% Swedish149 0.2% Kenyan136 0.2% French121 0.2% Norwegian97 0.1% Scandinavian90 0.1% Turkish89 0.1% African88 0.1% Scotch-Irish73 0.09% Haitian48 0.06% Welsh36 0.05% Guyanese27 0.03% Eastern European27 0.03% French Canadian26 0.03% British25 0.03% Dutch25 0.03% Greek17 0.02% Austrian15 0.02% Northern European14 0.02% Finnish11 0.01% Czech10 0.01% Ghanaian8 0.01% Australian8 0.01% Brazilian7 0.01% Trinidadian and Tobagonian
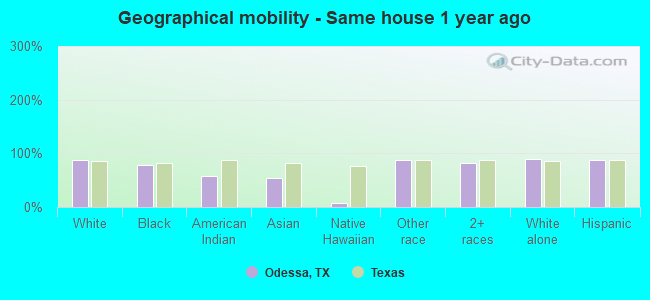
Geographical mobility in Odessa Same house 1 year ago 44,381 87.6% White (Caucasian)5,910 77.7% Black or African American744 58.6% American Indian / Alaska Native1,868 53.6% Asian9 7.7% Native Hawaiian / Pacific Islander21,910 87.5% Other race19,545 82.3% Two or more races27,826 89.9% White alone, not Hispanic / Latino62,654 88.1% Hispanic or LatinoMoved within same county 545 1.1% White / Caucasian398 5.2% Black or African American414 32.6% American Indian / Alaska Native2,120 8.5% Other race1,907 8.0% Two or more races545 1.8% White alone, not Hispanic / Latino2,313 3.3% Hispanic or LatinoMoved within same state 4,150 8.2% White / Caucasian1,078 14.2% Black or African American32 2.5% American Indian / Alaska Native1,113 31.9% Asian157 100.0% Native Hawaiian / Pacific Islander354 1.4% Other race1,460 6.1% Two or more races2,006 6.5% White alone, not Hispanic / Latino3,798 5.3% Hispanic or LatinoMoved from different state 1,444 2.8% White / Caucasian295 3.9% Black or African American403 1.6% Other race245 1.0% Two or more races577 1.9% White alone, not Hispanic / Latino1,228 1.7% Hispanic or LatinoMoved from abroad 172 0.3% White506 14.5% Asian191 0.8% Other race604 2.5% Two or more races1,137 1.6% Hispanic or Latino
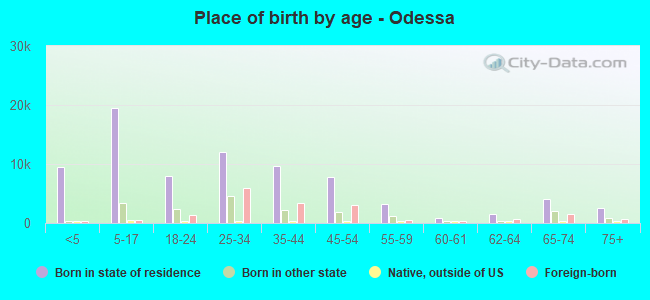
Children Nativity (place of birth) in Odessa
Children under 6 years - Living with two parents Both parents native 4,389 100.0% NativeBoth parents foreign-born 601 95.7% Native27 4.3% Foreign-bornOne native, one foreign-born parent 969 100.0% NativeChildren under 6 years - Living with one parent Native parent 4,058 100.0% NativeForeign-born parent 474 97.6% Native12 2.4% Foreign-bornChildren 6 to 17 years - Living with two parents Both parents native 7,746 100.0% Native3 0.0% Foreign-bornBoth parents foreign-born 914 66.3% Native464 33.7% Foreign-bornOne native, one foreign-born parent 1,638 99.1% Native15 0.9% Foreign-bornChildren 6 to 17 years - Living with one parent Native parent 7,038 100.0% NativeForeign-born parent 2,228 54.2% Native1,883 45.8% Foreign-born
Grandparents responsible for own grandchildren in Odessa
Grandparents (30 to 59 years) White / Caucasian 305 39.8% Responsible for grandchildren462 60.2% Not responsible for grandchildrenBlack or African American 8 100.0% Responsible for grandchildrenAmerican Indian / Alaska Native 29 100.0% Not responsible for grandchildrenOther race 412 83.1% Responsible for grandchildren84 16.9% Not responsible for grandchildrenTwo or more races 309 66.8% Responsible for grandchildren154 33.2% Not responsible for grandchildrenWhite alone, not Hispanic / Latino 115 50.6% Responsible for grandchildren113 49.4% Not responsible for grandchildrenHispanic or Latino 583 52.0% Responsible for grandchildren539 48.0% Not responsible for grandchildrenGrandparents (60 years and over) White / Caucasian 63 25.0% Responsible for grandchildren190 75.0% Not responsible for grandchildrenBlack or African American 16 17.4% Responsible for grandchildren77 82.6% Not responsible for grandchildrenAmerican Indian / Alaska Native 20 100.0% Not responsible for grandchildrenOther race 199 49.2% Responsible for grandchildren206 50.8% Not responsible for grandchildrenTwo or more races 21 12.7% Responsible for grandchildren145 87.3% Not responsible for grandchildrenWhite alone, not Hispanic / Latino 16 13.9% Responsible for grandchildren102 86.1% Not responsible for grandchildrenHispanic or Latino 515 44.0% Responsible for grandchildren655 56.0% Not responsible for grandchildren