Races in Ogden, Utah (UT) Detailed Stats
Data:
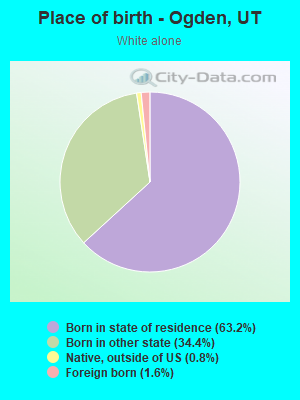
Races - White alone (%)
Races - White alone (% change since 2000)
Races - Black alone (%)
Races - Black alone (% change since 2000)
Races - American Indian alone (%)
Races - American Indian alone (% change since 2000)
Races - Asian alone (%)
Races - Asian alone (% change since 2000)
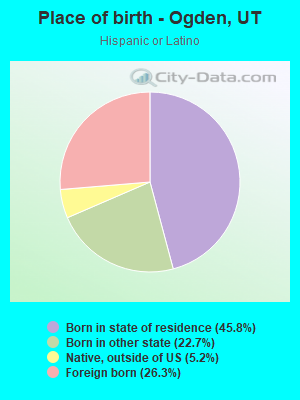
Races - Hispanic (%)
Races - Hispanic (% change since 2000)
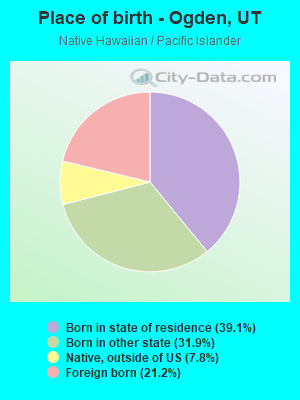
Races - Native Hawaiian and Other Pacific Islander alone (%)
Races - Native Hawaiian and Other Pacific Islander alone (% change since 2000)
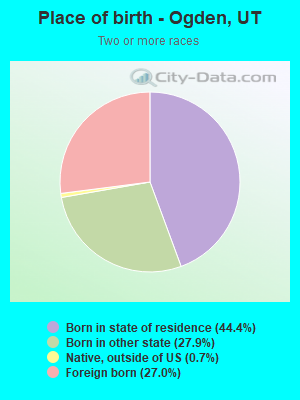
Races - Two or more races(%)
Races - Two or more races(% change since 2000)
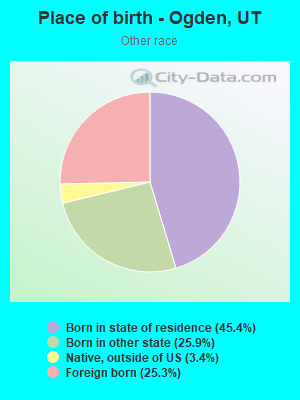
Races - Other race alone (%)
Races - Other race alone (% change since 2000)
Racial diversity
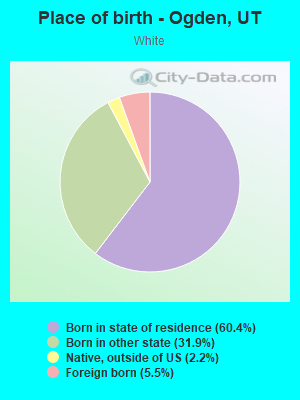
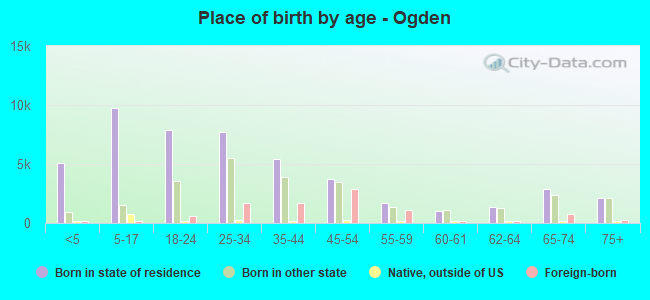
Place of birth - Born in state of residence (%)
Place of birth - Born in state of residence (%) - White
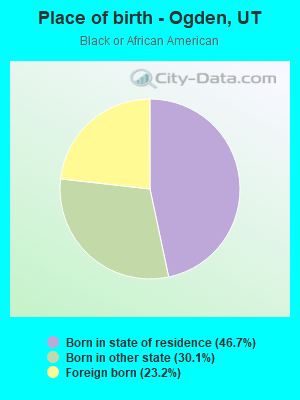
Place of birth - Born in state of residence (%) - Black or African American
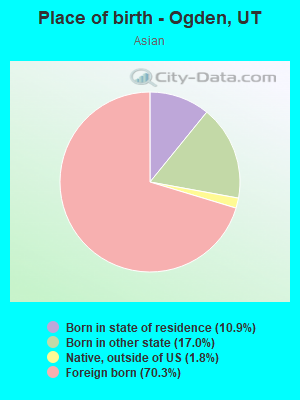
Place of birth - Born in state of residence (%) - Asian
Place of birth - Born in state of residence (%) - Hispanic or Latino
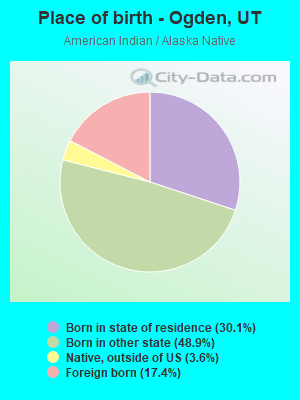
Place of birth - Born in state of residence (%) - American Indian and Alaska Native
Place of birth - Born in state of residence (%) - Multirace
Place of birth - Born in state of residence (%) - Other Race
Place of birth - Born in other state (%)
Place of birth - Born in other state (%) - White
Place of birth - Born in other state (%) - Black or African American
Place of birth - Born in other state (%) - Asian
Place of birth - Born in other state (%) - Hispanic or Latino
Place of birth - Born in other state (%) - American Indian and Alaska Native
Place of birth - Born in other state (%) - Multirace
Place of birth - Born in other state (%) - Other Race
Place of birth - Native, outside of US (%)
Place of birth - Native, outside of US (%) - White
Place of birth - Native, outside of US (%) - Black or African American
Place of birth - Native, outside of US (%) - Asian
Place of birth - Native, outside of US (%) - Hispanic or Latino
Place of birth - Native, outside of US (%) - American Indian and Alaska Native
Place of birth - Native, outside of US (%) - Multirace
Place of birth - Native, outside of US (%) - Other Race
Place of birth - Foreign born (%)
Place of birth - Foreign born (%) - White
Place of birth - Foreign born (%) - Black or African American
Place of birth - Foreign born (%) - Asian
Place of birth - Foreign born (%) - Hispanic or Latino
Place of birth - Foreign born (%) - American Indian and Alaska Native
Place of birth - Foreign born (%) - Multirace
Place of birth - Foreign born (%) - Other Race
Residents speaking English at home (%)
Residents speaking English at home - Born in the United States (%)
Residents speaking English at home - Native, born elsewhere (%)
Residents speaking English at home - Foreign born (%)
Residents speaking Spanish at home (%)
Residents speaking Spanish at home - Born in the United States (%)
Residents speaking Spanish at home - Native, born elsewhere (%)
Residents speaking Spanish at home - Foreign born (%)
Residents speaking other language at home (%)
Residents speaking other language at home - Born in the United States (%)
Residents speaking other language at home - Native, born elsewhere (%)
Residents speaking other language at home - Foreign born (%)
Marital status - Never married (%)
Marital status - Now married (%)
Marital status - Separated (%)
Marital status - Widowed (%)
Marital status - Divorced (%)
Ancestries Reported - Arab (%)
Ancestries Reported - Czech (%)
Ancestries Reported - Danish (%)
Ancestries Reported - Dutch (%)
Ancestries Reported - English (%)
Ancestries Reported - French (%)
Ancestries Reported - French Canadian (%)
Ancestries Reported - German (%)
Ancestries Reported - Greek (%)
Ancestries Reported - Hungarian (%)
Ancestries Reported - Irish (%)
Ancestries Reported - Italian (%)
Ancestries Reported - Lithuanian (%)
Ancestries Reported - Norwegian (%)
Ancestries Reported - Polish (%)
Ancestries Reported - Portuguese (%)
Ancestries Reported - Russian (%)
Ancestries Reported - Scotch-Irish (%)
Ancestries Reported - Scottish (%)
Ancestries Reported - Slovak (%)
Ancestries Reported - Subsaharan African (%)
Ancestries Reported - Swedish (%)
Ancestries Reported - Swiss (%)
Ancestries Reported - Ukrainian (%)
Ancestries Reported - United States (%)
Ancestries Reported - Welsh (%)
Ancestries Reported - West Indian (%)
Ancestries Reported - Other (%)
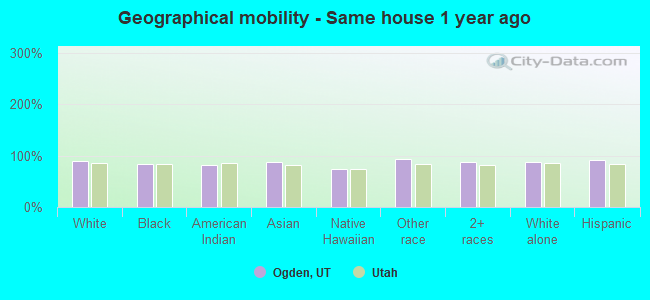
Geographical mobility - Same house 1 year ago (%)
Geographical mobility - Same house 1 year ago (%) - White
Geographical mobility - Same house 1 year ago (%) - Black or African American
Geographical mobility - Same house 1 year ago (%) - Asian
Geographical mobility - Same house 1 year ago (%) - Hispanic or Latino
Geographical mobility - Same house 1 year ago (%) - American Indian and Alaska Native
Geographical mobility - Same house 1 year ago (%) - Multirace
Geographical mobility - Same house 1 year ago (%) - Other Race
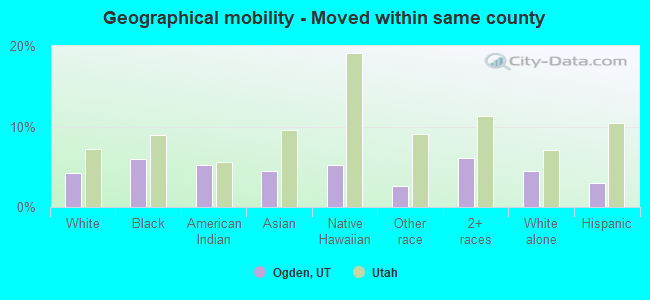
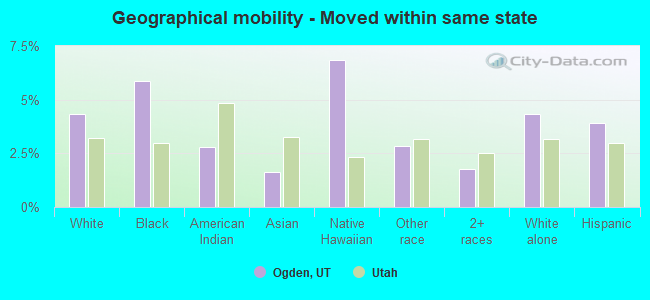
Geographical mobility - Moved within same county (%)
Geographical mobility - Moved within same county (%) - White
Geographical mobility - Moved within same county (%) - Black or African American
Geographical mobility - Moved within same county (%) - Asian
Geographical mobility - Moved within same county (%) - Hispanic or Latino
Geographical mobility - Moved within same county (%) - American Indian and Alaska Native
Geographical mobility - Moved within same county (%) - Multirace
Geographical mobility - Moved within same county (%) - Other Race
Geographical mobility - Moved from different county within same state (%)
Geographical mobility - Moved from different county within same state (%) - White
Geographical mobility - Moved from different county within same state (%) - Black or African American
Geographical mobility - Moved from different county within same state (%) - Asian
Geographical mobility - Moved from different county within same state (%) - Hispanic or Latino
Geographical mobility - Moved from different county within same state (%) - American Indian and Alaska Native
Geographical mobility - Moved from different county within same state (%) - Multirace
Geographical mobility - Moved from different county within same state (%) - Other Race
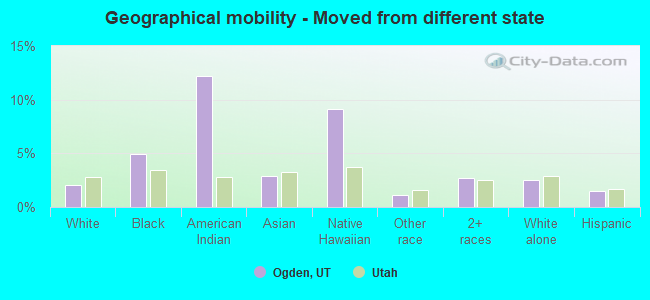
Geographical mobility - Moved from different state (%)
Geographical mobility - Moved from different state (%) - White
Geographical mobility - Moved from different state (%) - Black or African American
Geographical mobility - Moved from different state (%) - Asian
Geographical mobility - Moved from different state (%) - Hispanic or Latino
Geographical mobility - Moved from different state (%) - American Indian and Alaska Native
Geographical mobility - Moved from different state (%) - Multirace
Geographical mobility - Moved from different state (%) - Other Race
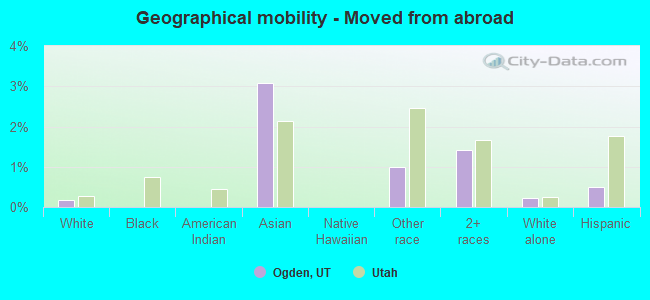
Geographical mobility - Moved from abroad (%)
Geographical mobility - Moved from abroad (%) - White
Geographical mobility - Moved from abroad (%) - Black or African American
Geographical mobility - Moved from abroad (%) - Asian
Geographical mobility - Moved from abroad (%) - Hispanic or Latino
Geographical mobility - Moved from abroad (%) - American Indian and Alaska Native
Geographical mobility - Moved from abroad (%) - Multirace
Geographical mobility - Moved from abroad (%) - Other Race
Place of birth for the foreign-born population - Ireland (%)
Place of birth for the foreign-born population - Denmark (%)
Place of birth for the foreign-born population - Norway (%)
Place of birth for the foreign-born population - Sweden (%)
Place of birth for the foreign-born population - United Kingdom (%)
Place of birth for the foreign-born population - England (%)
Place of birth for the foreign-born population - Scotland (%)
Place of birth for the foreign-born population - Other Northern Europe (%)
Place of birth for the foreign-born population - Austria (%)
Place of birth for the foreign-born population - Belgium (%)
Place of birth for the foreign-born population - France (%)
Place of birth for the foreign-born population - Germany (%)
Place of birth for the foreign-born population - Netherlands (%)
Place of birth for the foreign-born population - Switzerland (%)
Place of birth for the foreign-born population - Other Western Europe (%)
Place of birth for the foreign-born population - Greece (%)
Place of birth for the foreign-born population - Italy (%)
Place of birth for the foreign-born population - Portugal (%)
Place of birth for the foreign-born population - Spain (%)
Place of birth for the foreign-born population - Other Southern Europe (%)
Place of birth for the foreign-born population - Albania (%)
Place of birth for the foreign-born population - Belarus (%)
Place of birth for the foreign-born population - Bosnia and Herzegovina (%)
Place of birth for the foreign-born population - Bulgaria (%)
Place of birth for the foreign-born population - Croatia (%)
Place of birth for the foreign-born population - Czechoslovakia (%)
Place of birth for the foreign-born population - Hungary (%)
Place of birth for the foreign-born population - Latvia (%)
Place of birth for the foreign-born population - Lithuania (%)
Place of birth for the foreign-born population - North Macedonia (Macedonia) (%)
Place of birth for the foreign-born population - Moldova (%)
Place of birth for the foreign-born population - Poland (%)
Place of birth for the foreign-born population - Romania (%)
Place of birth for the foreign-born population - Russia (%)
Place of birth for the foreign-born population - Serbia (%)
Place of birth for the foreign-born population - Ukraine (%)
Place of birth for the foreign-born population - Other Eastern Europe (%)
Place of birth for the foreign-born population - China (%)
Place of birth for the foreign-born population - Hong Kong (%)
Place of birth for the foreign-born population - Taiwan (%)
Place of birth for the foreign-born population - Japan (%)
Place of birth for the foreign-born population - Korea (%)
Place of birth for the foreign-born population - Other Eastern Asia (%)
Place of birth for the foreign-born population - Afghanistan (%)
Place of birth for the foreign-born population - Bangladesh (%)
Place of birth for the foreign-born population - India (%)
Place of birth for the foreign-born population - Iran (%)
Place of birth for the foreign-born population - Kazakhstan (%)
Place of birth for the foreign-born population - Nepal (%)
Place of birth for the foreign-born population - Pakistan (%)
Place of birth for the foreign-born population - Sri Lanka (%)
Place of birth for the foreign-born population - Uzbekistan (%)
Place of birth for the foreign-born population - Other South Central Asia (%)
Place of birth for the foreign-born population - Burma (%)
Place of birth for the foreign-born population - Cambodia (%)
Place of birth for the foreign-born population - Indonesia (%)
Place of birth for the foreign-born population - Laos (%)
Place of birth for the foreign-born population - Malaysia (%)
Place of birth for the foreign-born population - Philippines (%)
Place of birth for the foreign-born population - Singapore (%)
Place of birth for the foreign-born population - Thailand (%)
Place of birth for the foreign-born population - Vietnam (%)
Place of birth for the foreign-born population - Other South Eastern Asia (%)
Place of birth for the foreign-born population - Armenia (%)
Place of birth for the foreign-born population - Iraq (%)
Place of birth for the foreign-born population - Israel (%)
Place of birth for the foreign-born population - Jordan (%)
Place of birth for the foreign-born population - Kuwait (%)
Place of birth for the foreign-born population - Lebanon (%)
Place of birth for the foreign-born population - Saudi Arabia (%)
Place of birth for the foreign-born population - Syria (%)
Place of birth for the foreign-born population - Turkey (%)
Place of birth for the foreign-born population - Yemen (%)
Place of birth for the foreign-born population - Other Western Asia (%)
Place of birth for the foreign-born population - Eritrea (%)
Place of birth for the foreign-born population - Ethiopia (%)
Place of birth for the foreign-born population - Kenya (%)
Place of birth for the foreign-born population - Somalia (%)
Place of birth for the foreign-born population - Uganda (%)
Place of birth for the foreign-born population - Zimbabwe (%)
Place of birth for the foreign-born population - Other Eastern Africa (%)
Place of birth for the foreign-born population - Cameroon (%)
Place of birth for the foreign-born population - Congo (%)
Place of birth for the foreign-born population - Democratic Republic of Congo (Zaire) (%)
Place of birth for the foreign-born population - Other Middle Africa (%)
Place of birth for the foreign-born population - Egypt (%)
Place of birth for the foreign-born population - Morocco (%)
Place of birth for the foreign-born population - Sudan (%)
Place of birth for the foreign-born population - Other Northern Africa (%)
Place of birth for the foreign-born population - South Africa (%)
Place of birth for the foreign-born population - Other Southern Africa (%)
Place of birth for the foreign-born population - Cabo Verde (%)
Place of birth for the foreign-born population - Ghana (%)
Place of birth for the foreign-born population - Liberia (%)
Place of birth for the foreign-born population - Nigeria (%)
Place of birth for the foreign-born population - Senegal (%)
Place of birth for the foreign-born population - Sierra Leone (%)
Place of birth for the foreign-born population - Other Western Africa (%)
Place of birth for the foreign-born population - Australia (%)
Place of birth for the foreign-born population - New Zealand (%)
Place of birth for the foreign-born population - Fiji (%)
Place of birth for the foreign-born population - Micronesia (%)
Place of birth for the foreign-born population - Bahamas (%)
Place of birth for the foreign-born population - Barbados (%)
Place of birth for the foreign-born population - Cuba (%)
Place of birth for the foreign-born population - Dominica (%)
Place of birth for the foreign-born population - Dominican Republic (%)
Place of birth for the foreign-born population - Grenada (%)
Place of birth for the foreign-born population - Haiti (%)
Place of birth for the foreign-born population - Jamaica (%)
Place of birth for the foreign-born population - St. Vincent and the Grenadines (%)
Place of birth for the foreign-born population - Trinidad and Tobago (%)
Place of birth for the foreign-born population - West Indies (%)
Place of birth for the foreign-born population - Other Caribbean (%)
Place of birth for the foreign-born population - Belize (%)
Place of birth for the foreign-born population - Costa Rica (%)
Place of birth for the foreign-born population - El Salvador (%)
Place of birth for the foreign-born population - Guatemala (%)
Place of birth for the foreign-born population - Honduras (%)
Place of birth for the foreign-born population - Mexico (%)
Place of birth for the foreign-born population - Nicaragua (%)
Place of birth for the foreign-born population - Panama (%)
Place of birth for the foreign-born population - Other Central America (%)
Place of birth for the foreign-born population - Argentina (%)
Place of birth for the foreign-born population - Bolivia (%)
Place of birth for the foreign-born population - Brazil (%)
Place of birth for the foreign-born population - Chile (%)
Place of birth for the foreign-born population - Colombia (%)
Place of birth for the foreign-born population - Ecuador (%)
Place of birth for the foreign-born population - Guyana (%)
Place of birth for the foreign-born population - Peru (%)
Place of birth for the foreign-born population - Uruguay (%)
Place of birth for the foreign-born population - Venezuela (%)
Place of birth for the foreign-born population - Other South America (%)
Place of birth for the foreign-born population - Canada (%)
Place of birth for the foreign-born population - Other Northern America (%)
Place of birth for the foreign-born population - Other (%)
Latest news about races in Ogden, UT collected exclusively by city-data.com from local newspapers, TV, and radio stations
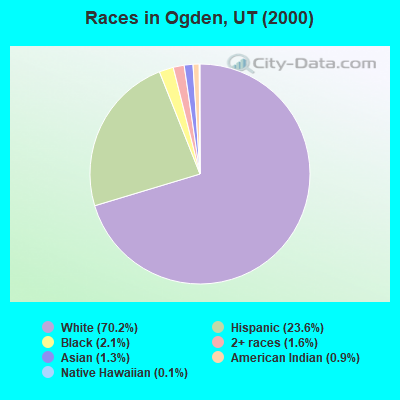
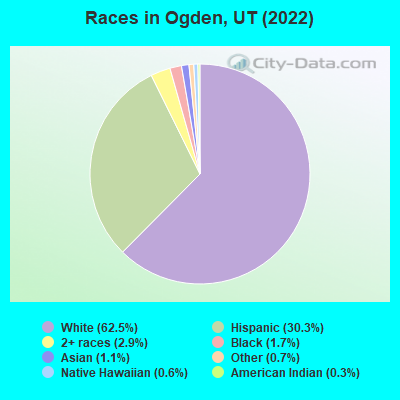
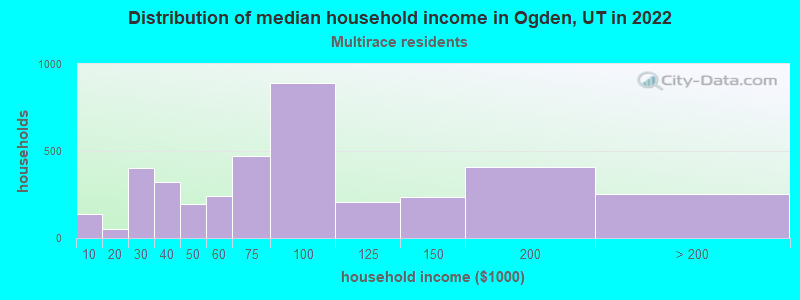
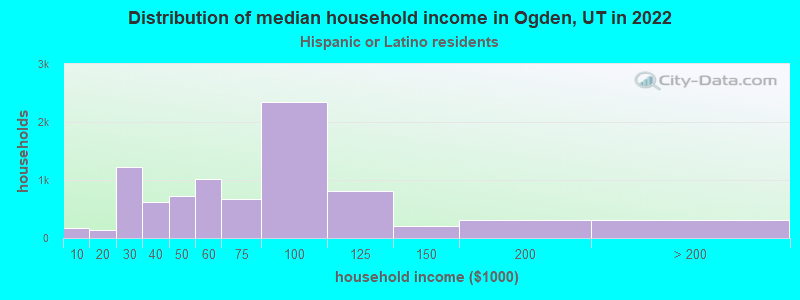
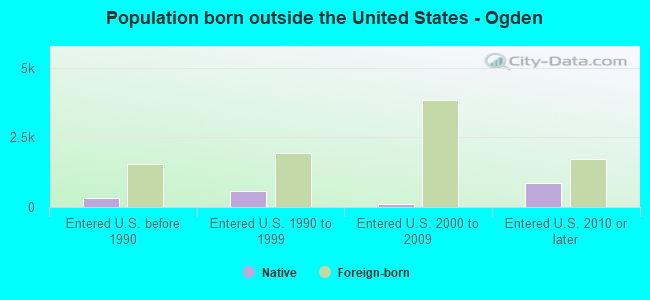
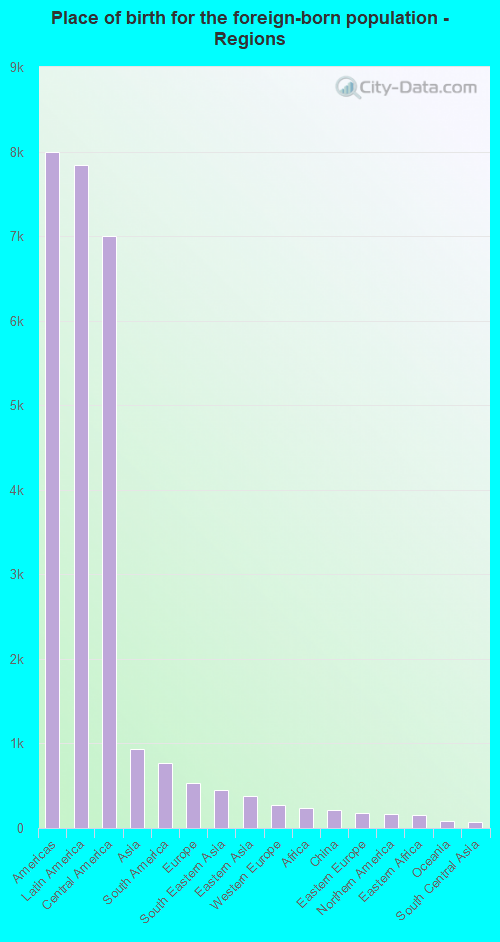
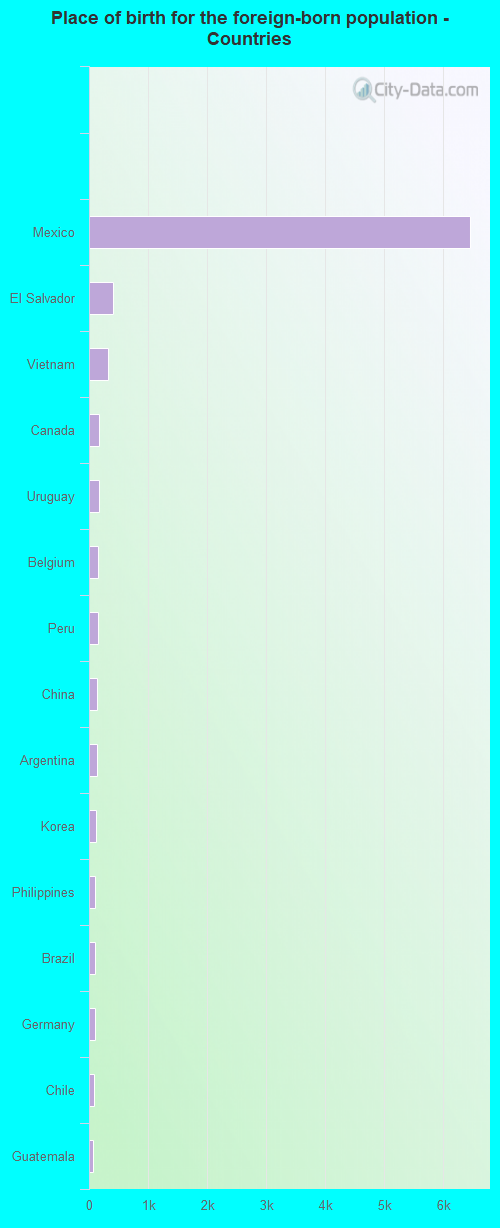
According to 2022 data, the most numerous races in Ogden, UT are White alone (54,271 residents), Hispanic (26,294 residents), and Two or more races (2,480 residents). 76.4% of Ogden residents speak English at home. 11.0% of Ogden, UT residents are foreign-born (8.5% born in Latin America), which is 27.2% greater than the foreign-born rate of 8.0% across the entire state of Utah.
Race distribution in Ogden
2000 2022
1,904,265 85.3% White alone 201,559 9.0% Hispanic 36,483 1.6% Asian alone 31,308 1.4% Two or more races 26,663 1.2% American Indian alone 14,806 0.7% Native Hawaiian and Other 16,137 0.7% Black alone 1,948 0.09% Other race alone
2,557,466 75.6% White alone 512,086 15.1% Hispanic 119,308 3.5% Two or more races 82,388 2.4% Asian alone 36,978 1.1% Native Hawaiian and Other 34,873 1.0% Black alone 22,803 0.7% American Indian alone 14,898 0.4% Other race alone
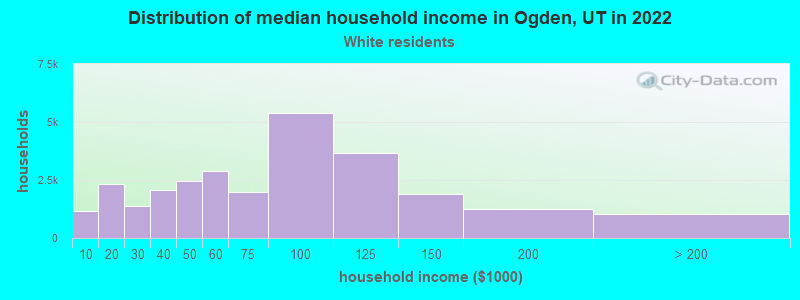
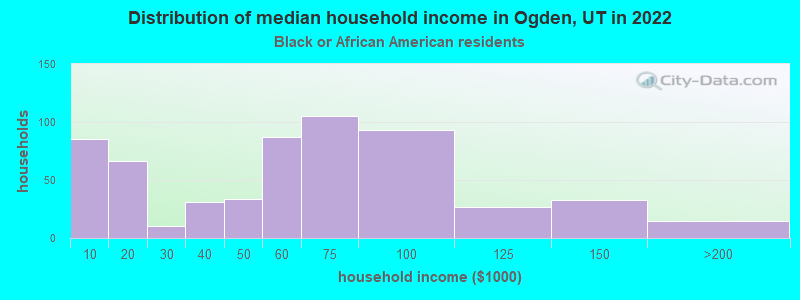
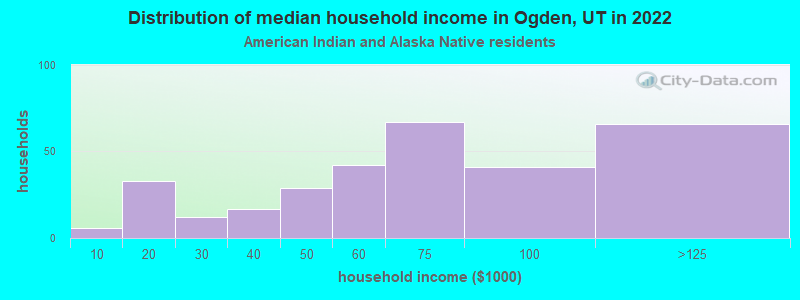
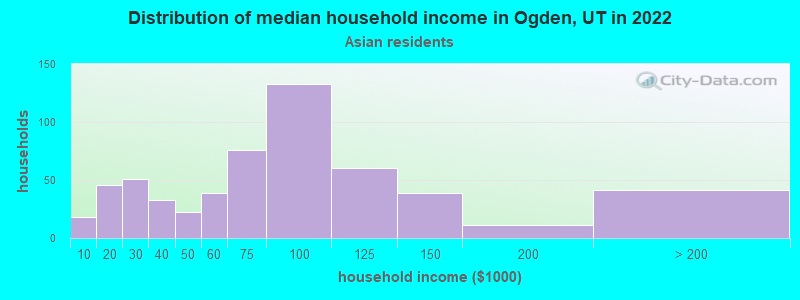
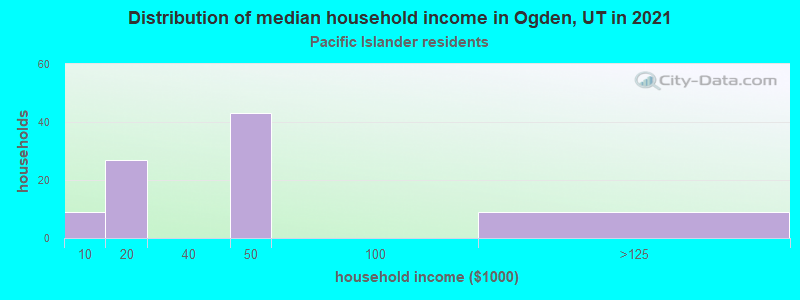
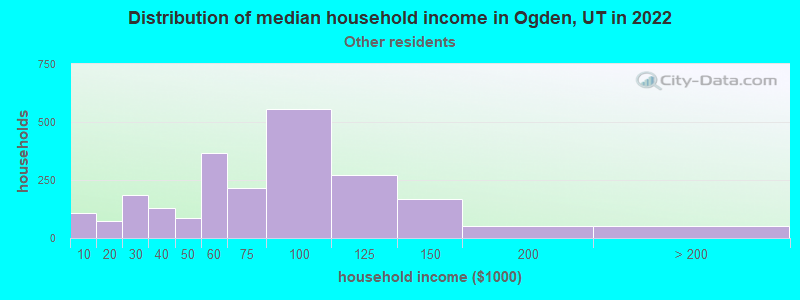
Income and house value in Ogden Median household income in 2022 $67,378 White non-Hispanic householders$71,797 Black householders$52,570 Asian householders$62,725 Some other race householders$75,058 Two or more races householders$72,657 Hispanic or Latino race householdersMedian 2022 house value $388,654 White Non-Hispanic householders$333,080 Black or African American householders$418,834 American Indian or Alaska Native householders $361,419 Asian householders$448,646 Native Hawaiian and other Pacific Islander householders$325,351 Some other race householders$368,044 Two or more races householders$323,879 Hispanic or Latino householders
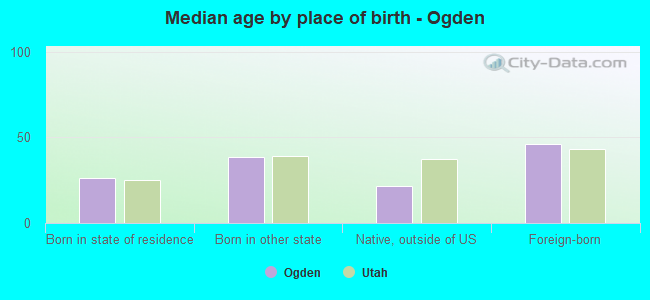
Median age by race in Ogden
34.0 Median age for White residents33.7 34.4 34.5 Median age for Black or African American residents46.7 34.2 30.5 Median age for American Indian / Alaska Native residents30.6 24.9 36.5 Median age for Asian residents33.7 41.8 35.9 Median age for Native Hawaiian / Pacific Islander residents62.4 -666,666,666.0 26.0 Median age for Other race residents27.1 23.5 35.4 Median age for Two or more races residents31.2 45.9 37.1 Median age for White alone residents35.5 40.2 27.2 Median age for Hispanic or Latino residents28.2 24.5
Owner/renter occupied households by race in Ogden
House owners and renters - White residents 16,522 60.3% Owner occupied10,893 39.7% Renter occupiedHouse owners and renters - Black or African American residents 231 35.1% Owner occupied427 64.9% Renter occupiedHouse owners and renters - American Indian / Alaska Native residents 160 62.6% Owner occupied96 37.4% Renter occupiedHouse owners and renters - Asian residents 184 52.6% Owner occupied166 47.4% Renter occupiedHouse owners and renters - Native Hawaiian / Pacific Islander residents 28 38.0% Owner occupied46 62.0% Renter occupiedHouse owners and renters - Other race residents 1,006 47.6% Owner occupied1,109 52.4% Renter occupiedHouse owners and renters - Two or more races residents 2,274 64.0% Owner occupied1,280 36.0% Renter occupiedHouse owners and renters - White alone residents 14,760 62.6% Owner occupied8,828 37.4% Renter occupiedHouse owners and renters - Hispanic or Latino residents 4,507 52.6% Owner occupied4,062 47.4% Renter occupied
Language usage in Ogden
English speakers - Total 76.4% of residents of Ogden speak English at home.
21.0% of residents speak Spanish at home 12,391 73.0% Speak English very well4,578 27.0% Speak English less than very well2.6% of residents speak other language at home 1,926 93.1% Speak English very well143 6.9% Speak English less than very well
English speakers - Born in the United States 82.6% of residents of Ogden speak English at home.
15.2% of residents speak Spanish at home 3,168 79.4% Speak English very well822 20.6% Speak English less than very well2.2% of residents speak other language at home 568 100.0% Speak English very well
English speakers - Native, born elsewhere 36.0% of residents of Ogden speak English at home.
64.0% of residents speak Spanish at home 855 74.2% Speak English very well297 25.8% Speak English less than very well
English speakers - Foreign-born 12.1% of residents of Ogden speak English at home.
76.2% of residents speak Spanish at home 4,285 62.2% Speak English very well2,609 37.8% Speak English less than very well11.7% of residents speak other language at home 912 86.4% Speak English very well143 13.6% Speak English less than very well
White (Caucasian) - Speak only English Native:
89.4% (52,842)Foreign-born:
15.1% (557)
White (Caucasian) - Speak another language Native:
10.6% (6,237)Foreign-born:
84.9% (3,143)
Black or African American - Speak only English Native:
87.9% (1,025)Foreign-born:
46.3% (121)
Black or African American - Speak another language Native:
6.2% (73)Foreign-born:
56.2% (147)
American Indian / Alaska Native - Speak only English Native:
55.7% (471)Foreign-born:
11.0% (20)
American Indian / Alaska Native - Speak another language Native:
45.1% (381)Foreign-born:
89.8% (166)
Asian - Speak only English Native:
79.2% (250)Foreign-born:
33.4% (319)
Asian - Speak another language Native:
22.1% (70)Foreign-born:
67.2% (642)
Native Hawaiian / Pacific Islander - Speak only English Native:
80.4% (198)Foreign-born:
38.8% (27)
Native Hawaiian / Pacific Islander - Speak another language Native:
16.3% (40)Foreign-born:
51.8% (36)
Other race - Speak only English Native:
37.1% (1,687)Foreign-born:
7.7% (144)
Other race - Speak another language Native:
62.9% (2,866)Foreign-born:
92.3% (1,730)
Two or more races - Speak only English Native:
72.3% (4,198)Foreign-born:
2.3% (54)
Two or more races - Speak another language Native:
27.7% (1,606)Foreign-born:
97.7% (2,336)
White alone - Speak only English Native:
97.3% (49,720)Foreign-born:
65.6% (557)
White alone - Speak another language Native:
2.7% (1,383)Foreign-born:
34.4% (292)
Hispanic or Latino - Speak only English Native:
41.8% (6,720)Foreign-born:
2.9% (198)
Hispanic or Latino - Speak another language Native:
58.2% (9,362)Foreign-born:
97.1% (6,724)
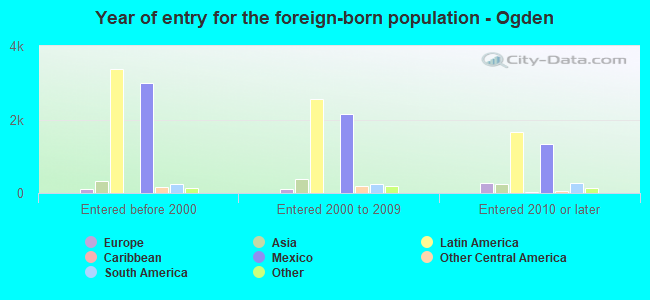
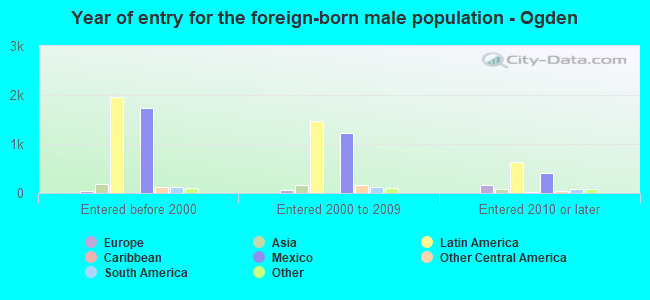
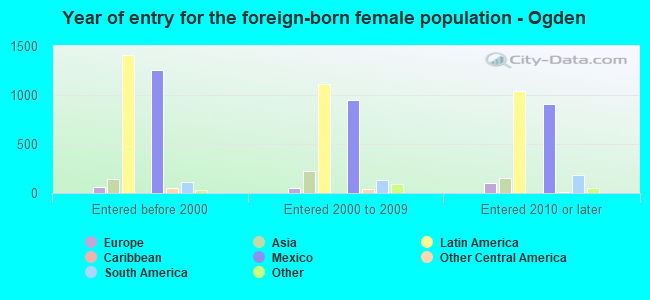
Foreign-born residents in Ogden 9,777 residents are foreign born (8.5% Latin America ).
Marital status for residents in Ogden Marital status - White (Caucasian) population 15 years and over
Males 40.7% Never married45.6% Now married2.0% Separated0.6% Widowed11.1% DivorcedFemales 30.2% Never married44.6% Now married0.8% Separated8.6% Widowed15.9% DivorcedWomen who gave birth in the past 12 months Now married:
55.8% (561)Unmarried:
44.2% (444)
Women who did not give birth in the past 12 months Now married:
46.3% (7,622)Unmarried:
53.7% (8,838)
Marital status - Black or African American population 15 years and over
Males 64.0% Never married14.0% Now married1.8% Separated0.0% Widowed20.3% DivorcedFemales 43.6% Never married20.6% Now married2.5% Separated5.8% Widowed27.5% DivorcedWomen who gave birth in the past 12 months Now married:
100.0% (8)Unmarried:
0.0% (0)
Women who did not give birth in the past 12 months Now married:
21.6% (105)Unmarried:
78.4% (381)
Marital status - American Indian / Alaska Native population 15 years and over
Males 52.4% Never married24.8% Now married5.6% Separated5.6% Widowed11.5% DivorcedFemales 42.4% Never married44.4% Now married2.6% Separated1.8% Widowed8.8% DivorcedWomen who did not give birth in the past 12 months Now married:
35.4% (92)Unmarried:
64.6% (167)
Marital status - Asian population 15 years and over
Males 52.2% Never married38.4% Now married4.5% Separated0.0% Widowed5.0% DivorcedFemales 23.6% Never married53.7% Now married3.8% Separated7.0% Widowed11.9% DivorcedWomen who did not give birth in the past 12 months Now married:
53.6% (198)Unmarried:
46.4% (171)
Marital status - Native Hawaiian / Pacific Islander population 15 years and over
Males 28.9% Never married58.6% Now married0.0% Separated0.0% Widowed12.5% DivorcedFemales 61.1% Never married38.9% Now married0.0% Separated0.0% Widowed0.0% DivorcedWomen who did not give birth in the past 12 months Now married:
26.6% (36)Unmarried:
73.4% (99)
Marital status - Other race population 15 years and over
Males 36.0% Never married47.2% Now married5.8% Separated0.0% Widowed11.0% DivorcedFemales 31.3% Never married46.1% Now married1.2% Separated5.2% Widowed16.1% DivorcedWomen who gave birth in the past 12 months Now married:
78.4% (165)Unmarried:
21.6% (45)
Women who did not give birth in the past 12 months Now married:
48.6% (831)Unmarried:
51.4% (877)
Marital status - Two or more races population 15 years and over
Males 44.0% Never married42.7% Now married0.0% Separated5.5% Widowed7.8% DivorcedFemales 14.4% Never married51.6% Now married2.7% Separated6.1% Widowed25.1% DivorcedWomen who gave birth in the past 12 months Now married:
100.0% (65)Unmarried:
0.0% (0)
Women who did not give birth in the past 12 months Now married:
34.8% (790)Unmarried:
65.2% (1,478)
Marital status - White alone, not Hispanic / Latino population 15 years and over
Males 41.0% Never married45.7% Now married1.7% Separated0.7% Widowed11.0% DivorcedFemales 27.3% Never married44.5% Now married0.9% Separated10.1% Widowed17.2% DivorcedWomen who gave birth in the past 12 months Now married:
91.0% (314)Unmarried:
9.0% (31)
Women who did not give birth in the past 12 months Now married:
47.0% (6,219)Unmarried:
53.0% (7,022)
Marital status - Hispanic or Latino population 15 years and over
Males 38.4% Never married43.8% Now married3.8% Separated2.3% Widowed11.7% DivorcedFemales 34.9% Never married46.3% Now married0.8% Separated2.0% Widowed16.0% DivorcedWomen who gave birth in the past 12 months Now married:
42.4% (304)Unmarried:
57.6% (413)
Women who did not give birth in the past 12 months Now married:
51.2% (3,157)Unmarried:
48.8% (3,007)
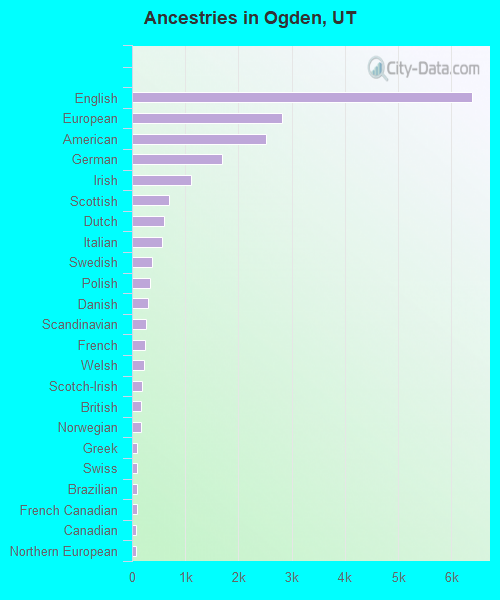
Ancestries in Ogden
6,385 15.7% English2,824 6.9% European2,509 6.2% American1,689 4.2% German1,107 2.7% Irish689 1.7% Scottish592 1.5% Dutch572 1.4% Italian377 0.9% Swedish341 0.8% Polish292 0.7% Danish267 0.7% Scandinavian242 0.6% French221 0.5% Welsh180 0.4% Scotch-Irish168 0.4% British161 0.4% Norwegian100 0.2% Greek96 0.2% Swiss94 0.2% Brazilian91 0.2% French Canadian82 0.2% Canadian77 0.2% Northern European58 0.1% Moroccan56 0.1% African55 0.1% Portuguese53 0.1% Eastern European46 0.1% Trinidadian and Tobagonian44 0.1% Nigerian40 0.10% Macedonian37 0.09% Haitian35 0.09% Basque35 0.09% Somali32 0.08% Ukrainian27 0.07% Jamaican26 0.06% Romanian24 0.06% Sudanese21 0.05% Russian20 0.05% Iranian19 0.05% Hungarian19 0.05% Finnish15 0.04% Czechoslovakian14 0.03% Bulgarian13 0.03% Croatian13 0.03% Czech13 0.03% Lebanese9 0.02% Lithuanian7 0.02% Liberian7 0.02% Armenian6 0.01% Slovene5 0.01% Belgian4 0.01% Australian
Geographical mobility in Ogden Same house 1 year ago 59,067 89.2% White (Caucasian)1,280 84.6% Black or African American866 81.7% American Indian / Alaska Native1,256 88.6% Asian240 74.6% Native Hawaiian / Pacific Islander7,274 93.4% Other race7,663 88.0% Two or more races47,850 88.5% White alone, not Hispanic / Latino23,232 91.2% Hispanic or LatinoMoved within same county 2,797 4.2% White / Caucasian91 6.0% Black or African American56 5.3% American Indian / Alaska Native63 4.4% Asian17 5.2% Native Hawaiian / Pacific Islander200 2.6% Other race528 6.1% Two or more races2,413 4.5% White alone, not Hispanic / Latino755 3.0% Hispanic or LatinoMoved within same state 2,853 4.3% White / Caucasian89 5.9% Black or African American30 2.8% American Indian / Alaska Native23 1.6% Asian22 6.8% Native Hawaiian / Pacific Islander221 2.8% Other race156 1.8% Two or more races2,334 4.3% White alone, not Hispanic / Latino1,000 3.9% Hispanic or LatinoMoved from different state 1,350 2.0% White / Caucasian74 4.9% Black or African American129 12.2% American Indian / Alaska Native41 2.9% Asian29 9.1% Native Hawaiian / Pacific Islander90 1.2% Other race238 2.7% Two or more races1,338 2.5% White alone, not Hispanic / Latino369 1.4% Hispanic or LatinoMoved from abroad 123 0.2% White44 3.1% Asian78 1.0% Other race124 1.4% Two or more races123 0.2% White alone, not Hispanic / Latino124 0.5% Hispanic or Latino
Children Nativity (place of birth) in Ogden
Children under 6 years - Living with two parents Both parents native 3,804 100.0% NativeBoth parents foreign-born 310 79.5% Native80 20.5% Foreign-bornOne native, one foreign-born parent 451 100.0% NativeChildren under 6 years - Living with one parent Native parent 1,640 97.2% Native48 2.8% Foreign-bornForeign-born parent 227 100.0% NativeChildren 6 to 17 years - Living with two parents Both parents native 5,823 98.5% Native88 1.5% Foreign-bornBoth parents foreign-born 1,572 86.7% Native242 13.3% Foreign-bornOne native, one foreign-born parent 1,318 98.7% Native18 1.3% Foreign-bornChildren 6 to 17 years - Living with one parent Native parent 2,895 100.0% NativeForeign-born parent 462 51.0% Native444 49.0% Foreign-born
Grandparents responsible for own grandchildren in Ogden
Grandparents (30 to 59 years) White / Caucasian 313 56.4% Responsible for grandchildren242 43.6% Not responsible for grandchildrenAmerican Indian / Alaska Native 15 76.6% Responsible for grandchildren5 23.4% Not responsible for grandchildrenAsian 5 100.0% Responsible for grandchildrenOther race 26 9.8% Responsible for grandchildren239 90.2% Not responsible for grandchildrenTwo or more races 79 66.3% Responsible for grandchildren40 33.7% Not responsible for grandchildrenWhite alone, not Hispanic / Latino 94 37.8% Responsible for grandchildren155 62.2% Not responsible for grandchildrenHispanic or Latino 178 35.6% Responsible for grandchildren322 64.4% Not responsible for grandchildrenGrandparents (60 years and over) White / Caucasian 305 38.5% Responsible for grandchildren488 61.5% Not responsible for grandchildrenAsian 9 65.7% Responsible for grandchildren5 34.3% Not responsible for grandchildrenOther race 18 100.0% Not responsible for grandchildrenTwo or more races 166 100.0% Not responsible for grandchildrenWhite alone, not Hispanic / Latino 305 38.5% Responsible for grandchildren488 61.5% Not responsible for grandchildrenHispanic or Latino 2 1.8% Responsible for grandchildren129 98.2% Not responsible for grandchildren