Races in Okemos, Michigan (MI) Detailed Stats
Data:
Races - White alone (%)
Races - White alone (% change since 2000)
Races - Black alone (%)
Races - Black alone (% change since 2000)
Races - American Indian alone (%)
Races - American Indian alone (% change since 2000)
Races - Asian alone (%)
Races - Asian alone (% change since 2000)
Races - Hispanic (%)
Races - Hispanic (% change since 2000)
Races - Native Hawaiian and Other Pacific Islander alone (%)
Races - Native Hawaiian and Other Pacific Islander alone (% change since 2000)
Races - Two or more races(%)
Races - Two or more races(% change since 2000)
Races - Other race alone (%)
Races - Other race alone (% change since 2000)
Racial diversity
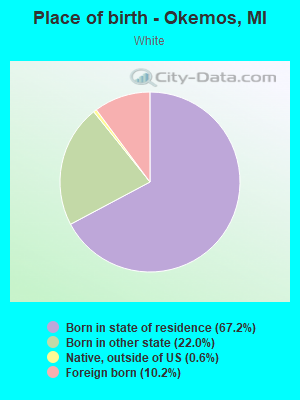
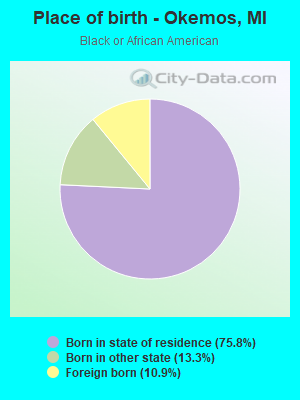
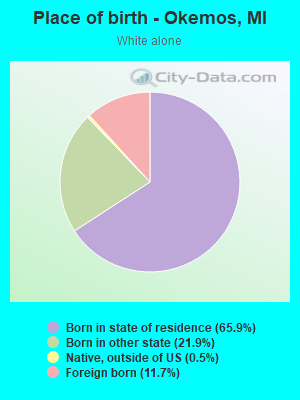
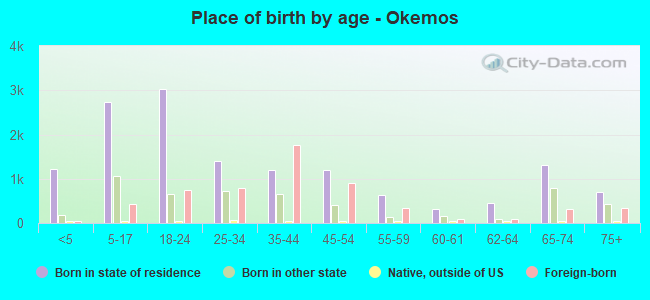
Place of birth - Born in state of residence (%)
Place of birth - Born in state of residence (%) - White
Place of birth - Born in state of residence (%) - Black or African American
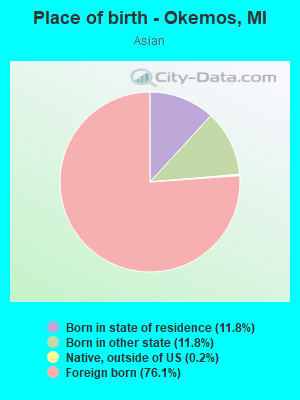
Place of birth - Born in state of residence (%) - Asian
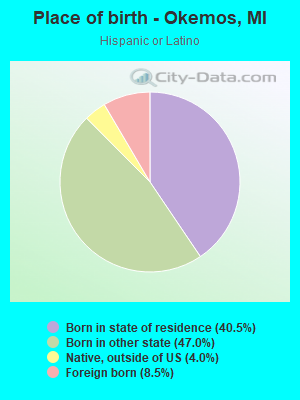
Place of birth - Born in state of residence (%) - Hispanic or Latino
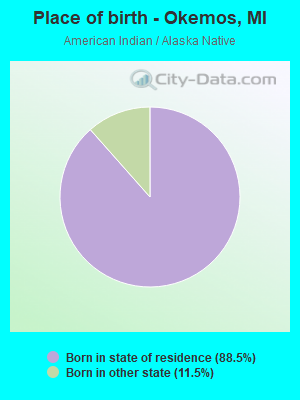
Place of birth - Born in state of residence (%) - American Indian and Alaska Native
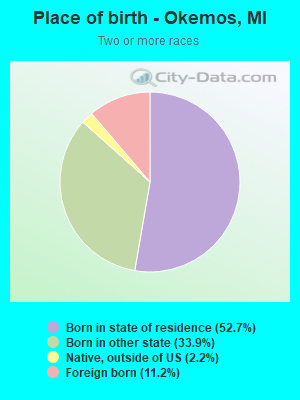
Place of birth - Born in state of residence (%) - Multirace
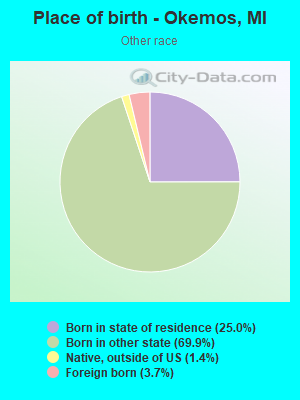
Place of birth - Born in state of residence (%) - Other Race
Place of birth - Born in other state (%)
Place of birth - Born in other state (%) - White
Place of birth - Born in other state (%) - Black or African American
Place of birth - Born in other state (%) - Asian
Place of birth - Born in other state (%) - Hispanic or Latino
Place of birth - Born in other state (%) - American Indian and Alaska Native
Place of birth - Born in other state (%) - Multirace
Place of birth - Born in other state (%) - Other Race
Place of birth - Native, outside of US (%)
Place of birth - Native, outside of US (%) - White
Place of birth - Native, outside of US (%) - Black or African American
Place of birth - Native, outside of US (%) - Asian
Place of birth - Native, outside of US (%) - Hispanic or Latino
Place of birth - Native, outside of US (%) - American Indian and Alaska Native
Place of birth - Native, outside of US (%) - Multirace
Place of birth - Native, outside of US (%) - Other Race
Place of birth - Foreign born (%)
Place of birth - Foreign born (%) - White
Place of birth - Foreign born (%) - Black or African American
Place of birth - Foreign born (%) - Asian
Place of birth - Foreign born (%) - Hispanic or Latino
Place of birth - Foreign born (%) - American Indian and Alaska Native
Place of birth - Foreign born (%) - Multirace
Place of birth - Foreign born (%) - Other Race
Residents speaking English at home (%)
Residents speaking English at home - Born in the United States (%)
Residents speaking English at home - Native, born elsewhere (%)
Residents speaking English at home - Foreign born (%)
Residents speaking Spanish at home (%)
Residents speaking Spanish at home - Born in the United States (%)
Residents speaking Spanish at home - Native, born elsewhere (%)
Residents speaking Spanish at home - Foreign born (%)
Residents speaking other language at home (%)
Residents speaking other language at home - Born in the United States (%)
Residents speaking other language at home - Native, born elsewhere (%)
Residents speaking other language at home - Foreign born (%)
Marital status - Never married (%)
Marital status - Now married (%)
Marital status - Separated (%)
Marital status - Widowed (%)
Marital status - Divorced (%)
Ancestries Reported - Arab (%)
Ancestries Reported - Czech (%)
Ancestries Reported - Danish (%)
Ancestries Reported - Dutch (%)
Ancestries Reported - English (%)
Ancestries Reported - French (%)
Ancestries Reported - French Canadian (%)
Ancestries Reported - German (%)
Ancestries Reported - Greek (%)
Ancestries Reported - Hungarian (%)
Ancestries Reported - Irish (%)
Ancestries Reported - Italian (%)
Ancestries Reported - Lithuanian (%)
Ancestries Reported - Norwegian (%)
Ancestries Reported - Polish (%)
Ancestries Reported - Portuguese (%)
Ancestries Reported - Russian (%)
Ancestries Reported - Scotch-Irish (%)
Ancestries Reported - Scottish (%)
Ancestries Reported - Slovak (%)
Ancestries Reported - Subsaharan African (%)
Ancestries Reported - Swedish (%)
Ancestries Reported - Swiss (%)
Ancestries Reported - Ukrainian (%)
Ancestries Reported - United States (%)
Ancestries Reported - Welsh (%)
Ancestries Reported - West Indian (%)
Ancestries Reported - Other (%)
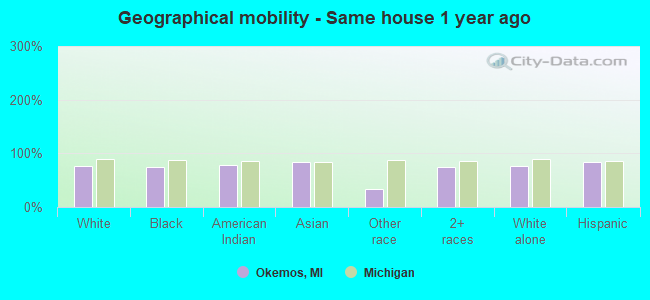
Geographical mobility - Same house 1 year ago (%)
Geographical mobility - Same house 1 year ago (%) - White
Geographical mobility - Same house 1 year ago (%) - Black or African American
Geographical mobility - Same house 1 year ago (%) - Asian
Geographical mobility - Same house 1 year ago (%) - Hispanic or Latino
Geographical mobility - Same house 1 year ago (%) - American Indian and Alaska Native
Geographical mobility - Same house 1 year ago (%) - Multirace
Geographical mobility - Same house 1 year ago (%) - Other Race
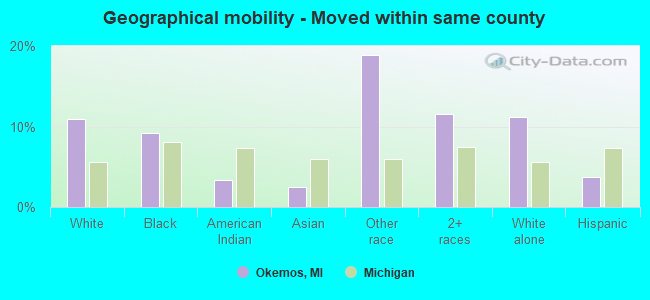
Geographical mobility - Moved within same county (%)
Geographical mobility - Moved within same county (%) - White
Geographical mobility - Moved within same county (%) - Black or African American
Geographical mobility - Moved within same county (%) - Asian
Geographical mobility - Moved within same county (%) - Hispanic or Latino
Geographical mobility - Moved within same county (%) - American Indian and Alaska Native
Geographical mobility - Moved within same county (%) - Multirace
Geographical mobility - Moved within same county (%) - Other Race
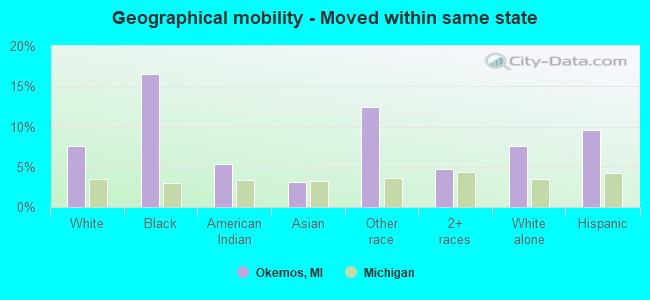
Geographical mobility - Moved from different county within same state (%)
Geographical mobility - Moved from different county within same state (%) - White
Geographical mobility - Moved from different county within same state (%) - Black or African American
Geographical mobility - Moved from different county within same state (%) - Asian
Geographical mobility - Moved from different county within same state (%) - Hispanic or Latino
Geographical mobility - Moved from different county within same state (%) - American Indian and Alaska Native
Geographical mobility - Moved from different county within same state (%) - Multirace
Geographical mobility - Moved from different county within same state (%) - Other Race
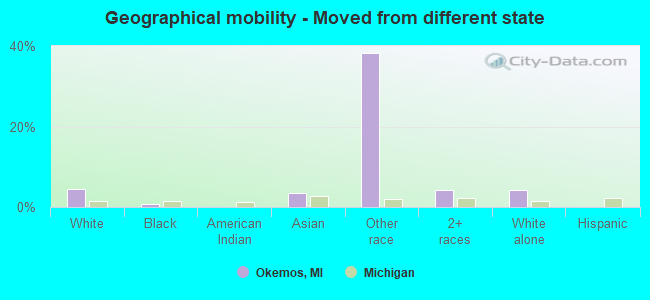
Geographical mobility - Moved from different state (%)
Geographical mobility - Moved from different state (%) - White
Geographical mobility - Moved from different state (%) - Black or African American
Geographical mobility - Moved from different state (%) - Asian
Geographical mobility - Moved from different state (%) - Hispanic or Latino
Geographical mobility - Moved from different state (%) - American Indian and Alaska Native
Geographical mobility - Moved from different state (%) - Multirace
Geographical mobility - Moved from different state (%) - Other Race
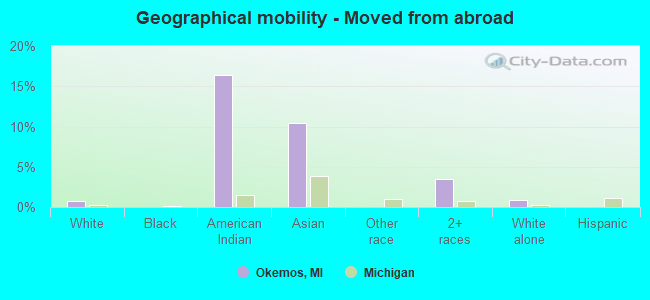
Geographical mobility - Moved from abroad (%)
Geographical mobility - Moved from abroad (%) - White
Geographical mobility - Moved from abroad (%) - Black or African American
Geographical mobility - Moved from abroad (%) - Asian
Geographical mobility - Moved from abroad (%) - Hispanic or Latino
Geographical mobility - Moved from abroad (%) - American Indian and Alaska Native
Geographical mobility - Moved from abroad (%) - Multirace
Geographical mobility - Moved from abroad (%) - Other Race
Place of birth for the foreign-born population - Ireland (%)
Place of birth for the foreign-born population - Denmark (%)
Place of birth for the foreign-born population - Norway (%)
Place of birth for the foreign-born population - Sweden (%)
Place of birth for the foreign-born population - United Kingdom (%)
Place of birth for the foreign-born population - England (%)
Place of birth for the foreign-born population - Scotland (%)
Place of birth for the foreign-born population - Other Northern Europe (%)
Place of birth for the foreign-born population - Austria (%)
Place of birth for the foreign-born population - Belgium (%)
Place of birth for the foreign-born population - France (%)
Place of birth for the foreign-born population - Germany (%)
Place of birth for the foreign-born population - Netherlands (%)
Place of birth for the foreign-born population - Switzerland (%)
Place of birth for the foreign-born population - Other Western Europe (%)
Place of birth for the foreign-born population - Greece (%)
Place of birth for the foreign-born population - Italy (%)
Place of birth for the foreign-born population - Portugal (%)
Place of birth for the foreign-born population - Spain (%)
Place of birth for the foreign-born population - Other Southern Europe (%)
Place of birth for the foreign-born population - Albania (%)
Place of birth for the foreign-born population - Belarus (%)
Place of birth for the foreign-born population - Bosnia and Herzegovina (%)
Place of birth for the foreign-born population - Bulgaria (%)
Place of birth for the foreign-born population - Croatia (%)
Place of birth for the foreign-born population - Czechoslovakia (%)
Place of birth for the foreign-born population - Hungary (%)
Place of birth for the foreign-born population - Latvia (%)
Place of birth for the foreign-born population - Lithuania (%)
Place of birth for the foreign-born population - North Macedonia (Macedonia) (%)
Place of birth for the foreign-born population - Moldova (%)
Place of birth for the foreign-born population - Poland (%)
Place of birth for the foreign-born population - Romania (%)
Place of birth for the foreign-born population - Russia (%)
Place of birth for the foreign-born population - Serbia (%)
Place of birth for the foreign-born population - Ukraine (%)
Place of birth for the foreign-born population - Other Eastern Europe (%)
Place of birth for the foreign-born population - China (%)
Place of birth for the foreign-born population - Hong Kong (%)
Place of birth for the foreign-born population - Taiwan (%)
Place of birth for the foreign-born population - Japan (%)
Place of birth for the foreign-born population - Korea (%)
Place of birth for the foreign-born population - Other Eastern Asia (%)
Place of birth for the foreign-born population - Afghanistan (%)
Place of birth for the foreign-born population - Bangladesh (%)
Place of birth for the foreign-born population - India (%)
Place of birth for the foreign-born population - Iran (%)
Place of birth for the foreign-born population - Kazakhstan (%)
Place of birth for the foreign-born population - Nepal (%)
Place of birth for the foreign-born population - Pakistan (%)
Place of birth for the foreign-born population - Sri Lanka (%)
Place of birth for the foreign-born population - Uzbekistan (%)
Place of birth for the foreign-born population - Other South Central Asia (%)
Place of birth for the foreign-born population - Burma (%)
Place of birth for the foreign-born population - Cambodia (%)
Place of birth for the foreign-born population - Indonesia (%)
Place of birth for the foreign-born population - Laos (%)
Place of birth for the foreign-born population - Malaysia (%)
Place of birth for the foreign-born population - Philippines (%)
Place of birth for the foreign-born population - Singapore (%)
Place of birth for the foreign-born population - Thailand (%)
Place of birth for the foreign-born population - Vietnam (%)
Place of birth for the foreign-born population - Other South Eastern Asia (%)
Place of birth for the foreign-born population - Armenia (%)
Place of birth for the foreign-born population - Iraq (%)
Place of birth for the foreign-born population - Israel (%)
Place of birth for the foreign-born population - Jordan (%)
Place of birth for the foreign-born population - Kuwait (%)
Place of birth for the foreign-born population - Lebanon (%)
Place of birth for the foreign-born population - Saudi Arabia (%)
Place of birth for the foreign-born population - Syria (%)
Place of birth for the foreign-born population - Turkey (%)
Place of birth for the foreign-born population - Yemen (%)
Place of birth for the foreign-born population - Other Western Asia (%)
Place of birth for the foreign-born population - Eritrea (%)
Place of birth for the foreign-born population - Ethiopia (%)
Place of birth for the foreign-born population - Kenya (%)
Place of birth for the foreign-born population - Somalia (%)
Place of birth for the foreign-born population - Uganda (%)
Place of birth for the foreign-born population - Zimbabwe (%)
Place of birth for the foreign-born population - Other Eastern Africa (%)
Place of birth for the foreign-born population - Cameroon (%)
Place of birth for the foreign-born population - Congo (%)
Place of birth for the foreign-born population - Democratic Republic of Congo (Zaire) (%)
Place of birth for the foreign-born population - Other Middle Africa (%)
Place of birth for the foreign-born population - Egypt (%)
Place of birth for the foreign-born population - Morocco (%)
Place of birth for the foreign-born population - Sudan (%)
Place of birth for the foreign-born population - Other Northern Africa (%)
Place of birth for the foreign-born population - South Africa (%)
Place of birth for the foreign-born population - Other Southern Africa (%)
Place of birth for the foreign-born population - Cabo Verde (%)
Place of birth for the foreign-born population - Ghana (%)
Place of birth for the foreign-born population - Liberia (%)
Place of birth for the foreign-born population - Nigeria (%)
Place of birth for the foreign-born population - Senegal (%)
Place of birth for the foreign-born population - Sierra Leone (%)
Place of birth for the foreign-born population - Other Western Africa (%)
Place of birth for the foreign-born population - Australia (%)
Place of birth for the foreign-born population - New Zealand (%)
Place of birth for the foreign-born population - Fiji (%)
Place of birth for the foreign-born population - Micronesia (%)
Place of birth for the foreign-born population - Bahamas (%)
Place of birth for the foreign-born population - Barbados (%)
Place of birth for the foreign-born population - Cuba (%)
Place of birth for the foreign-born population - Dominica (%)
Place of birth for the foreign-born population - Dominican Republic (%)
Place of birth for the foreign-born population - Grenada (%)
Place of birth for the foreign-born population - Haiti (%)
Place of birth for the foreign-born population - Jamaica (%)
Place of birth for the foreign-born population - St. Vincent and the Grenadines (%)
Place of birth for the foreign-born population - Trinidad and Tobago (%)
Place of birth for the foreign-born population - West Indies (%)
Place of birth for the foreign-born population - Other Caribbean (%)
Place of birth for the foreign-born population - Belize (%)
Place of birth for the foreign-born population - Costa Rica (%)
Place of birth for the foreign-born population - El Salvador (%)
Place of birth for the foreign-born population - Guatemala (%)
Place of birth for the foreign-born population - Honduras (%)
Place of birth for the foreign-born population - Mexico (%)
Place of birth for the foreign-born population - Nicaragua (%)
Place of birth for the foreign-born population - Panama (%)
Place of birth for the foreign-born population - Other Central America (%)
Place of birth for the foreign-born population - Argentina (%)
Place of birth for the foreign-born population - Bolivia (%)
Place of birth for the foreign-born population - Brazil (%)
Place of birth for the foreign-born population - Chile (%)
Place of birth for the foreign-born population - Colombia (%)
Place of birth for the foreign-born population - Ecuador (%)
Place of birth for the foreign-born population - Guyana (%)
Place of birth for the foreign-born population - Peru (%)
Place of birth for the foreign-born population - Uruguay (%)
Place of birth for the foreign-born population - Venezuela (%)
Place of birth for the foreign-born population - Other South America (%)
Place of birth for the foreign-born population - Canada (%)
Place of birth for the foreign-born population - Other Northern America (%)
Place of birth for the foreign-born population - Other (%)
Latest news about races in Okemos, MI collected exclusively by city-data.com from local newspapers, TV, and radio stations
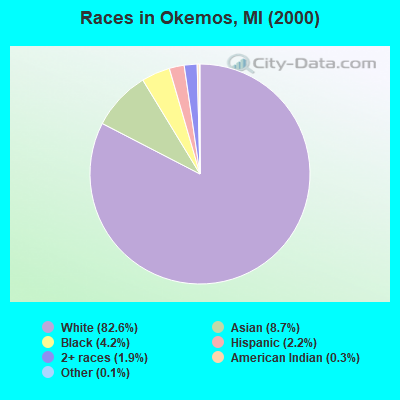
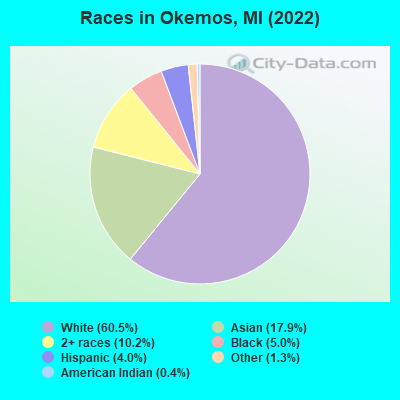
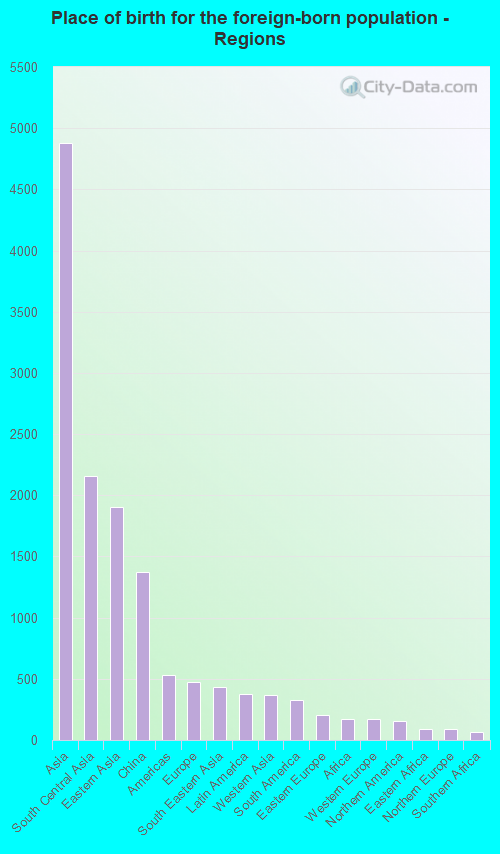
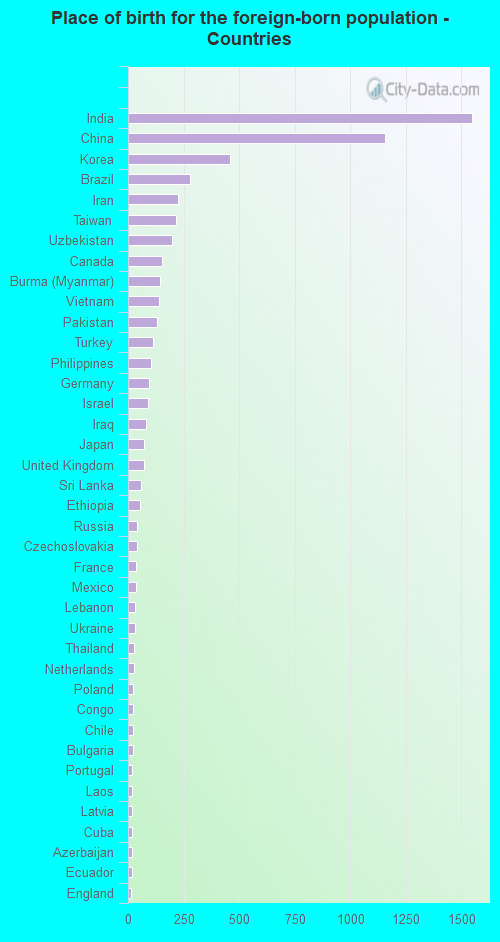
According to 2022 data, the most numerous races in Okemos, MI are White alone (15,549 residents), Black alone (1,288 residents), and Hispanic (1,024 residents). 71.5% of Okemos residents speak English at home. 23.6% of Okemos, MI residents are foreign-born (19.1% born in Asia), which is 74.6% greater than the foreign-born rate of 6.0% across the entire state of Michigan.
Race distribution in Okemos
2000 2022
7,806,691 78.6% White alone 1,402,047 14.1% Black alone 323,877 3.3% Hispanic 175,311 1.8% Asian alone 163,487 1.6% Two or more races 53,421 0.5% American Indian alone 11,465 0.1% Other race alone 2,145 0.02% Native Hawaiian and Other
7,289,051 72.6% White alone 1,310,464 13.1% Black alone 572,405 5.7% Hispanic 450,031 4.5% Two or more races 335,732 3.3% Asian alone 45,217 0.5% Other race alone 29,011 0.3% American Indian alone 2,207 0.02% Native Hawaiian and Other
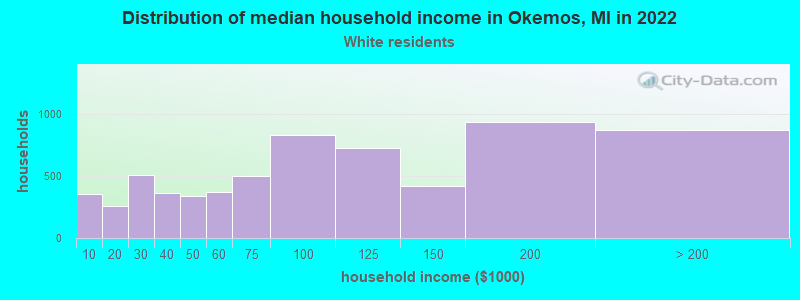
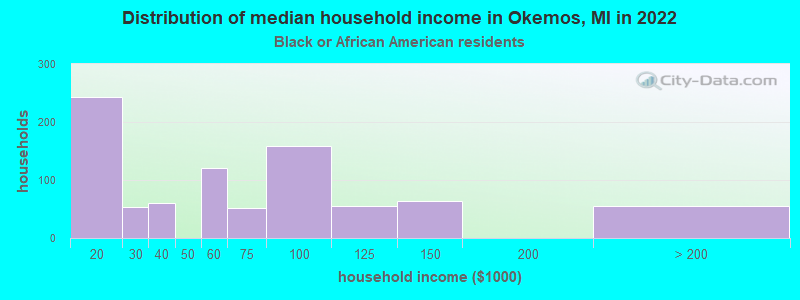
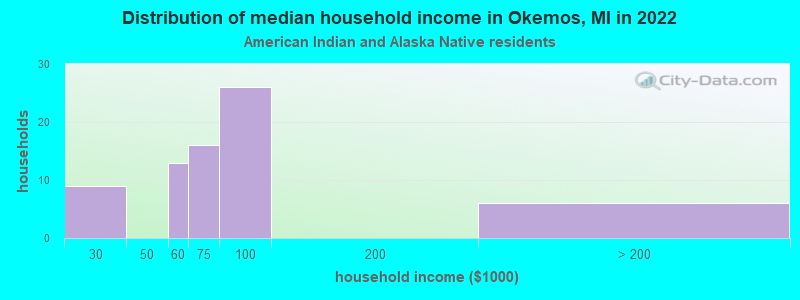
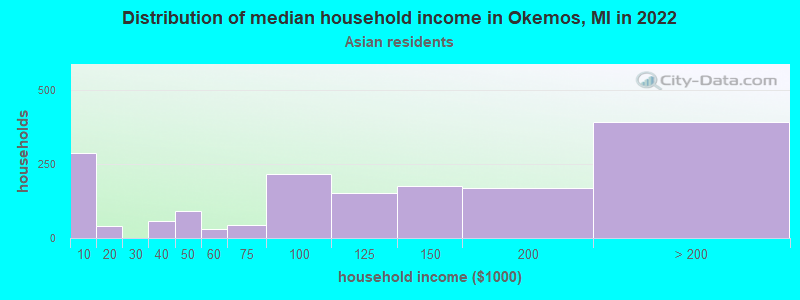
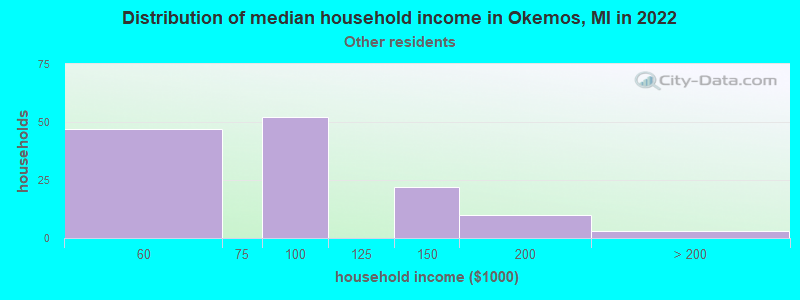
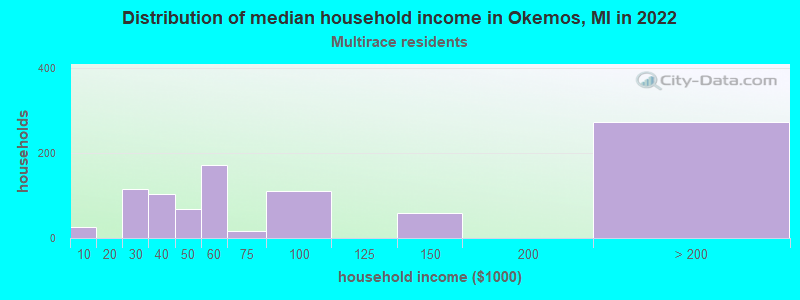
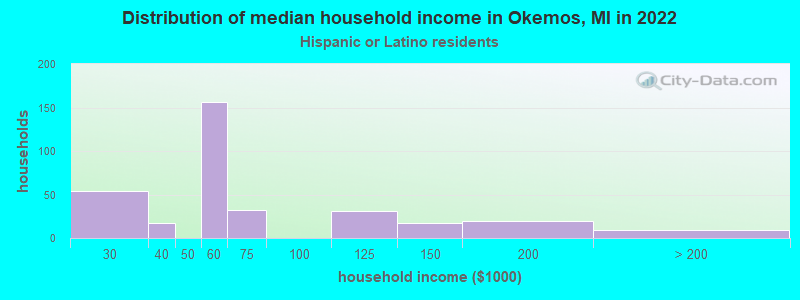
Income and house value in Okemos Median household income in 2022 $89,795 White non-Hispanic householders$55,911 Black householders$68,945 American Indian and Alaska Native householders$109,525 Asian householders$85,161 Some other race householders$56,494 Two or more races householders$53,865 Hispanic or Latino race householdersMedian 2022 house value $338,960 White Non-Hispanic householders$318,133 Black or African American householders$229,285 American Indian or Alaska Native householders $325,967 Asian householders$310,490 Some other race householders$233,488 Two or more races householders$345,838 Hispanic or Latino householders
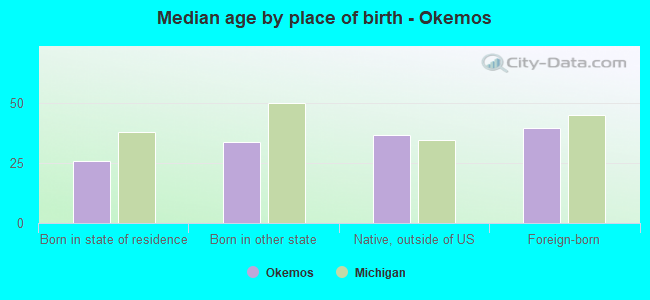
Median age by race in Okemos
36.7 Median age for White residents36.1 38.3 29.4 Median age for Black or African American residents29.1 28.3 45.7 Median age for American Indian / Alaska Native residents43.0 63.3 35.7 Median age for Asian residents35.5 34.7 -666,666,666.0 Median age for Native Hawaiian / Pacific Islander residents-666,666,666.0 -666,666,666.0 28.7 Median age for Other race residents25.4 21.4 24.5 Median age for Two or more races residents19.5 24.4 37.5 Median age for White alone residents36.5 38.6 27.1 Median age for Hispanic or Latino residents28.6 26.9
Owner/renter occupied households by race in Okemos
House owners and renters - White residents 4,184 62.7% Owner occupied2,488 37.3% Renter occupiedHouse owners and renters - Black or African American residents 174 24.3% Owner occupied543 75.7% Renter occupiedHouse owners and renters - American Indian / Alaska Native residents 45 61.2% Owner occupied29 38.8% Renter occupiedHouse owners and renters - Asian residents 1,317 66.7% Owner occupied658 33.3% Renter occupiedHouse owners and renters - Other race residents 91 44.8% Owner occupied112 55.2% Renter occupiedHouse owners and renters - Two or more races residents 475 50.3% Owner occupied469 49.7% Renter occupiedHouse owners and renters - White alone residents 4,157 62.8% Owner occupied2,464 37.2% Renter occupiedHouse owners and renters - Hispanic or Latino residents 111 29.3% Owner occupied269 70.7% Renter occupied
Language usage in Okemos
English speakers - Total 71.5% of residents of Okemos speak English at home.
2.1% of residents speak Spanish at home 448 86.8% Speak English very well68 13.2% Speak English less than very well26.6% of residents speak other language at home 4,922 76.4% Speak English very well1,521 23.6% Speak English less than very well
English speakers - Born in the United States 80.1% of residents of Okemos speak English at home.
5.5% of residents speak Spanish at home 170 61.2% Speak English very well108 38.8% Speak English less than very well15.0% of residents speak other language at home 669 88.6% Speak English very well86 11.4% Speak English less than very well
English speakers - Native, born elsewhere 50.8% of residents of Okemos speak English at home.
34.0% of residents speak Spanish at home 65 100.0% Speak English very well38.2% of residents speak other language at home 71 97.3% Speak English very well2 2.7% Speak English less than very well
English speakers - Foreign-born 17.9% of residents of Okemos speak English at home.
2.4% of residents speak Spanish at home 133 95.7% Speak English very well6 4.3% Speak English less than very well79.4% of residents speak other language at home 3,340 71.2% Speak English very well1,350 28.8% Speak English less than very well
White (Caucasian) - Speak only English Native:
94.8% (12,695)Foreign-born:
36.2% (579)
White (Caucasian) - Speak another language Native:
5.3% (705)Foreign-born:
64.1% (1,025)
Black or African American - Speak only English Native:
95.8% (1,175)Foreign-born:
24.0% (38)
Black or African American - Speak another language Native:
3.0% (37)Foreign-born:
89.1% (142)
Asian - Speak only English Native:
34.7% (288)Foreign-born:
11.3% (401)
Asian - Speak another language Native:
65.9% (546)Foreign-born:
88.6% (3,144)
Other race - Speak only English Native:
67.0% (327)Foreign-born:
100.0% (23)
Two or more races - Speak only English Native:
77.0% (1,696)Foreign-born:
8.3% (29)
Two or more races - Speak another language Native:
24.1% (530)Foreign-born:
81.3% (288)
White alone - Speak only English Native:
95.0% (12,562)Foreign-born:
30.1% (556)
White alone - Speak another language Native:
5.4% (718)Foreign-born:
70.2% (1,296)
Hispanic or Latino - Speak only English Native:
56.8% (479)Foreign-born:
68.7% (66)
Hispanic or Latino - Speak another language Native:
44.9% (378)Foreign-born:
58.9% (57)
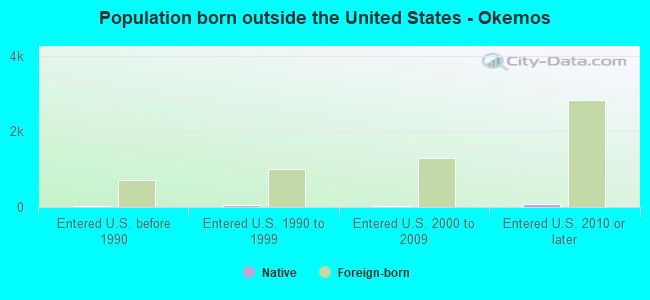
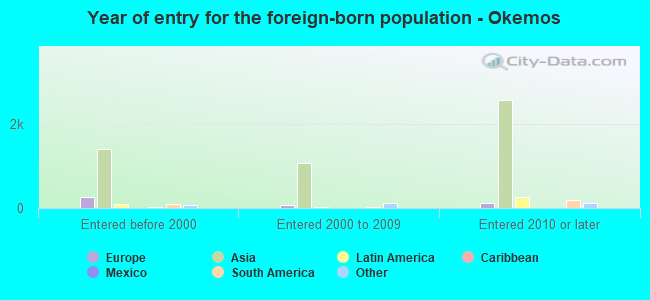
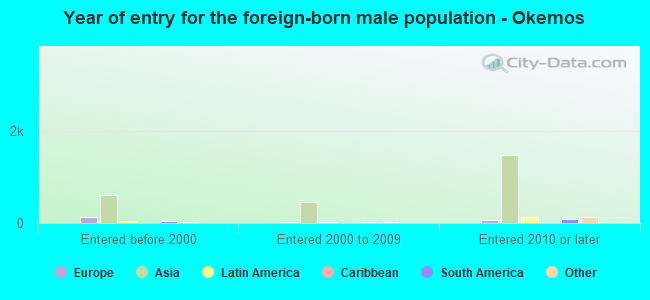
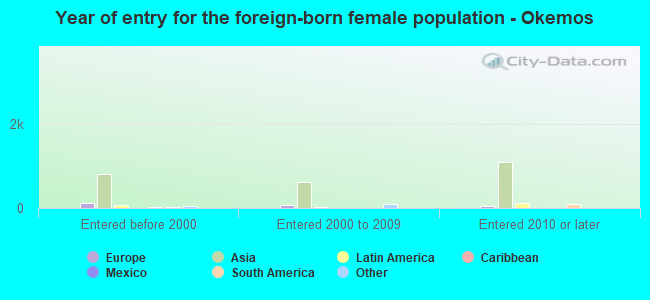
Foreign-born residents in Okemos 6,063 residents are foreign born (19.1% Asia ).
This city:
23.6%Michigan:
6.9%
Marital status for residents in Okemos Marital status - White (Caucasian) population 15 years and over
Males 39.0% Never married52.0% Now married0.0% Separated1.7% Widowed7.2% DivorcedFemales 30.9% Never married52.0% Now married0.4% Separated7.7% Widowed9.1% DivorcedWomen who gave birth in the past 12 months Now married:
100.0% (96)Unmarried:
0.0% (0)
Women who did not give birth in the past 12 months Now married:
36.9% (1,257)Unmarried:
63.1% (2,151)
Marital status - Black or African American population 15 years and over
Males 54.9% Never married27.4% Now married0.0% Separated2.1% Widowed15.7% DivorcedFemales 55.6% Never married17.6% Now married0.0% Separated10.9% Widowed15.9% DivorcedWomen who did not give birth in the past 12 months Now married:
12.5% (70)Unmarried:
87.5% (490)
Marital status - American Indian / Alaska Native population 15 years and over
Males 14.0% Never married35.5% Now married0.0% Separated0.0% Widowed50.5% DivorcedFemales 43.9% Never married19.3% Now married0.0% Separated0.0% Widowed36.8% DivorcedWomen who did not give birth in the past 12 months Now married:
23.4% (11)Unmarried:
76.6% (37)
Marital status - Asian population 15 years and over
Males 29.9% Never married64.7% Now married0.0% Separated2.2% Widowed3.2% DivorcedFemales 27.2% Never married62.7% Now married0.0% Separated4.3% Widowed5.8% DivorcedWomen who gave birth in the past 12 months Now married:
100.0% (102)Unmarried:
0.0% (0)
Women who did not give birth in the past 12 months Now married:
62.3% (922)Unmarried:
37.7% (559)
Marital status - Other race population 15 years and over
Males 33.3% Never married66.7% Now married0.0% Separated0.0% Widowed0.0% DivorcedFemales 0.0% Never married68.2% Now married31.8% Separated0.0% Widowed0.0% DivorcedWomen who did not give birth in the past 12 months Now married:
100.0% (154)Unmarried:
0.0% (0)
Marital status - Two or more races population 15 years and over
Males 50.1% Never married43.3% Now married0.0% Separated0.0% Widowed6.5% DivorcedFemales 75.0% Never married17.7% Now married1.0% Separated0.0% Widowed6.2% DivorcedWomen who gave birth in the past 12 months Now married:
100.0% (104)Unmarried:
0.0% (0)
Women who did not give birth in the past 12 months Now married:
3.9% (46)Unmarried:
96.1% (1,144)
Marital status - White alone, not Hispanic / Latino population 15 years and over
Males 38.0% Never married52.7% Now married0.0% Separated1.8% Widowed7.4% DivorcedFemales 30.6% Never married52.3% Now married0.4% Separated7.9% Widowed8.9% DivorcedWomen who gave birth in the past 12 months Now married:
100.0% (100)Unmarried:
0.0% (0)
Women who did not give birth in the past 12 months Now married:
36.8% (1,233)Unmarried:
63.2% (2,118)
Marital status - Hispanic or Latino population 15 years and over
Males 60.4% Never married30.9% Now married0.0% Separated0.0% Widowed8.7% DivorcedFemales 44.4% Never married36.3% Now married8.4% Separated0.0% Widowed11.0% DivorcedWomen who gave birth in the past 12 months Now married:
100.0% (12)Unmarried:
0.0% (0)
Women who did not give birth in the past 12 months Now married:
40.7% (172)Unmarried:
59.3% (251)
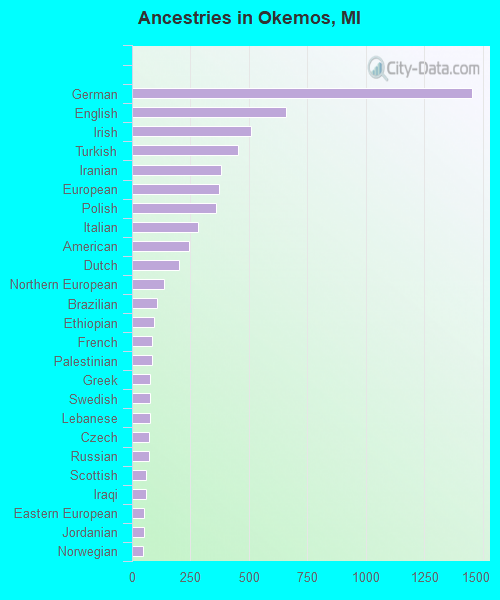
Ancestries in Okemos
1,455 11.8% German659 5.4% English509 4.1% Irish455 3.7% Turkish383 3.1% Iranian372 3.0% European360 2.9% Polish283 2.3% Italian244 2.0% American200 1.6% Dutch136 1.1% Northern European109 0.9% Brazilian93 0.8% Ethiopian85 0.7% French85 0.7% Palestinian77 0.6% Greek77 0.6% Swedish75 0.6% Lebanese73 0.6% Czech72 0.6% Russian61 0.5% Scottish59 0.5% Iraqi53 0.4% Eastern European52 0.4% Jordanian47 0.4% Norwegian46 0.4% Scotch-Irish40 0.3% Ukrainian34 0.3% Latvian30 0.2% Lithuanian25 0.2% African24 0.2% Australian22 0.2% Slovak21 0.2% Yugoslavian21 0.2% Bulgarian21 0.2% British20 0.2% Portuguese20 0.2% Pennsylvania German19 0.2% French Canadian17 0.1% Croatian16 0.1% Canadian15 0.1% Alsatian12 0.10% Danish11 0.09% Hungarian11 0.09% Assyrian10 0.08% Belgian9 0.07% Serbian7 0.06% Scandinavian7 0.06% Macedonian
Geographical mobility in Okemos Same house 1 year ago 12,006 76.8% White (Caucasian)1,073 74.6% Black or African American155 78.7% American Indian / Alaska Native3,834 83.6% Asian134 34.1% Other race2,162 74.1% Two or more races11,856 76.6% White alone, not Hispanic / Latino851 84.4% Hispanic or LatinoMoved within same county 1,706 10.9% White / Caucasian132 9.2% Black or African American7 3.4% American Indian / Alaska Native114 2.5% Asian74 18.9% Other race338 11.6% Two or more races1,739 11.2% White alone, not Hispanic / Latino38 3.7% Hispanic or LatinoMoved within same state 1,192 7.6% White / Caucasian237 16.5% Black or African American11 5.4% American Indian / Alaska Native144 3.1% Asian49 12.4% Other race137 4.7% Two or more races1,165 7.5% White alone, not Hispanic / Latino96 9.6% Hispanic or LatinoMoved from different state 689 4.4% White / Caucasian12 0.8% Black or African American156 3.4% Asian150 38.2% Other race126 4.3% Two or more races656 4.2% White alone, not Hispanic / LatinoMoved from abroad 119 0.8% White32 16.4% American Indian / Alaska Native480 10.5% Asian103 3.5% Two or more races129 0.8% White alone, not Hispanic / Latino
Children Nativity (place of birth) in Okemos
Children under 6 years - Living with two parents Both parents native 785 100.0% NativeBoth parents foreign-born 423 95.9% Native18 4.1% Foreign-bornOne native, one foreign-born parent 126 100.0% NativeChildren under 6 years - Living with one parent Native parent 240 100.0% NativeForeign-born parent 107 100.0% NativeChildren 6 to 17 years - Living with two parents Both parents native 1,384 99.3% Native9 0.7% Foreign-bornBoth parents foreign-born 711 66.9% Native351 33.1% Foreign-bornOne native, one foreign-born parent 396 100.0% NativeChildren 6 to 17 years - Living with one parent Native parent 373 100.0% NativeForeign-born parent 328 53.3% Native287 46.7% Foreign-born
Grandparents responsible for own grandchildren in Okemos
Grandparents (30 to 59 years) White / Caucasian 82 100.0% Responsible for grandchildrenAsian 23 100.0% Not responsible for grandchildrenWhite alone, not Hispanic / Latino 82 100.0% Responsible for grandchildrenGrandparents (60 years and over) White / Caucasian 33 35.1% Responsible for grandchildren62 64.9% Not responsible for grandchildrenAsian 43 57.2% Responsible for grandchildren32 42.8% Not responsible for grandchildrenWhite alone, not Hispanic / Latino 34 33.4% Responsible for grandchildren69 66.6% Not responsible for grandchildren