Races in Olathe, Kansas (KS) Detailed Stats
Data:
Races - White alone (%)
Races - White alone (% change since 2000)
Races - Black alone (%)
Races - Black alone (% change since 2000)
Races - American Indian alone (%)
Races - American Indian alone (% change since 2000)
Races - Asian alone (%)
Races - Asian alone (% change since 2000)
Races - Hispanic (%)
Races - Hispanic (% change since 2000)
Races - Native Hawaiian and Other Pacific Islander alone (%)
Races - Native Hawaiian and Other Pacific Islander alone (% change since 2000)
Races - Two or more races(%)
Races - Two or more races(% change since 2000)
Races - Other race alone (%)
Races - Other race alone (% change since 2000)
Racial diversity
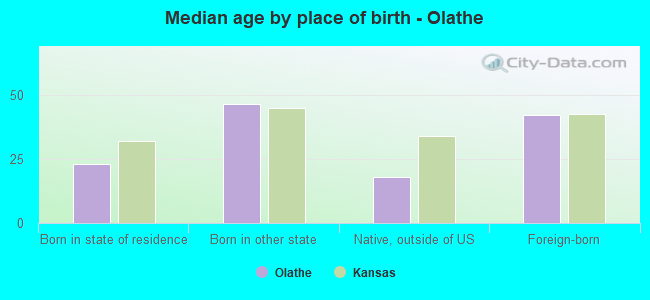
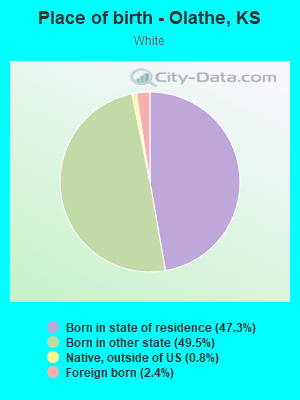
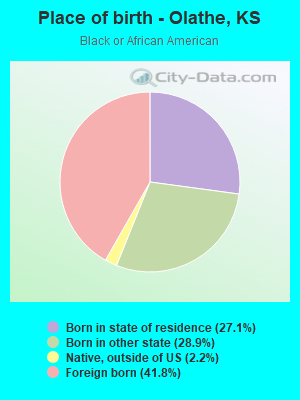
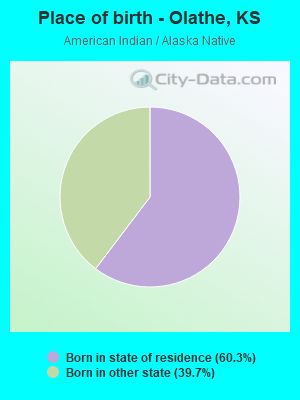
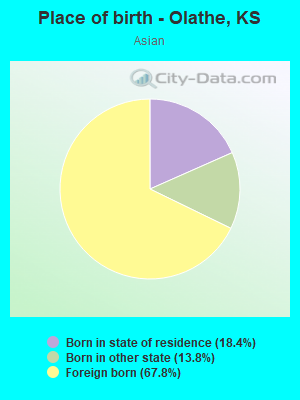
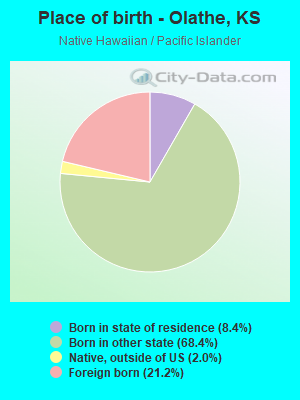
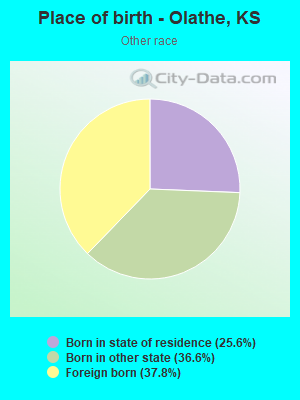
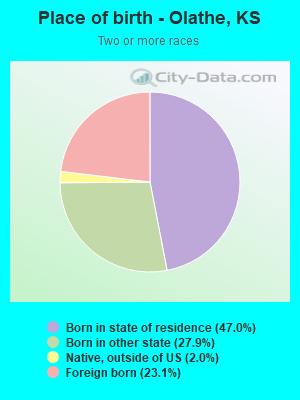
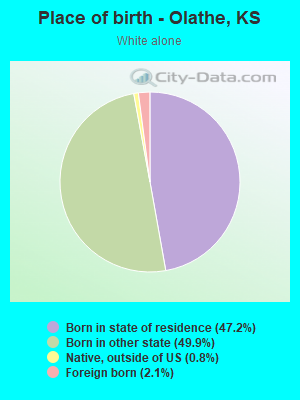
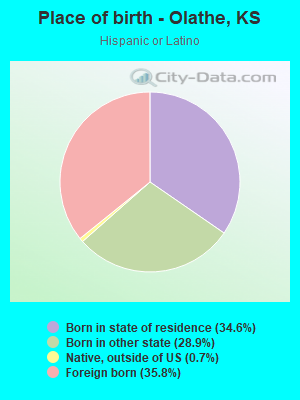
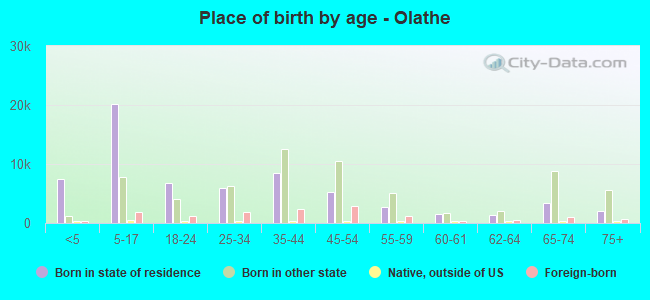
Place of birth - Born in state of residence (%)
Place of birth - Born in state of residence (%) - White
Place of birth - Born in state of residence (%) - Black or African American
Place of birth - Born in state of residence (%) - Asian
Place of birth - Born in state of residence (%) - Hispanic or Latino
Place of birth - Born in state of residence (%) - American Indian and Alaska Native
Place of birth - Born in state of residence (%) - Multirace
Place of birth - Born in state of residence (%) - Other Race
Place of birth - Born in other state (%)
Place of birth - Born in other state (%) - White
Place of birth - Born in other state (%) - Black or African American
Place of birth - Born in other state (%) - Asian
Place of birth - Born in other state (%) - Hispanic or Latino
Place of birth - Born in other state (%) - American Indian and Alaska Native
Place of birth - Born in other state (%) - Multirace
Place of birth - Born in other state (%) - Other Race
Place of birth - Native, outside of US (%)
Place of birth - Native, outside of US (%) - White
Place of birth - Native, outside of US (%) - Black or African American
Place of birth - Native, outside of US (%) - Asian
Place of birth - Native, outside of US (%) - Hispanic or Latino
Place of birth - Native, outside of US (%) - American Indian and Alaska Native
Place of birth - Native, outside of US (%) - Multirace
Place of birth - Native, outside of US (%) - Other Race
Place of birth - Foreign born (%)
Place of birth - Foreign born (%) - White
Place of birth - Foreign born (%) - Black or African American
Place of birth - Foreign born (%) - Asian
Place of birth - Foreign born (%) - Hispanic or Latino
Place of birth - Foreign born (%) - American Indian and Alaska Native
Place of birth - Foreign born (%) - Multirace
Place of birth - Foreign born (%) - Other Race
Residents speaking English at home (%)
Residents speaking English at home - Born in the United States (%)
Residents speaking English at home - Native, born elsewhere (%)
Residents speaking English at home - Foreign born (%)
Residents speaking Spanish at home (%)
Residents speaking Spanish at home - Born in the United States (%)
Residents speaking Spanish at home - Native, born elsewhere (%)
Residents speaking Spanish at home - Foreign born (%)
Residents speaking other language at home (%)
Residents speaking other language at home - Born in the United States (%)
Residents speaking other language at home - Native, born elsewhere (%)
Residents speaking other language at home - Foreign born (%)
Marital status - Never married (%)
Marital status - Now married (%)
Marital status - Separated (%)
Marital status - Widowed (%)
Marital status - Divorced (%)
Ancestries Reported - Arab (%)
Ancestries Reported - Czech (%)
Ancestries Reported - Danish (%)
Ancestries Reported - Dutch (%)
Ancestries Reported - English (%)
Ancestries Reported - French (%)
Ancestries Reported - French Canadian (%)
Ancestries Reported - German (%)
Ancestries Reported - Greek (%)
Ancestries Reported - Hungarian (%)
Ancestries Reported - Irish (%)
Ancestries Reported - Italian (%)
Ancestries Reported - Lithuanian (%)
Ancestries Reported - Norwegian (%)
Ancestries Reported - Polish (%)
Ancestries Reported - Portuguese (%)
Ancestries Reported - Russian (%)
Ancestries Reported - Scotch-Irish (%)
Ancestries Reported - Scottish (%)
Ancestries Reported - Slovak (%)
Ancestries Reported - Subsaharan African (%)
Ancestries Reported - Swedish (%)
Ancestries Reported - Swiss (%)
Ancestries Reported - Ukrainian (%)
Ancestries Reported - United States (%)
Ancestries Reported - Welsh (%)
Ancestries Reported - West Indian (%)
Ancestries Reported - Other (%)
Geographical mobility - Same house 1 year ago (%)
Geographical mobility - Same house 1 year ago (%) - White
Geographical mobility - Same house 1 year ago (%) - Black or African American
Geographical mobility - Same house 1 year ago (%) - Asian
Geographical mobility - Same house 1 year ago (%) - Hispanic or Latino
Geographical mobility - Same house 1 year ago (%) - American Indian and Alaska Native
Geographical mobility - Same house 1 year ago (%) - Multirace
Geographical mobility - Same house 1 year ago (%) - Other Race
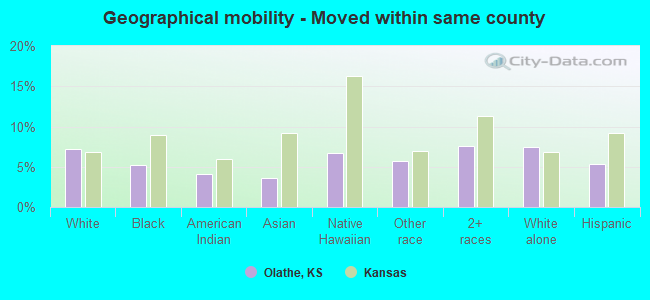
Geographical mobility - Moved within same county (%)
Geographical mobility - Moved within same county (%) - White
Geographical mobility - Moved within same county (%) - Black or African American
Geographical mobility - Moved within same county (%) - Asian
Geographical mobility - Moved within same county (%) - Hispanic or Latino
Geographical mobility - Moved within same county (%) - American Indian and Alaska Native
Geographical mobility - Moved within same county (%) - Multirace
Geographical mobility - Moved within same county (%) - Other Race
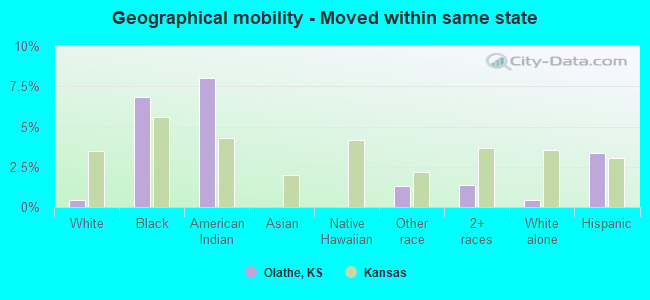
Geographical mobility - Moved from different county within same state (%)
Geographical mobility - Moved from different county within same state (%) - White
Geographical mobility - Moved from different county within same state (%) - Black or African American
Geographical mobility - Moved from different county within same state (%) - Asian
Geographical mobility - Moved from different county within same state (%) - Hispanic or Latino
Geographical mobility - Moved from different county within same state (%) - American Indian and Alaska Native
Geographical mobility - Moved from different county within same state (%) - Multirace
Geographical mobility - Moved from different county within same state (%) - Other Race
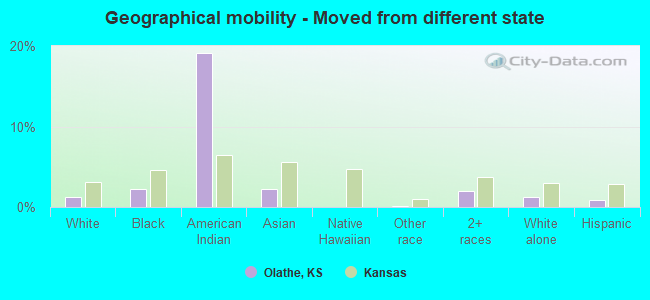
Geographical mobility - Moved from different state (%)
Geographical mobility - Moved from different state (%) - White
Geographical mobility - Moved from different state (%) - Black or African American
Geographical mobility - Moved from different state (%) - Asian
Geographical mobility - Moved from different state (%) - Hispanic or Latino
Geographical mobility - Moved from different state (%) - American Indian and Alaska Native
Geographical mobility - Moved from different state (%) - Multirace
Geographical mobility - Moved from different state (%) - Other Race
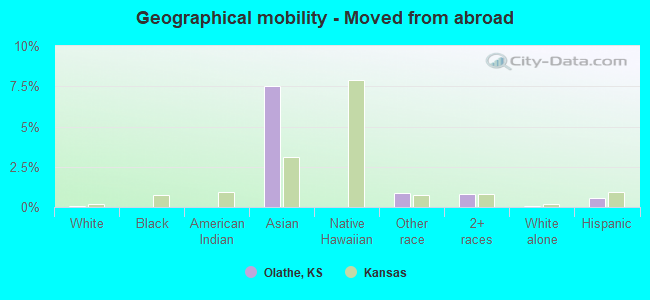
Geographical mobility - Moved from abroad (%)
Geographical mobility - Moved from abroad (%) - White
Geographical mobility - Moved from abroad (%) - Black or African American
Geographical mobility - Moved from abroad (%) - Asian
Geographical mobility - Moved from abroad (%) - Hispanic or Latino
Geographical mobility - Moved from abroad (%) - American Indian and Alaska Native
Geographical mobility - Moved from abroad (%) - Multirace
Geographical mobility - Moved from abroad (%) - Other Race
Place of birth for the foreign-born population - Ireland (%)
Place of birth for the foreign-born population - Denmark (%)
Place of birth for the foreign-born population - Norway (%)
Place of birth for the foreign-born population - Sweden (%)
Place of birth for the foreign-born population - United Kingdom (%)
Place of birth for the foreign-born population - England (%)
Place of birth for the foreign-born population - Scotland (%)
Place of birth for the foreign-born population - Other Northern Europe (%)
Place of birth for the foreign-born population - Austria (%)
Place of birth for the foreign-born population - Belgium (%)
Place of birth for the foreign-born population - France (%)
Place of birth for the foreign-born population - Germany (%)
Place of birth for the foreign-born population - Netherlands (%)
Place of birth for the foreign-born population - Switzerland (%)
Place of birth for the foreign-born population - Other Western Europe (%)
Place of birth for the foreign-born population - Greece (%)
Place of birth for the foreign-born population - Italy (%)
Place of birth for the foreign-born population - Portugal (%)
Place of birth for the foreign-born population - Spain (%)
Place of birth for the foreign-born population - Other Southern Europe (%)
Place of birth for the foreign-born population - Albania (%)
Place of birth for the foreign-born population - Belarus (%)
Place of birth for the foreign-born population - Bosnia and Herzegovina (%)
Place of birth for the foreign-born population - Bulgaria (%)
Place of birth for the foreign-born population - Croatia (%)
Place of birth for the foreign-born population - Czechoslovakia (%)
Place of birth for the foreign-born population - Hungary (%)
Place of birth for the foreign-born population - Latvia (%)
Place of birth for the foreign-born population - Lithuania (%)
Place of birth for the foreign-born population - North Macedonia (Macedonia) (%)
Place of birth for the foreign-born population - Moldova (%)
Place of birth for the foreign-born population - Poland (%)
Place of birth for the foreign-born population - Romania (%)
Place of birth for the foreign-born population - Russia (%)
Place of birth for the foreign-born population - Serbia (%)
Place of birth for the foreign-born population - Ukraine (%)
Place of birth for the foreign-born population - Other Eastern Europe (%)
Place of birth for the foreign-born population - China (%)
Place of birth for the foreign-born population - Hong Kong (%)
Place of birth for the foreign-born population - Taiwan (%)
Place of birth for the foreign-born population - Japan (%)
Place of birth for the foreign-born population - Korea (%)
Place of birth for the foreign-born population - Other Eastern Asia (%)
Place of birth for the foreign-born population - Afghanistan (%)
Place of birth for the foreign-born population - Bangladesh (%)
Place of birth for the foreign-born population - India (%)
Place of birth for the foreign-born population - Iran (%)
Place of birth for the foreign-born population - Kazakhstan (%)
Place of birth for the foreign-born population - Nepal (%)
Place of birth for the foreign-born population - Pakistan (%)
Place of birth for the foreign-born population - Sri Lanka (%)
Place of birth for the foreign-born population - Uzbekistan (%)
Place of birth for the foreign-born population - Other South Central Asia (%)
Place of birth for the foreign-born population - Burma (%)
Place of birth for the foreign-born population - Cambodia (%)
Place of birth for the foreign-born population - Indonesia (%)
Place of birth for the foreign-born population - Laos (%)
Place of birth for the foreign-born population - Malaysia (%)
Place of birth for the foreign-born population - Philippines (%)
Place of birth for the foreign-born population - Singapore (%)
Place of birth for the foreign-born population - Thailand (%)
Place of birth for the foreign-born population - Vietnam (%)
Place of birth for the foreign-born population - Other South Eastern Asia (%)
Place of birth for the foreign-born population - Armenia (%)
Place of birth for the foreign-born population - Iraq (%)
Place of birth for the foreign-born population - Israel (%)
Place of birth for the foreign-born population - Jordan (%)
Place of birth for the foreign-born population - Kuwait (%)
Place of birth for the foreign-born population - Lebanon (%)
Place of birth for the foreign-born population - Saudi Arabia (%)
Place of birth for the foreign-born population - Syria (%)
Place of birth for the foreign-born population - Turkey (%)
Place of birth for the foreign-born population - Yemen (%)
Place of birth for the foreign-born population - Other Western Asia (%)
Place of birth for the foreign-born population - Eritrea (%)
Place of birth for the foreign-born population - Ethiopia (%)
Place of birth for the foreign-born population - Kenya (%)
Place of birth for the foreign-born population - Somalia (%)
Place of birth for the foreign-born population - Uganda (%)
Place of birth for the foreign-born population - Zimbabwe (%)
Place of birth for the foreign-born population - Other Eastern Africa (%)
Place of birth for the foreign-born population - Cameroon (%)
Place of birth for the foreign-born population - Congo (%)
Place of birth for the foreign-born population - Democratic Republic of Congo (Zaire) (%)
Place of birth for the foreign-born population - Other Middle Africa (%)
Place of birth for the foreign-born population - Egypt (%)
Place of birth for the foreign-born population - Morocco (%)
Place of birth for the foreign-born population - Sudan (%)
Place of birth for the foreign-born population - Other Northern Africa (%)
Place of birth for the foreign-born population - South Africa (%)
Place of birth for the foreign-born population - Other Southern Africa (%)
Place of birth for the foreign-born population - Cabo Verde (%)
Place of birth for the foreign-born population - Ghana (%)
Place of birth for the foreign-born population - Liberia (%)
Place of birth for the foreign-born population - Nigeria (%)
Place of birth for the foreign-born population - Senegal (%)
Place of birth for the foreign-born population - Sierra Leone (%)
Place of birth for the foreign-born population - Other Western Africa (%)
Place of birth for the foreign-born population - Australia (%)
Place of birth for the foreign-born population - New Zealand (%)
Place of birth for the foreign-born population - Fiji (%)
Place of birth for the foreign-born population - Micronesia (%)
Place of birth for the foreign-born population - Bahamas (%)
Place of birth for the foreign-born population - Barbados (%)
Place of birth for the foreign-born population - Cuba (%)
Place of birth for the foreign-born population - Dominica (%)
Place of birth for the foreign-born population - Dominican Republic (%)
Place of birth for the foreign-born population - Grenada (%)
Place of birth for the foreign-born population - Haiti (%)
Place of birth for the foreign-born population - Jamaica (%)
Place of birth for the foreign-born population - St. Vincent and the Grenadines (%)
Place of birth for the foreign-born population - Trinidad and Tobago (%)
Place of birth for the foreign-born population - West Indies (%)
Place of birth for the foreign-born population - Other Caribbean (%)
Place of birth for the foreign-born population - Belize (%)
Place of birth for the foreign-born population - Costa Rica (%)
Place of birth for the foreign-born population - El Salvador (%)
Place of birth for the foreign-born population - Guatemala (%)
Place of birth for the foreign-born population - Honduras (%)
Place of birth for the foreign-born population - Mexico (%)
Place of birth for the foreign-born population - Nicaragua (%)
Place of birth for the foreign-born population - Panama (%)
Place of birth for the foreign-born population - Other Central America (%)
Place of birth for the foreign-born population - Argentina (%)
Place of birth for the foreign-born population - Bolivia (%)
Place of birth for the foreign-born population - Brazil (%)
Place of birth for the foreign-born population - Chile (%)
Place of birth for the foreign-born population - Colombia (%)
Place of birth for the foreign-born population - Ecuador (%)
Place of birth for the foreign-born population - Guyana (%)
Place of birth for the foreign-born population - Peru (%)
Place of birth for the foreign-born population - Uruguay (%)
Place of birth for the foreign-born population - Venezuela (%)
Place of birth for the foreign-born population - Other South America (%)
Place of birth for the foreign-born population - Canada (%)
Place of birth for the foreign-born population - Other Northern America (%)
Place of birth for the foreign-born population - Other (%)
Latest news about races in Olathe, KS collected exclusively by city-data.com from local newspapers, TV, and radio stations
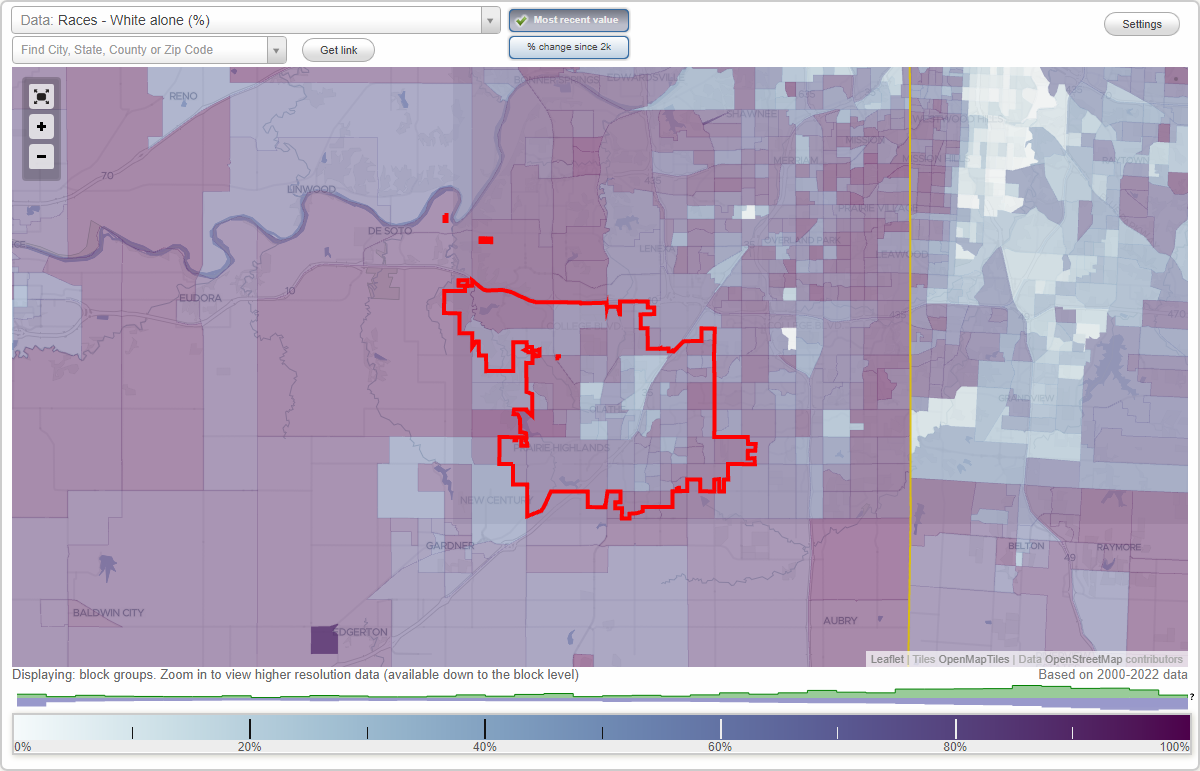
According to 2022 data, the most numerous races in Olathe, KS are White alone (112,423 residents), Hispanic (13,814 residents), and Black alone (4,766 residents). 86.7% of Olathe residents speak English at home. 10.6% of Olathe, KS residents are foreign-born (4.5% born in Latin America, 3.2% born in Asia, 1.9% born in Africa), which is 34.1% greater than the foreign-born rate of 7.0% across the entire state of Kansas.
Race distribution in Olathe
2000 2022
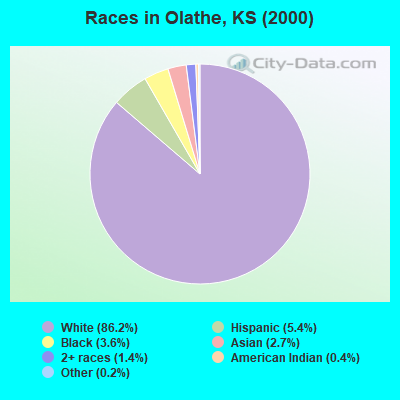
80,157 86.2% White alone 5,060 5.4% Hispanic 3,390 3.6% Black alone 2,524 2.7% Asian alone 1,287 1.4% Two or more races 348 0.4% American Indian alone 157 0.2% Other race alone 39 0.04% Native Hawaiian and Other
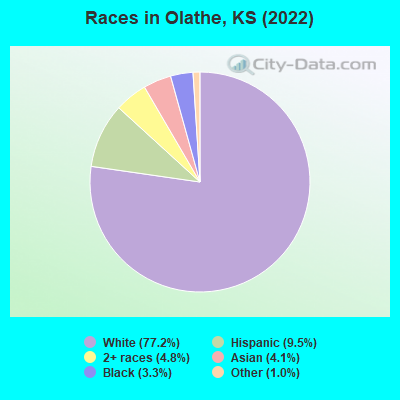
112,423 77.2% White alone 13,814 9.5% Hispanic 7,009 4.8% Two or more races 5,900 4.1% Asian alone 4,766 3.3% Black alone 1,500 1.0% Other race alone 141 0.10% Native Hawaiian and Other 44 0.03% American Indian alone
2000 2022
2,233,997 83.1% White alone 188,252 7.0% Hispanic 151,407 5.6% Black alone 46,301 1.7% Asian alone 42,508 1.6% Two or more races 22,322 0.8% American Indian alone 2,477 0.09% Other race alone 1,154 0.04% Native Hawaiian and Other
2,147,943 73.1% White alone 381,746 13.0% Hispanic 147,666 5.0% Black alone 145,362 4.9% Two or more races 85,085 2.9% Asian alone 13,263 0.5% Other race alone 12,065 0.4% American Indian alone 4,020 0.1% Native Hawaiian and Other
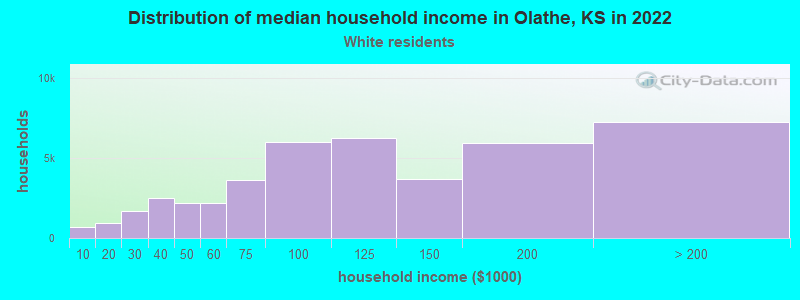
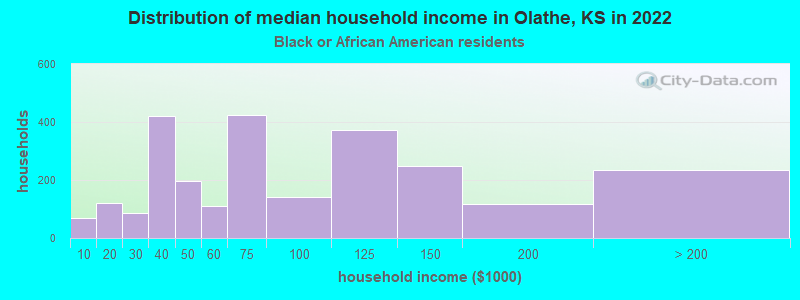
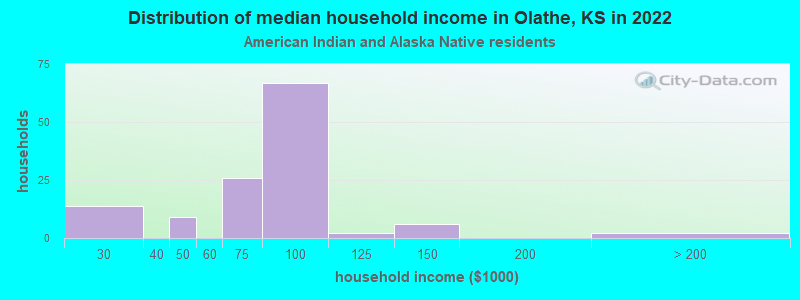
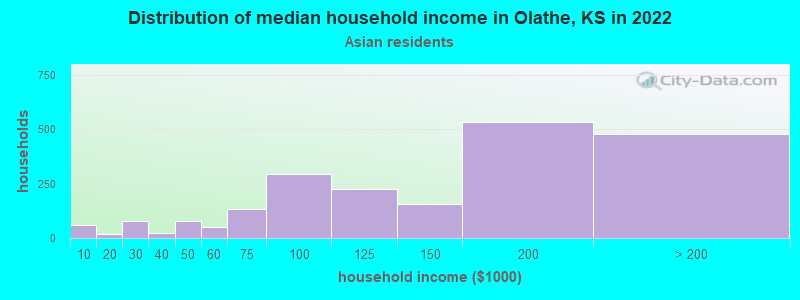
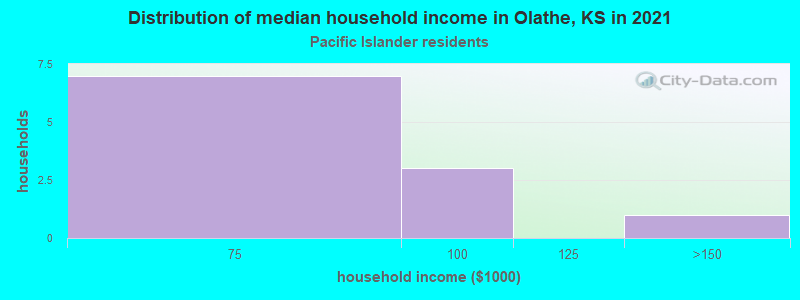
Income and house value in Olathe Median household income in 2022 $110,104 White non-Hispanic householders$48,682 Black householders$94,666 American Indian and Alaska Native householders$120,969 Asian householders$71,635 Some other race householders$68,054 Two or more races householders$49,764 Hispanic or Latino race householdersMedian 2022 house value $350,105 White Non-Hispanic householders$335,329 Black or African American householders$262,203 American Indian or Alaska Native householders $359,120 Asian householders$299,517 Some other race householders$304,275 Two or more races householders$333,827 Hispanic or Latino householders
Median age by race in Olathe
39.5 Median age for White residents38.1 40.4 29.8 Median age for Black or African American residents29.1 33.1 39.6 Median age for American Indian / Alaska Native residents-666,666,666.0 39.3 41.4 Median age for Asian residents38.4 47.2 -666,666,666.0 Median age for Native Hawaiian / Pacific Islander residents-666,666,666.0 -666,666,666.0 37.1 Median age for Other race residents42.4 28.9 22.3 Median age for Two or more races residents20.8 23.4 39.9 Median age for White alone residents38.5 40.7 30.9 Median age for Hispanic or Latino residents30.5 32.1
Owner/renter occupied households by race in Olathe
House owners and renters - White residents 33,790 78.8% Owner occupied9,075 21.2% Renter occupiedHouse owners and renters - Black or African American residents 739 49.1% Owner occupied766 50.9% Renter occupiedHouse owners and renters - American Indian / Alaska Native residents 57 50.0% Owner occupied57 50.0% Renter occupiedHouse owners and renters - Asian residents 1,643 77.0% Owner occupied490 23.0% Renter occupiedHouse owners and renters - Native Hawaiian / Pacific Islander residents 5 42.8% Owner occupied7 57.2% Renter occupiedHouse owners and renters - Other race residents 1,070 62.2% Owner occupied650 37.8% Renter occupiedHouse owners and renters - Two or more races residents 1,985 61.8% Owner occupied1,228 38.2% Renter occupiedHouse owners and renters - White alone residents 33,323 79.7% Owner occupied8,508 20.3% Renter occupiedHouse owners and renters - Hispanic or Latino residents 1,995 47.9% Owner occupied2,172 52.1% Renter occupied
Language usage in Olathe
English speakers - Total 86.7% of residents of Olathe speak English at home.
6.3% of residents speak Spanish at home 5,157 60.1% Speak English very well3,427 39.9% Speak English less than very well7.0% of residents speak other language at home 4,934 51.6% Speak English very well4,619 48.4% Speak English less than very well
English speakers - Born in the United States 95.5% of residents of Olathe speak English at home.
3.0% of residents speak Spanish at home 1,573 82.6% Speak English very well332 17.4% Speak English less than very well1.6% of residents speak other language at home 971 95.6% Speak English very well45 4.4% Speak English less than very well
English speakers - Native, born elsewhere 92.1% of residents of Olathe speak English at home.
7.9% of residents speak Spanish at home 96 100.0% Speak English very well
English speakers - Foreign-born 11.7% of residents of Olathe speak English at home.
35.0% of residents speak Spanish at home 2,134 44.1% Speak English very well2,703 55.9% Speak English less than very well53.3% of residents speak other language at home 3,012 40.9% Speak English very well4,360 59.1% Speak English less than very well
White (Caucasian) - Speak only English Native:
97.7% (103,649)Foreign-born:
29.3% (820)
White (Caucasian) - Speak another language Native:
2.3% (2,439)Foreign-born:
70.7% (1,976)
Black or African American - Speak only English Native:
96.9% (2,481)Foreign-born:
9.5% (194)
Black or African American - Speak another language Native:
3.1% (80)Foreign-born:
90.5% (1,858)
Asian - Speak only English Native:
70.1% (1,195)Foreign-born:
9.3% (371)
Asian - Speak another language Native:
29.9% (510)Foreign-born:
90.7% (3,629)
Native Hawaiian / Pacific Islander - Speak only English Native:
21.7% (5)Foreign-born:
50.7% (3)
Other race - Speak only English Native:
58.5% (1,399)Foreign-born:
5.9% (90)
Other race - Speak another language Native:
41.5% (992)Foreign-born:
94.1% (1,441)
Two or more races - Speak another language Native:
16.5% (1,651)Foreign-born:
100.0% (3,305)
White alone - Speak only English Native:
98.4% (101,544)Foreign-born:
31.9% (741)
White alone - Speak another language Native:
1.6% (1,600)Foreign-born:
68.1% (1,581)
Hispanic or Latino - Speak only English Native:
60.5% (4,912)Foreign-born:
3.4% (169)
Hispanic or Latino - Speak another language Native:
39.5% (3,208)Foreign-born:
96.6% (4,777)
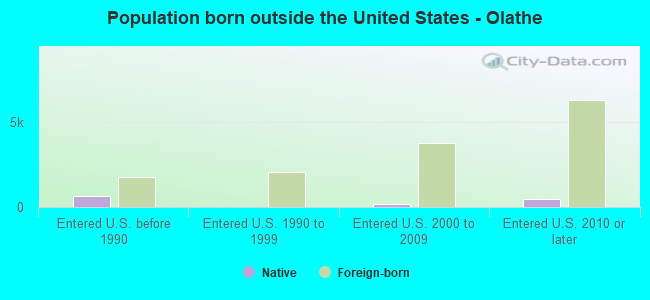
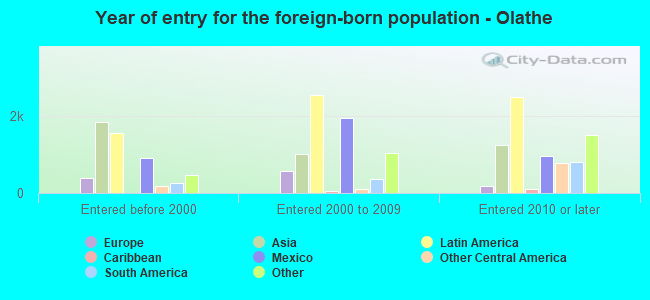
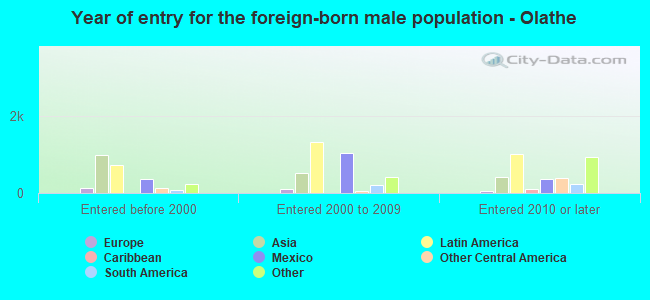
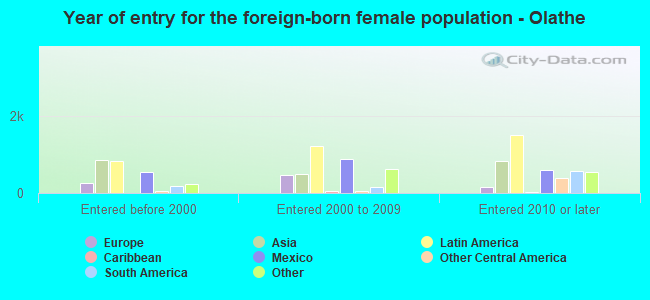
Foreign-born residents in Olathe 15,312 residents are foreign born (4.5% Latin America , 3.2% Asia , 1.9% Africa ).
This city:
10.6%Kansas:
7.1%
Marital status for residents in Olathe Marital status - White (Caucasian) population 15 years and over
Males 28.0% Never married59.4% Now married0.7% Separated1.7% Widowed10.3% DivorcedFemales 22.2% Never married55.9% Now married0.3% Separated8.0% Widowed13.6% DivorcedWomen who gave birth in the past 12 months Now married:
96.1% (1,086)Unmarried:
3.9% (44)
Women who did not give birth in the past 12 months Now married:
51.0% (13,062)Unmarried:
49.0% (12,534)
Marital status - Black or African American population 15 years and over
Males 31.9% Never married55.8% Now married0.0% Separated3.2% Widowed9.1% DivorcedFemales 38.3% Never married44.8% Now married0.0% Separated0.0% Widowed16.9% DivorcedWomen who gave birth in the past 12 months Now married:
100.0% (112)Unmarried:
0.0% (0)
Women who did not give birth in the past 12 months Now married:
30.8% (500)Unmarried:
69.2% (1,123)
Marital status - American Indian / Alaska Native population 15 years and over
Males 25.3% Never married21.2% Now married0.0% Separated24.2% Widowed29.3% DivorcedFemales 48.1% Never married45.3% Now married0.0% Separated0.0% Widowed6.6% DivorcedWomen who gave birth in the past 12 months Now married:
0.0% (0)Unmarried:
100.0% (8)
Women who did not give birth in the past 12 months Now married:
37.8% (35)Unmarried:
62.2% (58)
Marital status - Asian population 15 years and over
Males 31.2% Never married66.4% Now married0.3% Separated0.9% Widowed1.2% DivorcedFemales 25.0% Never married61.3% Now married0.5% Separated4.7% Widowed8.6% DivorcedWomen who gave birth in the past 12 months Now married:
100.0% (65)Unmarried:
0.0% (0)
Women who did not give birth in the past 12 months Now married:
59.1% (1,140)Unmarried:
40.9% (790)
Marital status - Native Hawaiian / Pacific Islander population 15 years and over
Males 0.0% Never married0.0% Now married0.0% Separated0.0% Widowed100.0% DivorcedFemales 0.0% Never married70.0% Now married0.0% Separated0.0% Widowed30.0% DivorcedWomen who did not give birth in the past 12 months Now married:
100.0% (6)Unmarried:
0.0% (0)
Marital status - Other race population 15 years and over
Males 44.5% Never married42.1% Now married2.6% Separated6.0% Widowed4.8% DivorcedFemales 34.8% Never married51.3% Now married2.6% Separated1.7% Widowed9.6% DivorcedWomen who gave birth in the past 12 months Now married:
100.0% (94)Unmarried:
0.0% (0)
Women who did not give birth in the past 12 months Now married:
42.9% (503)Unmarried:
57.1% (671)
Marital status - Two or more races population 15 years and over
Males 42.6% Never married46.8% Now married3.0% Separated0.0% Widowed7.6% DivorcedFemales 31.2% Never married48.4% Now married3.0% Separated5.9% Widowed11.5% DivorcedWomen who gave birth in the past 12 months Now married:
100.0% (215)Unmarried:
0.0% (0)
Women who did not give birth in the past 12 months Now married:
41.8% (1,097)Unmarried:
58.2% (1,528)
Marital status - White alone, not Hispanic / Latino population 15 years and over
Males 27.3% Never married60.1% Now married0.7% Separated1.6% Widowed10.3% DivorcedFemales 22.0% Never married56.0% Now married0.3% Separated8.2% Widowed13.5% DivorcedWomen who gave birth in the past 12 months Now married:
96.0% (1,050)Unmarried:
4.0% (44)
Women who did not give birth in the past 12 months Now married:
51.3% (12,597)Unmarried:
48.7% (11,981)
Marital status - Hispanic or Latino population 15 years and over
Males 34.5% Never married49.9% Now married5.8% Separated2.2% Widowed7.6% DivorcedFemales 31.2% Never married54.2% Now married0.4% Separated1.1% Widowed13.0% DivorcedWomen who gave birth in the past 12 months Now married:
100.0% (141)Unmarried:
0.0% (0)
Women who did not give birth in the past 12 months Now married:
47.9% (1,778)Unmarried:
52.1% (1,936)
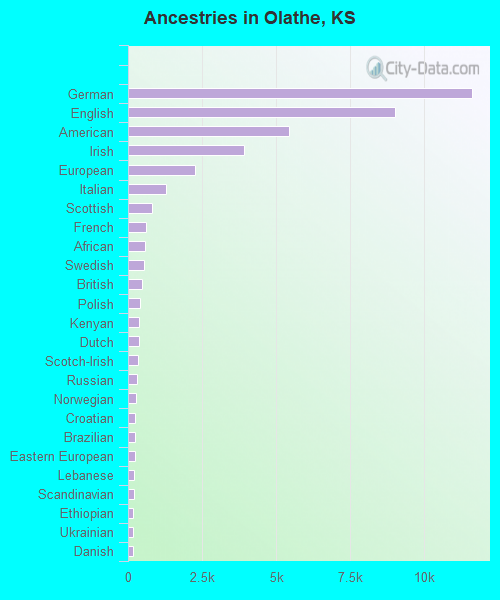
Ancestries in Olathe
11,599 18.2% German9,013 14.1% English5,442 8.5% American3,923 6.2% Irish2,266 3.6% European1,287 2.0% Italian804 1.3% Scottish597 0.9% French563 0.9% African546 0.9% Swedish469 0.7% British421 0.7% Polish369 0.6% Kenyan364 0.6% Dutch344 0.5% Scotch-Irish294 0.5% Russian274 0.4% Norwegian244 0.4% Croatian231 0.4% Brazilian228 0.4% Eastern European193 0.3% Lebanese192 0.3% Scandinavian173 0.3% Ethiopian171 0.3% Ukrainian168 0.3% Danish145 0.2% Nigerian141 0.2% Canadian140 0.2% Austrian123 0.2% Iranian95 0.1% French Canadian91 0.1% Armenian90 0.1% Czech89 0.1% Welsh88 0.1% Palestinian81 0.1% Hungarian78 0.1% Swiss78 0.1% Haitian74 0.1% Slovak69 0.1% Arab53 0.08% Northern European49 0.08% Belgian42 0.07% Greek41 0.06% Jordanian35 0.05% German Russian28 0.04% Basque27 0.04% Pennsylvania German25 0.04% Finnish24 0.04% Czechoslovakian24 0.04% Celtic24 0.04% Bulgarian18 0.03% Syrian17 0.03% Cajun11 0.02% Slavic10 0.02% Liberian10 0.02% Jamaican9 0.01% Albanian8 0.01% Lithuanian6 0.01% Turkish4 0.01% Yugoslavian
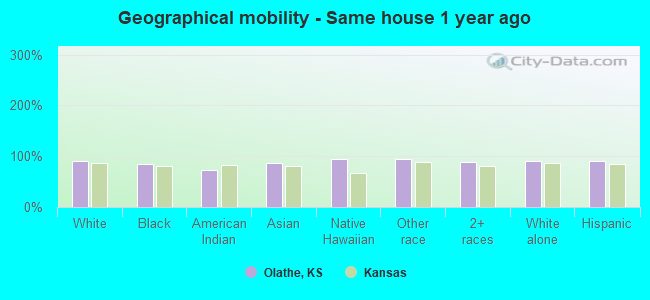
Geographical mobility in Olathe Same house 1 year ago 104,734 91.0% White (Caucasian)4,088 85.7% Black or African American200 72.8% American Indian / Alaska Native5,012 86.6% Asian14 93.9% Native Hawaiian / Pacific Islander3,862 95.0% Other race12,060 89.1% Two or more races101,479 90.9% White alone, not Hispanic / Latino12,246 89.8% Hispanic or LatinoMoved within same county 8,341 7.2% White / Caucasian251 5.3% Black or African American11 4.1% American Indian / Alaska Native210 3.6% Asian1 6.8% Native Hawaiian / Pacific Islander230 5.7% Other race1,023 7.6% Two or more races8,254 7.4% White alone, not Hispanic / Latino735 5.4% Hispanic or LatinoMoved within same state 517 0.4% White / Caucasian327 6.9% Black or African American22 8.0% American Indian / Alaska Native54 1.3% Other race189 1.4% Two or more races456 0.4% White alone, not Hispanic / Latino456 3.3% Hispanic or LatinoMoved from different state 1,434 1.2% White / Caucasian106 2.2% Black or African American53 19.2% American Indian / Alaska Native132 2.3% Asian5 0.1% Other race264 1.9% Two or more races1,379 1.2% White alone, not Hispanic / Latino121 0.9% Hispanic or LatinoMoved from abroad 92 0.1% White436 7.5% Asian37 0.9% Other race112 0.8% Two or more races92 0.1% White alone, not Hispanic / Latino73 0.5% Hispanic or Latino
Children Nativity (place of birth) in Olathe
Children under 6 years - Living with two parents Both parents native 7,807 100.0% NativeBoth parents foreign-born 726 90.2% Native79 9.8% Foreign-bornOne native, one foreign-born parent 553 100.0% NativeChildren under 6 years - Living with one parent Native parent 690 100.0% NativeForeign-born parent 92 100.0% NativeChildren 6 to 17 years - Living with two parents Both parents native 16,320 98.6% Native240 1.4% Foreign-bornBoth parents foreign-born 1,453 61.0% Native930 39.0% Foreign-bornOne native, one foreign-born parent 1,519 91.3% Native144 8.7% Foreign-bornChildren 6 to 17 years - Living with one parent Native parent 5,855 95.1% Native300 4.9% Foreign-bornForeign-born parent 596 80.1% Native148 19.9% Foreign-born
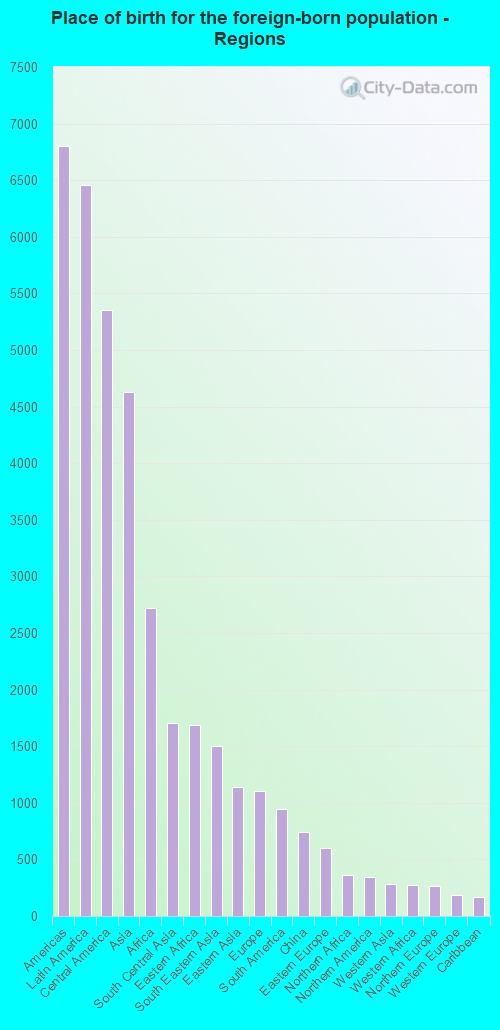
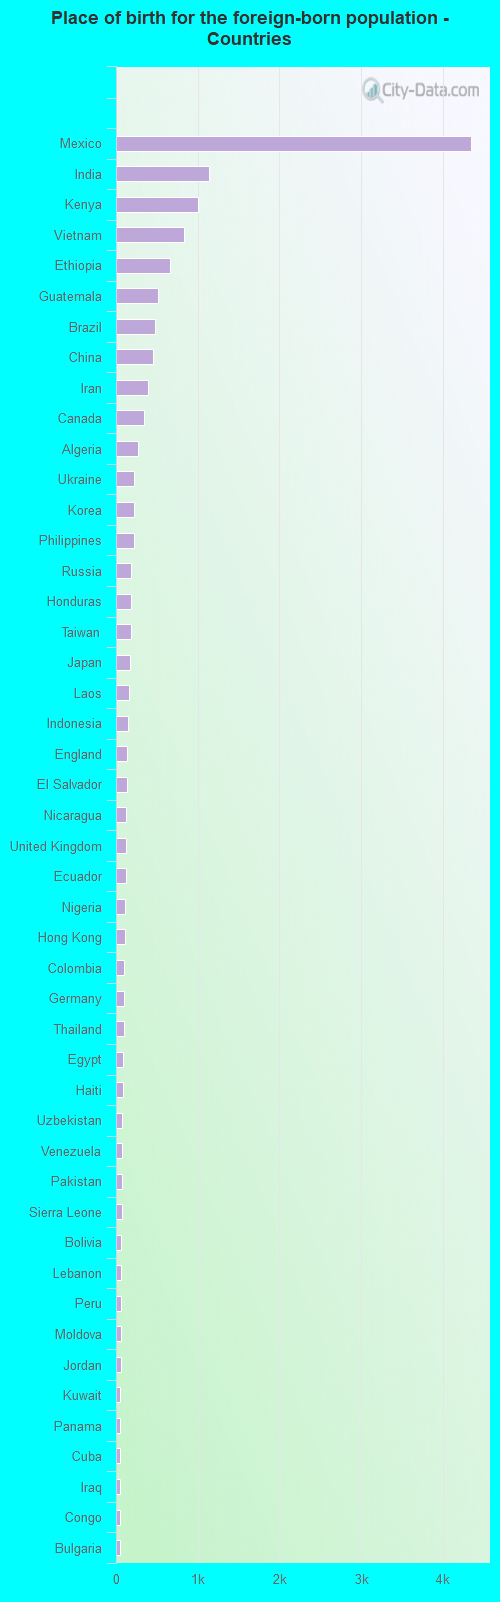
Place of birth for residents in Olathe 6,806 Americas6,459 Latin America5,350 Central America4,630 Asia2,720 Africa1,707 South Central Asia1,684 Eastern Africa1,503 South Eastern Asia1,138 Eastern Asia1,106 Europe943 South America741 China603 Eastern Europe359 Northern Africa347 Northern America281 Western Asia274 Western Africa269 Northern Europe186 Western Europe165 Caribbean48 Oceania46 Southern Europe45 Middle Africa45 Southern Africa16 Australia and New Zealand Subregion4,347 Mexico1,132 India1,001 Kenya833 Vietnam664 Ethiopia511 Guatemala481 Brazil450 China391 Iran347 Canada268 Algeria220 Ukraine219 Korea215 Philippines189 Russia183 Honduras179 Taiwan177 Japan164 Laos144 Indonesia134 England129 El Salvador126 Nicaragua120 United Kingdom117 Ecuador112 Nigeria111 Hong Kong104 Colombia100 Germany96 Thailand90 Egypt85 Haiti77 Uzbekistan76 Venezuela71 Pakistan71 Sierra Leone67 Bolivia61 Lebanon60 Peru57 Moldova56 Jordan52 Kuwait50 Panama46 Cuba46 Iraq45 Congo44 Bulgaria39 France36 Burma (Myanmar)35 Belarus34 South Africa29 Fiji26 Dominican Republic24 Greece23 Uruguay22 Saudi Arabia19 Nepal18 Syria18 Spain18 Netherlands16 Australia14 Scotland13 Argentina12 Malaysia11 Czechoslovakia11 Ghana10 Bosnia and Herzegovina10 Belgium9 Turkey8 Azerbaijan7 Israel7 Liberia6 Poland6 Jamaica4 Italy3 Micronesia
Grandparents responsible for own grandchildren in Olathe
Grandparents (30 to 59 years) White / Caucasian 153 38.5% Responsible for grandchildren244 61.5% Not responsible for grandchildrenBlack or African American 8 37.5% Responsible for grandchildren13 62.5% Not responsible for grandchildrenAsian 64 100.0% Not responsible for grandchildrenOther race 47 100.0% Not responsible for grandchildrenTwo or more races 23 22.0% Responsible for grandchildren83 78.0% Not responsible for grandchildrenWhite alone, not Hispanic / Latino 146 35.9% Responsible for grandchildren260 64.1% Not responsible for grandchildrenHispanic or Latino 21 24.8% Responsible for grandchildren64 75.2% Not responsible for grandchildrenGrandparents (60 years and over) White / Caucasian 64 11.3% Responsible for grandchildren506 88.7% Not responsible for grandchildrenBlack or African American 44 48.0% Responsible for grandchildren47 52.0% Not responsible for grandchildrenAsian 30 20.1% Responsible for grandchildren118 79.9% Not responsible for grandchildrenTwo or more races 26 21.6% Responsible for grandchildren95 78.4% Not responsible for grandchildrenWhite alone, not Hispanic / Latino 65 11.2% Responsible for grandchildren511 88.8% Not responsible for grandchildrenHispanic or Latino 1 0.7% Responsible for grandchildren80 99.3% Not responsible for grandchildren