Races in Onaqui, Utah (UT) Detailed Stats
Ancestries, Foreign-born residents, place of birth
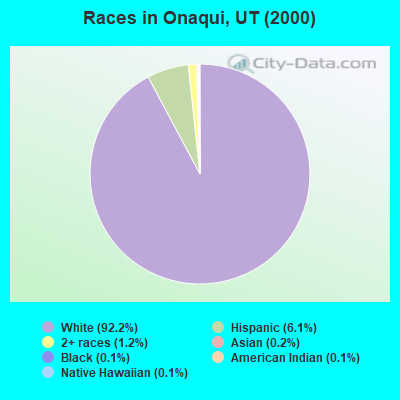
Race distribution in Onaqui

- 79192.2%White alone
- 526.1%Hispanic
- 101.2%Two or more races
- 20.2%Asian alone
- 10.1%Native Hawaiian and Other
Pacific Islander alone - 10.1%Black alone
- 10.1%American Indian alone
2000
2022
-
- 1,904,26585.3%White alone
- 201,5599.0%Hispanic
- 36,4831.6%Asian alone
- 31,3081.4%Two or more races
- 26,6631.2%American Indian alone
- 14,8060.7%Native Hawaiian and Other
Pacific Islander alone - 16,1370.7%Black alone
- 1,9480.09%Other race alone

-
- 2,557,46675.6%White alone
- 512,08615.1%Hispanic
- 119,3083.5%Two or more races
- 82,3882.4%Asian alone
- 36,9781.1%Native Hawaiian and Other
Pacific Islander alone - 34,8731.0%Black alone
- 22,8030.7%American Indian alone
- 14,8980.4%Other race alone

Income and house value in Onaqui
- Median household income in 2022
- $98,064White non-Hispanic householders
- $70,978Some other race householders
- $133,954Two or more races householders
- $82,177Hispanic or Latino race householders
- Median 2022 house value
- $439,336White Non-Hispanic householders
- $411,534Some other race householders
- $594,438Two or more races householders
- $246,920Hispanic or Latino householders
Household income for White non-Hispanic householders

Household income for Two or more races householders

Household income for Hispanic or Latino race householders

Zip code: 84071