Races in Oneida, New York (NY) Detailed Stats
Ancestries, Foreign-born residents, place of birth
Settings
X


Recent posts about races in Oneida, New York on our local forum with over 2,400,000 registered users:
 | smaller Upstate NY cities and towns/African American communities (5993 replies) |
| Tourism is on the rise in Oneida County. What is bringing so many people to the area? (2 replies) |
| do move to utica ny (564 replies) |
| For those interested in state political issues (426 replies) |
| Relocating to rome (198 replies) |
| Asian communities in Upstate NY (599 replies) |
Latest news about races in Oneida, NY collected exclusively by city-data.com from local newspapers, TV, and radio stations
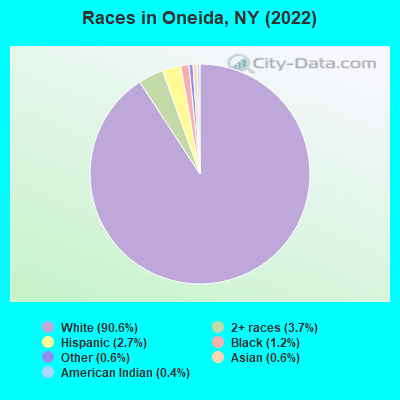
According to 2022 data, the most numerous races in Oneida, NY are White alone (9,231 residents), Hispanic (274 residents), and Black alone (122 residents). 96.4% of Oneida residents speak English at home. 1.8% of Oneida, NY residents are foreign-born , which is 1151.9% less than the foreign-born rate of 22.0% across the entire state of New York.
Race distribution in Oneida
2000
2022

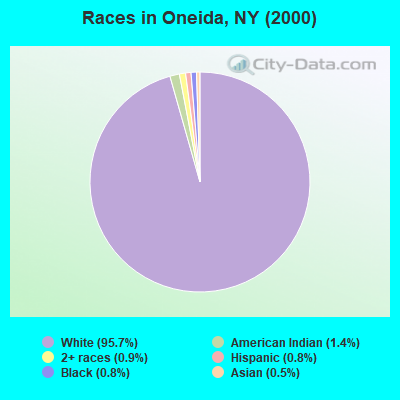
- 10,51095.7%White alone
- 1491.4%American Indian alone
- 940.9%Two or more races
- 920.8%Hispanic
- 850.8%Black alone
- 510.5%Asian alone
- 40.04%Other race alone
- 20.02%Native Hawaiian and Other
Pacific Islander alone
-
- 9,23190.6%White alone
- 3723.7%Two or more races
- 2742.7%Hispanic
- 1221.2%Black alone
- 580.6%Asian alone
- 650.6%Other race alone
- 430.4%American Indian alone
2000
2022
-
- 11,760,98162.0%White alone
- 2,867,58315.1%Hispanic
- 2,812,62314.8%Black alone
- 1,035,9265.5%Asian alone
- 366,1161.9%Two or more races
- 75,4990.4%Other race alone
- 52,4990.3%American Indian alone
- 5,2300.03%Native Hawaiian and Other
Pacific Islander alone

-
- 10,408,93352.9%White alone
- 3,867,29919.7%Hispanic
- 2,633,84013.4%Black alone
- 1,776,2869.0%Asian alone
- 732,6703.7%Two or more races
- 216,1101.1%Other race alone
- 35,0820.2%American Indian alone
- 6,9310.04%Native Hawaiian and Other
Pacific Islander alone

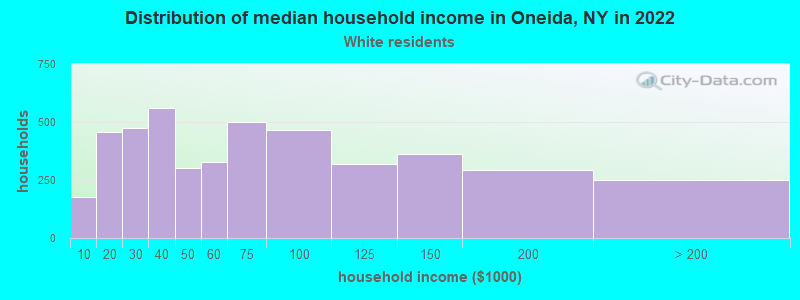
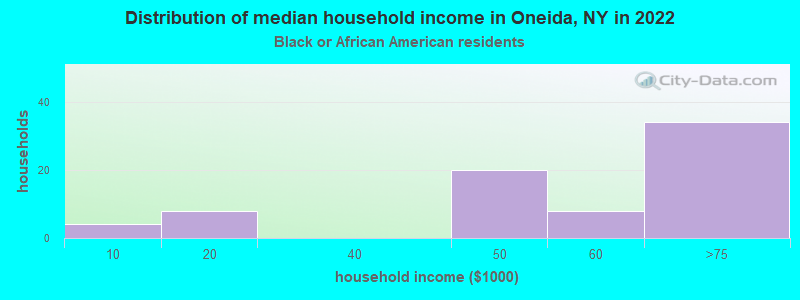
Income and house value in Oneida
- Median household income in 2022
- $57,921White non-Hispanic householders
- $57,382Black householders
- $40,733American Indian and Alaska Native householders
- Median 2022 house value
- $135,001White Non-Hispanic householders
- $155,022Black or African American householders
- $262,185American Indian or Alaska Native householders
- $81,039Hispanic or Latino householders
Household income for White non-Hispanic householders
Household income for Black householders
Household income for American Indian and Alaska Native householders
Household income for Asian householders
Household income for Some other race householders
Household income for Two or more races householders
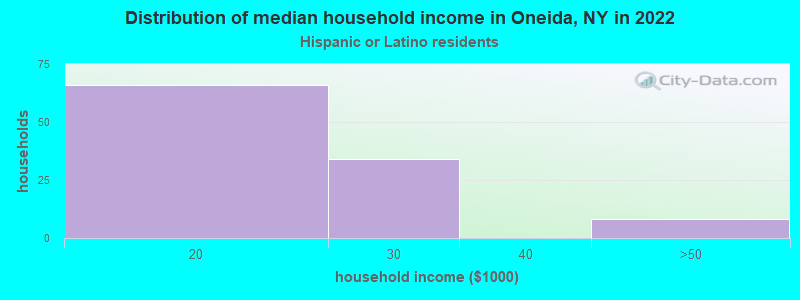
Household income for Hispanic or Latino race householders
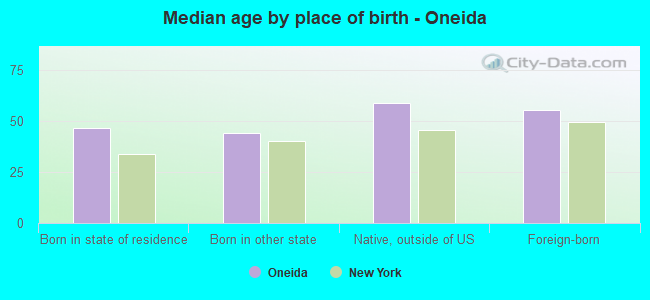
Median age by race in Oneida
- 46.8Median age for White residents
- 44.9Males
- 47.9Females
- 68.1Median age for Black or African American residents
- 43.2Males
- 160.8Females
- 28.2Median age for American Indian / Alaska Native residents
- 35.5Males
- 38.7Females
- 82.4Median age for Asian residents
- 131.4Males
- 54.4Females
- -666,666,666.0Median age for Native Hawaiian / Pacific Islander residents
- -666,666,666.0Males
- -666,666,666.0Females
- 35.1Median age for Other race residents
- 57.0Males
- 18.8Females
- 26.7Median age for Two or more races residents
- 56.7Males
- 25.5Females
- 47.2Median age for White alone residents
- 45.2Males
- 48.9Females
- 35.8Median age for Hispanic or Latino residents
- 36.4Males
- 16.1Females
Owner/renter occupied households by race in Oneida
- House owners and renters - White residents
- 2,79961.9%Owner occupied
- 1,72438.1%Renter occupied
- House owners and renters - Black or African American residents
- 5850.5%Owner occupied
- 5649.5%Renter occupied
- House owners and renters - American Indian / Alaska Native residents
- 629.5%Owner occupied
- 1370.5%Renter occupied
- House owners and renters - Asian residents
- 33100.0%Owner occupied
- House owners and renters - Other race residents
- 3827.9%Owner occupied
- 9872.1%Renter occupied
- House owners and renters - Two or more races residents
- 7464.4%Owner occupied
- 4135.6%Renter occupied
- House owners and renters - White alone residents
- 2,80061.8%Owner occupied
- 1,73338.2%Renter occupied
- House owners and renters - Hispanic or Latino residents
- 45100.0%Renter occupied
Language usage in Oneida
- English speakers - Total
- 96.4% of residents of Oneida speak English at home.
- 1.2% of residents speak Spanish at home
- 9683.5%Speak English very well
- 1916.5%Speak English less than very well
- 2.4% of residents speak other language at home
- 21492.2%Speak English very well
- 187.8%Speak English less than very well
All residents speak only English at home
- English speakers - Native, born elsewhere
- 50.0% of residents of Oneida speak English at home.
- 39.0% of residents speak Spanish at home
- 39100.0%Speak English very well
- English speakers - Foreign-born
- 22.5% of residents of Oneida speak English at home.
- 10.8% of residents speak Spanish at home
- 25100.0%Speak English less than very well
- 68.4% of residents speak other language at home
- 12176.6%Speak English very well
- 3723.4%Speak English less than very well
White (Caucasian) - Speak only English
| Native: | 99.5% (8,651) |
| Foreign-born: | 20.2% (19) |
White (Caucasian) - Speak another language
| Native: | 0.6% (52) |
| Foreign-born: | 97.8% (94) |
Black or African American - Speak only English
| Native: | 55.7% (39) |
| Foreign-born: | 97.5% (22) |
Asian - Speak only English
| Native: | 47.6% (5) |
| Foreign-born: | 10.3% (3) |
Asian - Speak another language
| Native: | 32.9% (3) |
| Foreign-born: | 100.0% (30) |
Other race - Speak another language
| Native: | 19.7% (45) |
| Foreign-born: | 99.8% (32) |
Two or more races - Speak another language
| Native: | 3.5% (13) |
| Foreign-born: | 100.0% (8) |
White alone - Speak only English
| Native: | 99.8% (8,594) |
| Foreign-born: | 21.4% (19) |
White alone - Speak another language
| Native: | 0.4% (35) |
| Foreign-born: | 98.7% (90) |
Hispanic or Latino - Speak another language
| Native: | 30.2% (59) |
| Foreign-born: | 89.0% (28) |
Foreign-born residents in Oneida
179 residents are foreign born
| This city: | 1.8% |
| New York: | 22.6% |
Marital status for residents in Oneida
Marital status - White (Caucasian) population 15 years and over
- Males
- 33.6%Never married
- 47.7%Now married
- 0.5%Separated
- 4.9%Widowed
- 13.3%Divorced
- Females
- 27.6%Never married
- 37.1%Now married
- 4.8%Separated
- 11.9%Widowed
- 18.6%Divorced
Women who gave birth in the past 12 months
| Now married: | 68.5% (97) |
| Unmarried: | 31.5% (45) |
Women who did not give birth in the past 12 months
| Now married: | 45.3% (781) |
| Unmarried: | 54.7% (942) |
Marital status - Black or African American population 15 years and over
- Males
- 19.3%Never married
- 57.9%Now married
- 0.0%Separated
- 22.8%Widowed
- 0.0%Divorced
- Females
- 31.7%Never married
- 0.0%Now married
- 7.3%Separated
- 0.0%Widowed
- 61.0%Divorced
Women who did not give birth in the past 12 months
| Now married: | 0.0% (0) |
| Unmarried: | 100.0% (12) |
Marital status - American Indian / Alaska Native population 15 years and over
- Males
- 44.4%Never married
- 22.2%Now married
- 0.0%Separated
- 0.0%Widowed
- 33.3%Divorced
- Females
- 71.4%Never married
- 23.8%Now married
- 0.0%Separated
- 0.0%Widowed
- 4.8%Divorced
Women who did not give birth in the past 12 months
| Now married: | 0.0% (0) |
| Unmarried: | 100.0% (17) |
Marital status - Asian population 15 years and over
- Males
- 21.4%Never married
- 71.4%Now married
- 0.0%Separated
- 0.0%Widowed
- 7.1%Divorced
- Females
- 10.9%Never married
- 84.8%Now married
- 0.0%Separated
- 0.0%Widowed
- 4.3%Divorced
Women who gave birth in the past 12 months
| Now married: | 100.0% (2) |
| Unmarried: | 0.0% (0) |
Women who did not give birth in the past 12 months
| Now married: | 58.3% (7) |
| Unmarried: | 41.7% (5) |
Marital status - Other race population 15 years and over
- Males
- 53.2%Never married
- 46.8%Now married
- 0.0%Separated
- 0.0%Widowed
- 0.0%Divorced
- Females
- 69.5%Never married
- 30.5%Now married
- 0.0%Separated
- 0.0%Widowed
- 0.0%Divorced
Women who did not give birth in the past 12 months
| Now married: | 22.3% (23) |
| Unmarried: | 77.7% (81) |
Marital status - Two or more races population 15 years and over
- Males
- 26.4%Never married
- 37.4%Now married
- 27.5%Separated
- 0.0%Widowed
- 8.8%Divorced
- Females
- 48.2%Never married
- 21.6%Now married
- 0.7%Separated
- 22.3%Widowed
- 7.2%Divorced
Women who did not give birth in the past 12 months
| Now married: | 11.8% (12) |
| Unmarried: | 88.2% (92) |
Marital status - White alone, not Hispanic / Latino population 15 years and over
- Males
- 33.3%Never married
- 47.9%Now married
- 0.5%Separated
- 4.9%Widowed
- 13.4%Divorced
- Females
- 27.6%Never married
- 37.1%Now married
- 4.8%Separated
- 11.9%Widowed
- 18.6%Divorced
Women who gave birth in the past 12 months
| Now married: | 68.5% (95) |
| Unmarried: | 31.5% (44) |
Women who did not give birth in the past 12 months
| Now married: | 45.4% (767) |
| Unmarried: | 54.6% (922) |
Marital status - Hispanic or Latino population 15 years and over
- Males
- 81.7%Never married
- 18.3%Now married
- 0.0%Separated
- 0.0%Widowed
- 0.0%Divorced
- Females
- 55.6%Never married
- 6.9%Now married
- 1.4%Separated
- 36.1%Widowed
- 0.0%Divorced
Women who did not give birth in the past 12 months
| Now married: | 2.4% (1) |
| Unmarried: | 97.6% (39) |
Ancestries in Oneida

- 1,34929.0%American
- 57812.4%Irish
- 54511.7%Italian
- 46610.0%English
- 4219.1%German
- 2144.6%Scottish
- 912.0%French
- 811.7%Polish
- 791.7%European
- 671.4%Welsh
- 591.3%Dutch
- 481.0%Norwegian
- 400.9%Hungarian
- 320.7%French Canadian
- 310.7%Haitian
- 270.6%Russian
- 220.5%Jamaican
- 190.4%Romanian
- 180.4%Danish
- 120.3%Canadian
- 100.2%Swedish
- 80.2%Nigerian
- 70.2%Belgian
- 60.1%Scotch-Irish
- 40.09%Yugoslavian
- 30.06%Armenian
- 20.04%Lebanese
- 20.04%British
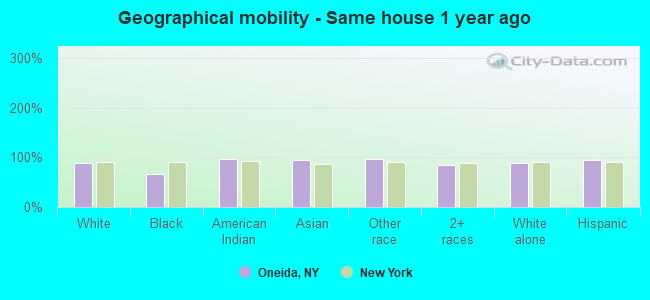
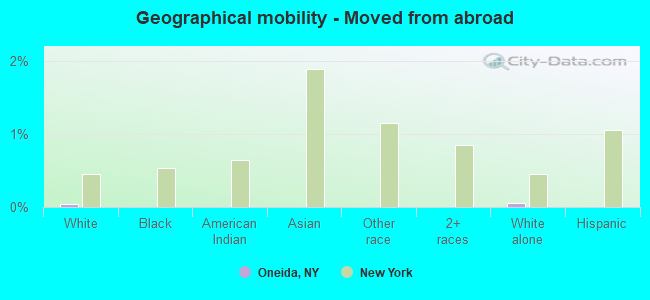
Geographical mobility in Oneida

- Same house 1 year ago
- 8,24589.2%White (Caucasian)
- 6166.0%Black or African American
- 6297.0%American Indian / Alaska Native
- 5794.2%Asian
- 24896.6%Other race
- 40584.9%Two or more races
- 8,14489.2%White alone, not Hispanic / Latino
- 25395.1%Hispanic or Latino
-
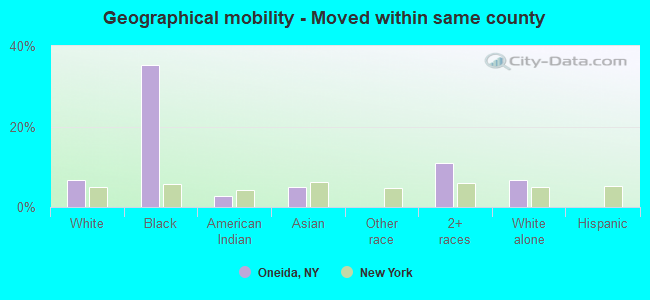
- Moved within same county
- 6096.6%White / Caucasian
- 3335.3%Black or African American
- 22.8%American Indian / Alaska Native
- 35.1%Asian
- 5210.9%Two or more races
- 6156.7%White alone, not Hispanic / Latino
-
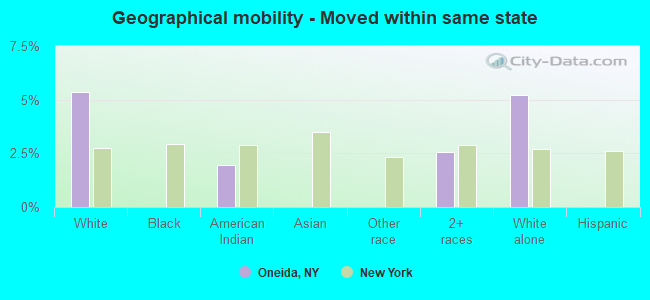
- Moved within same state
- 4965.4%White / Caucasian
- 12.0%American Indian / Alaska Native
- 122.6%Two or more races
- 4775.2%White alone, not Hispanic / Latino
-
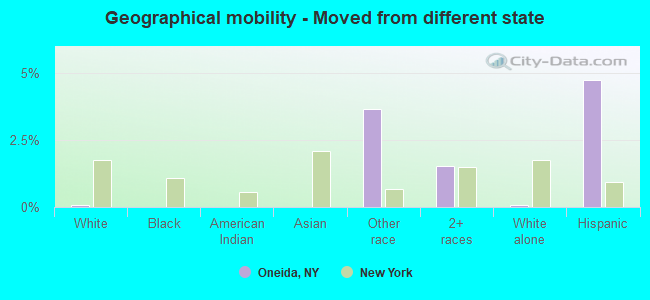
- Moved from different state
- 50.1%White / Caucasian
- 93.6%Other race
- 71.5%Two or more races
- 60.1%White alone, not Hispanic / Latino
- 134.7%Hispanic or Latino
-
- Moved from abroad
- 40.0%White
- 50.1%White alone, not Hispanic / Latino
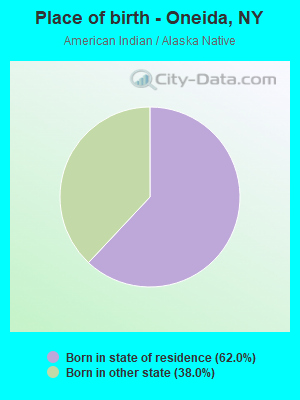
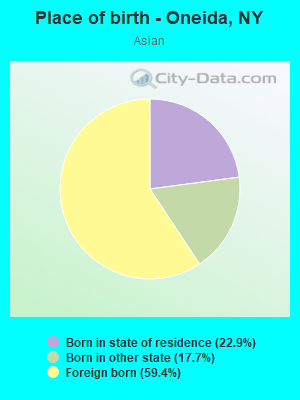
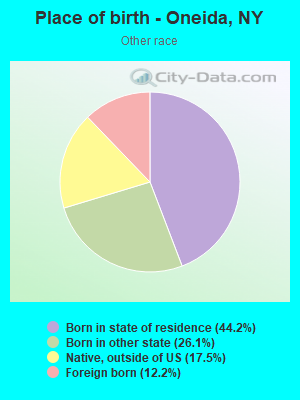
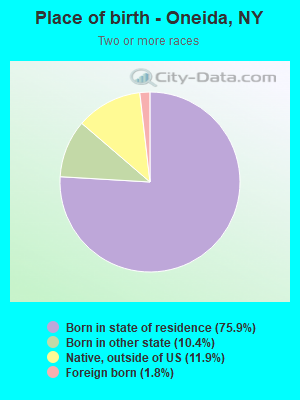
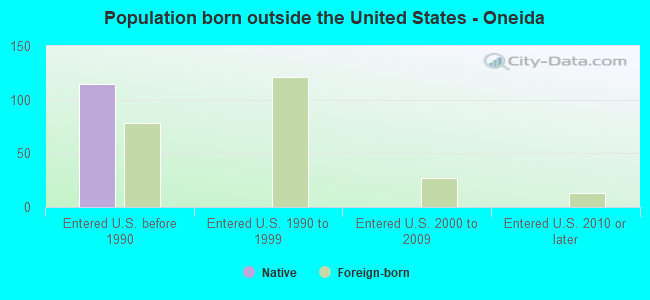
Children Nativity (place of birth) in Oneida
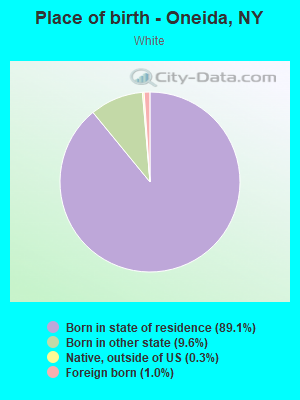
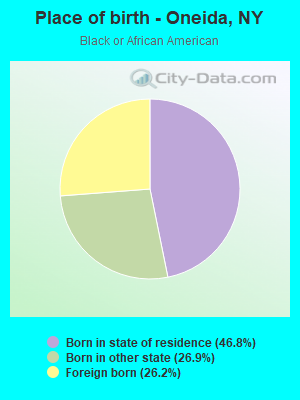
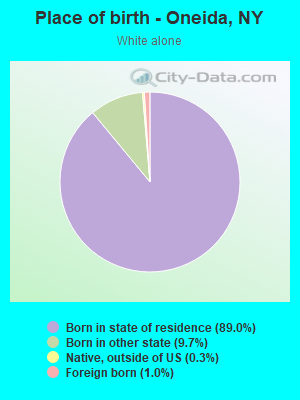
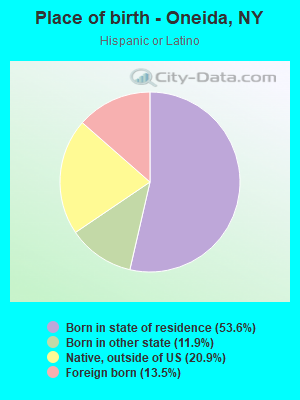
Place of birth for residents in Oneida
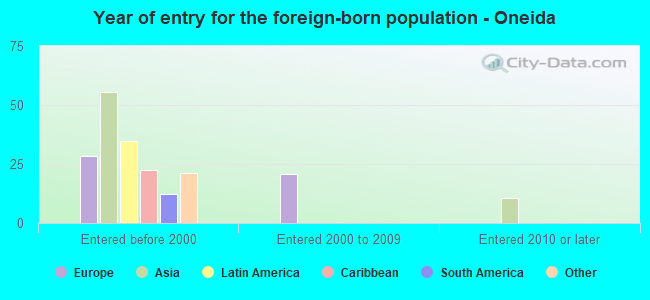
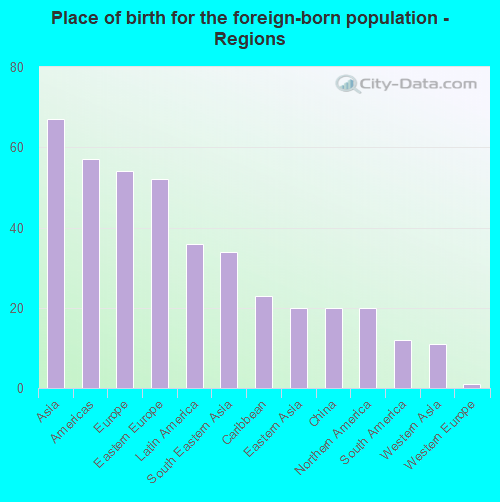
![Place of birth for the foreign-born population - Regions]()
- 67Asia
- 57Americas
- 54Europe
- 52Eastern Europe
- 36Latin America
- 34South Eastern Asia
- 23Caribbean
- 20Eastern Asia
- 20China
- 20Northern America
- 12South America
- 11Western Asia
- 1Western Europe
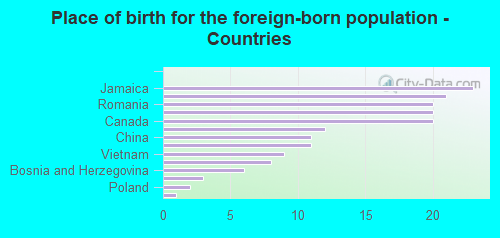
![Place of birth for the foreign-born population - Countries]()
- 23Jamaica
- 21Hungary
- 20Romania
- 20Philippines
- 20Canada
- 12Venezuela
- 11China
- 11Jordan
- 9Vietnam
- 8Hong Kong
- 6Bosnia and Herzegovina
- 3Indonesia
- 2Poland
- 1Germany
Zip codes: 13421.