Races in Oologah, Oklahoma (OK) Detailed Stats
Ancestries, Foreign-born residents, place of birth

Data:
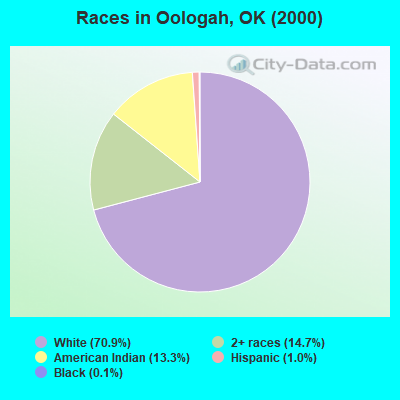
Race distribution in Oologah

- 62670.9%White alone
- 13014.7%Two or more races
- 11713.3%American Indian alone
- 91.0%Hispanic
- 10.1%Black alone
2000
2022
-
- 2,556,36874.1%White alone
- 266,1587.7%American Indian alone
- 257,9817.5%Black alone
- 179,3045.2%Hispanic
- 140,2494.1%Two or more races
- 46,1721.3%Asian alone
- 2,3220.07%Other race alone
- 2,1000.06%Native Hawaiian and Other
Pacific Islander alone
-
- 2,517,40362.6%White alone
- 486,69212.1%Hispanic
- 364,4539.1%Two or more races
- 273,6506.8%American Indian alone
- 268,5436.7%Black alone
- 92,6722.3%Asian alone
- 10,7860.3%Other race alone
- 5,6010.1%Native Hawaiian and Other
Pacific Islander alone
Income and house value in Oologah
- Median household income in 2022
- $54,777White non-Hispanic householders
- $72,861American Indian and Alaska Native householders
- $54,009Two or more races householders
- Median 2022 house value
- $192,644White Non-Hispanic householders
- $200,393American Indian or Alaska Native householders
- $182,491Two or more races householders
Ancestries in Oologah

- 20825.6%Other
- 17421.4%United States
- 13216.2%German
- 8610.6%Irish
- 749.1%English
- 283.4%Polish
- 232.8%Dutch
- 162.0%Scottish
- 141.7%French
- 131.6%Norwegian
- 111.4%Czech
- 91.1%Scotch-Irish
- 70.9%Welsh
- 70.9%West Indian
- 30.4%Danish
- 30.4%Italian
- 30.4%Portuguese
- 20.2%Russian