Races in Opa-locka, Florida (FL) Detailed Stats
Data:
Races - White alone (%)
Races - White alone (% change since 2000)
Races - Black alone (%)
Races - Black alone (% change since 2000)
Races - American Indian alone (%)
Races - American Indian alone (% change since 2000)
Races - Asian alone (%)
Races - Asian alone (% change since 2000)
Races - Hispanic (%)
Races - Hispanic (% change since 2000)
Races - Native Hawaiian and Other Pacific Islander alone (%)
Races - Native Hawaiian and Other Pacific Islander alone (% change since 2000)
Races - Two or more races(%)
Races - Two or more races(% change since 2000)
Races - Other race alone (%)
Races - Other race alone (% change since 2000)
Racial diversity
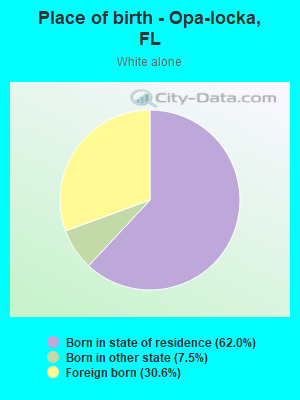
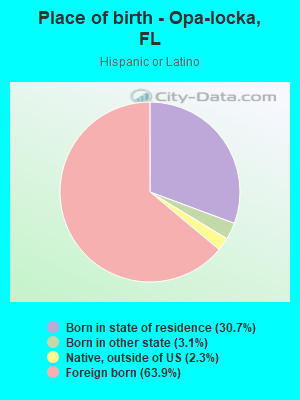
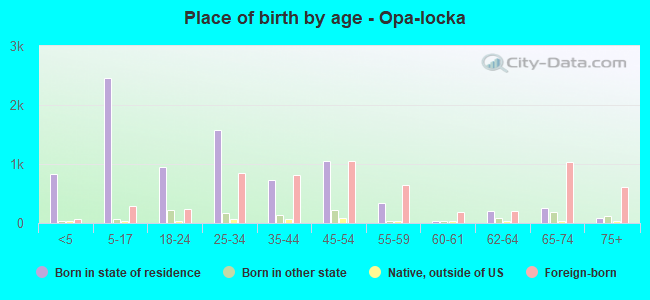
Place of birth - Born in state of residence (%)
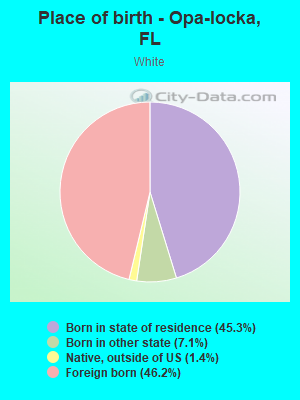
Place of birth - Born in state of residence (%) - White
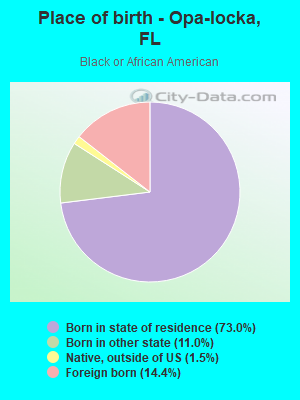
Place of birth - Born in state of residence (%) - Black or African American
Place of birth - Born in state of residence (%) - Asian
Place of birth - Born in state of residence (%) - Hispanic or Latino
Place of birth - Born in state of residence (%) - American Indian and Alaska Native
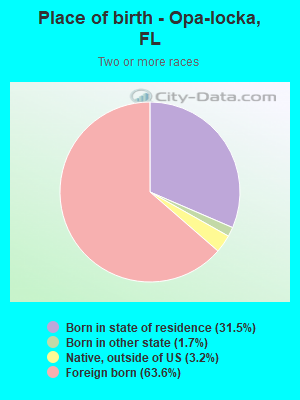
Place of birth - Born in state of residence (%) - Multirace
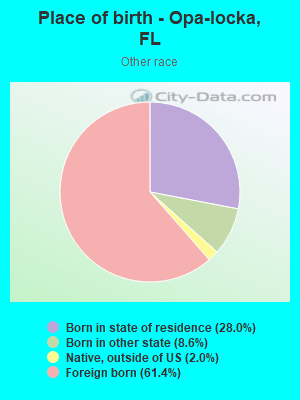
Place of birth - Born in state of residence (%) - Other Race
Place of birth - Born in other state (%)
Place of birth - Born in other state (%) - White
Place of birth - Born in other state (%) - Black or African American
Place of birth - Born in other state (%) - Asian
Place of birth - Born in other state (%) - Hispanic or Latino
Place of birth - Born in other state (%) - American Indian and Alaska Native
Place of birth - Born in other state (%) - Multirace
Place of birth - Born in other state (%) - Other Race
Place of birth - Native, outside of US (%)
Place of birth - Native, outside of US (%) - White
Place of birth - Native, outside of US (%) - Black or African American
Place of birth - Native, outside of US (%) - Asian
Place of birth - Native, outside of US (%) - Hispanic or Latino
Place of birth - Native, outside of US (%) - American Indian and Alaska Native
Place of birth - Native, outside of US (%) - Multirace
Place of birth - Native, outside of US (%) - Other Race
Place of birth - Foreign born (%)
Place of birth - Foreign born (%) - White
Place of birth - Foreign born (%) - Black or African American
Place of birth - Foreign born (%) - Asian
Place of birth - Foreign born (%) - Hispanic or Latino
Place of birth - Foreign born (%) - American Indian and Alaska Native
Place of birth - Foreign born (%) - Multirace
Place of birth - Foreign born (%) - Other Race
Residents speaking English at home (%)
Residents speaking English at home - Born in the United States (%)
Residents speaking English at home - Native, born elsewhere (%)
Residents speaking English at home - Foreign born (%)
Residents speaking Spanish at home (%)
Residents speaking Spanish at home - Born in the United States (%)
Residents speaking Spanish at home - Native, born elsewhere (%)
Residents speaking Spanish at home - Foreign born (%)
Residents speaking other language at home (%)
Residents speaking other language at home - Born in the United States (%)
Residents speaking other language at home - Native, born elsewhere (%)
Residents speaking other language at home - Foreign born (%)
Marital status - Never married (%)
Marital status - Now married (%)
Marital status - Separated (%)
Marital status - Widowed (%)
Marital status - Divorced (%)
Ancestries Reported - Arab (%)
Ancestries Reported - Czech (%)
Ancestries Reported - Danish (%)
Ancestries Reported - Dutch (%)
Ancestries Reported - English (%)
Ancestries Reported - French (%)
Ancestries Reported - French Canadian (%)
Ancestries Reported - German (%)
Ancestries Reported - Greek (%)
Ancestries Reported - Hungarian (%)
Ancestries Reported - Irish (%)
Ancestries Reported - Italian (%)
Ancestries Reported - Lithuanian (%)
Ancestries Reported - Norwegian (%)
Ancestries Reported - Polish (%)
Ancestries Reported - Portuguese (%)
Ancestries Reported - Russian (%)
Ancestries Reported - Scotch-Irish (%)
Ancestries Reported - Scottish (%)
Ancestries Reported - Slovak (%)
Ancestries Reported - Subsaharan African (%)
Ancestries Reported - Swedish (%)
Ancestries Reported - Swiss (%)
Ancestries Reported - Ukrainian (%)
Ancestries Reported - United States (%)
Ancestries Reported - Welsh (%)
Ancestries Reported - West Indian (%)
Ancestries Reported - Other (%)
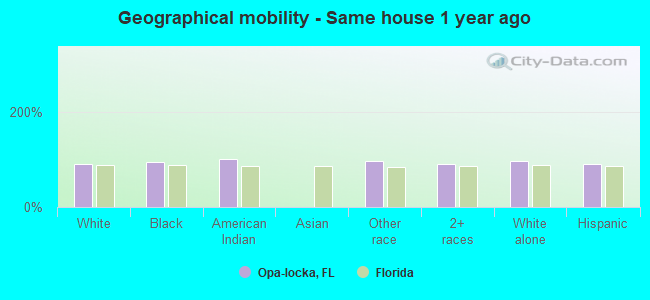
Geographical mobility - Same house 1 year ago (%)
Geographical mobility - Same house 1 year ago (%) - White
Geographical mobility - Same house 1 year ago (%) - Black or African American
Geographical mobility - Same house 1 year ago (%) - Asian
Geographical mobility - Same house 1 year ago (%) - Hispanic or Latino
Geographical mobility - Same house 1 year ago (%) - American Indian and Alaska Native
Geographical mobility - Same house 1 year ago (%) - Multirace
Geographical mobility - Same house 1 year ago (%) - Other Race
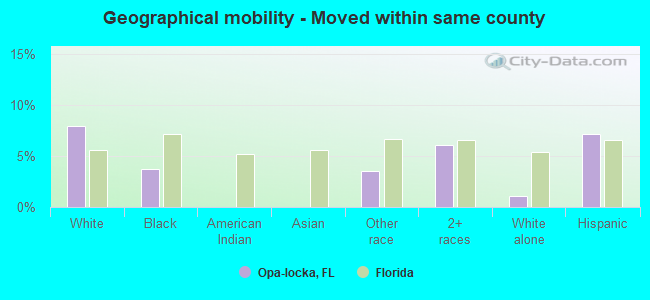
Geographical mobility - Moved within same county (%)
Geographical mobility - Moved within same county (%) - White
Geographical mobility - Moved within same county (%) - Black or African American
Geographical mobility - Moved within same county (%) - Asian
Geographical mobility - Moved within same county (%) - Hispanic or Latino
Geographical mobility - Moved within same county (%) - American Indian and Alaska Native
Geographical mobility - Moved within same county (%) - Multirace
Geographical mobility - Moved within same county (%) - Other Race
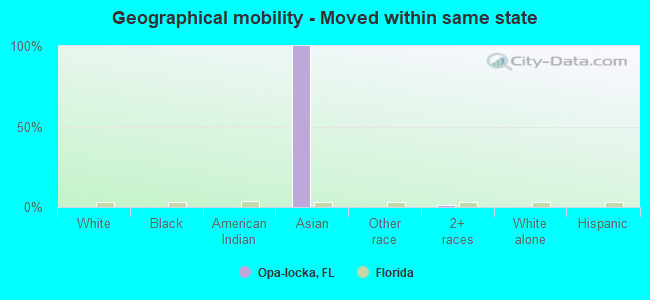
Geographical mobility - Moved from different county within same state (%)
Geographical mobility - Moved from different county within same state (%) - White
Geographical mobility - Moved from different county within same state (%) - Black or African American
Geographical mobility - Moved from different county within same state (%) - Asian
Geographical mobility - Moved from different county within same state (%) - Hispanic or Latino
Geographical mobility - Moved from different county within same state (%) - American Indian and Alaska Native
Geographical mobility - Moved from different county within same state (%) - Multirace
Geographical mobility - Moved from different county within same state (%) - Other Race
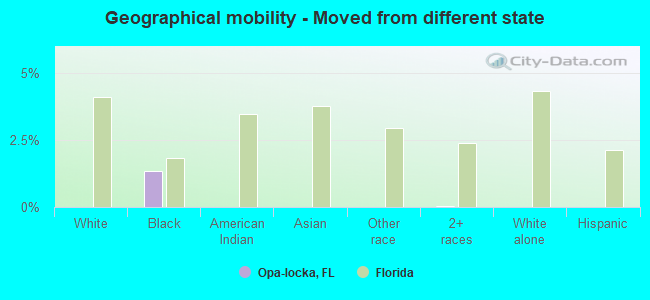
Geographical mobility - Moved from different state (%)
Geographical mobility - Moved from different state (%) - White
Geographical mobility - Moved from different state (%) - Black or African American
Geographical mobility - Moved from different state (%) - Asian
Geographical mobility - Moved from different state (%) - Hispanic or Latino
Geographical mobility - Moved from different state (%) - American Indian and Alaska Native
Geographical mobility - Moved from different state (%) - Multirace
Geographical mobility - Moved from different state (%) - Other Race
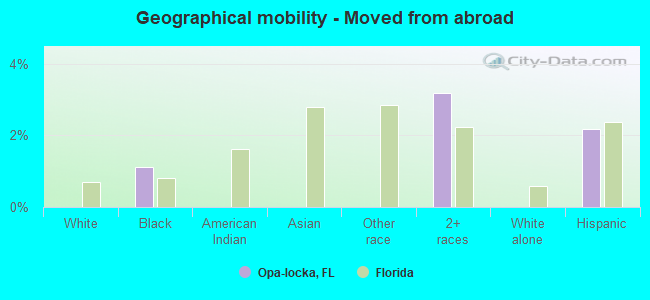
Geographical mobility - Moved from abroad (%)
Geographical mobility - Moved from abroad (%) - White
Geographical mobility - Moved from abroad (%) - Black or African American
Geographical mobility - Moved from abroad (%) - Asian
Geographical mobility - Moved from abroad (%) - Hispanic or Latino
Geographical mobility - Moved from abroad (%) - American Indian and Alaska Native
Geographical mobility - Moved from abroad (%) - Multirace
Geographical mobility - Moved from abroad (%) - Other Race
Place of birth for the foreign-born population - Ireland (%)
Place of birth for the foreign-born population - Denmark (%)
Place of birth for the foreign-born population - Norway (%)
Place of birth for the foreign-born population - Sweden (%)
Place of birth for the foreign-born population - United Kingdom (%)
Place of birth for the foreign-born population - England (%)
Place of birth for the foreign-born population - Scotland (%)
Place of birth for the foreign-born population - Other Northern Europe (%)
Place of birth for the foreign-born population - Austria (%)
Place of birth for the foreign-born population - Belgium (%)
Place of birth for the foreign-born population - France (%)
Place of birth for the foreign-born population - Germany (%)
Place of birth for the foreign-born population - Netherlands (%)
Place of birth for the foreign-born population - Switzerland (%)
Place of birth for the foreign-born population - Other Western Europe (%)
Place of birth for the foreign-born population - Greece (%)
Place of birth for the foreign-born population - Italy (%)
Place of birth for the foreign-born population - Portugal (%)
Place of birth for the foreign-born population - Spain (%)
Place of birth for the foreign-born population - Other Southern Europe (%)
Place of birth for the foreign-born population - Albania (%)
Place of birth for the foreign-born population - Belarus (%)
Place of birth for the foreign-born population - Bosnia and Herzegovina (%)
Place of birth for the foreign-born population - Bulgaria (%)
Place of birth for the foreign-born population - Croatia (%)
Place of birth for the foreign-born population - Czechoslovakia (%)
Place of birth for the foreign-born population - Hungary (%)
Place of birth for the foreign-born population - Latvia (%)
Place of birth for the foreign-born population - Lithuania (%)
Place of birth for the foreign-born population - North Macedonia (Macedonia) (%)
Place of birth for the foreign-born population - Moldova (%)
Place of birth for the foreign-born population - Poland (%)
Place of birth for the foreign-born population - Romania (%)
Place of birth for the foreign-born population - Russia (%)
Place of birth for the foreign-born population - Serbia (%)
Place of birth for the foreign-born population - Ukraine (%)
Place of birth for the foreign-born population - Other Eastern Europe (%)
Place of birth for the foreign-born population - China (%)
Place of birth for the foreign-born population - Hong Kong (%)
Place of birth for the foreign-born population - Taiwan (%)
Place of birth for the foreign-born population - Japan (%)
Place of birth for the foreign-born population - Korea (%)
Place of birth for the foreign-born population - Other Eastern Asia (%)
Place of birth for the foreign-born population - Afghanistan (%)
Place of birth for the foreign-born population - Bangladesh (%)
Place of birth for the foreign-born population - India (%)
Place of birth for the foreign-born population - Iran (%)
Place of birth for the foreign-born population - Kazakhstan (%)
Place of birth for the foreign-born population - Nepal (%)
Place of birth for the foreign-born population - Pakistan (%)
Place of birth for the foreign-born population - Sri Lanka (%)
Place of birth for the foreign-born population - Uzbekistan (%)
Place of birth for the foreign-born population - Other South Central Asia (%)
Place of birth for the foreign-born population - Burma (%)
Place of birth for the foreign-born population - Cambodia (%)
Place of birth for the foreign-born population - Indonesia (%)
Place of birth for the foreign-born population - Laos (%)
Place of birth for the foreign-born population - Malaysia (%)
Place of birth for the foreign-born population - Philippines (%)
Place of birth for the foreign-born population - Singapore (%)
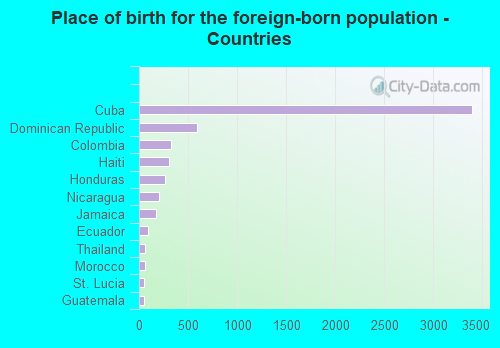
Place of birth for the foreign-born population - Thailand (%)
Place of birth for the foreign-born population - Vietnam (%)
Place of birth for the foreign-born population - Other South Eastern Asia (%)
Place of birth for the foreign-born population - Armenia (%)
Place of birth for the foreign-born population - Iraq (%)
Place of birth for the foreign-born population - Israel (%)
Place of birth for the foreign-born population - Jordan (%)
Place of birth for the foreign-born population - Kuwait (%)
Place of birth for the foreign-born population - Lebanon (%)
Place of birth for the foreign-born population - Saudi Arabia (%)
Place of birth for the foreign-born population - Syria (%)
Place of birth for the foreign-born population - Turkey (%)
Place of birth for the foreign-born population - Yemen (%)
Place of birth for the foreign-born population - Other Western Asia (%)
Place of birth for the foreign-born population - Eritrea (%)
Place of birth for the foreign-born population - Ethiopia (%)
Place of birth for the foreign-born population - Kenya (%)
Place of birth for the foreign-born population - Somalia (%)
Place of birth for the foreign-born population - Uganda (%)
Place of birth for the foreign-born population - Zimbabwe (%)
Place of birth for the foreign-born population - Other Eastern Africa (%)
Place of birth for the foreign-born population - Cameroon (%)
Place of birth for the foreign-born population - Congo (%)
Place of birth for the foreign-born population - Democratic Republic of Congo (Zaire) (%)
Place of birth for the foreign-born population - Other Middle Africa (%)
Place of birth for the foreign-born population - Egypt (%)
Place of birth for the foreign-born population - Morocco (%)
Place of birth for the foreign-born population - Sudan (%)
Place of birth for the foreign-born population - Other Northern Africa (%)
Place of birth for the foreign-born population - South Africa (%)
Place of birth for the foreign-born population - Other Southern Africa (%)
Place of birth for the foreign-born population - Cabo Verde (%)
Place of birth for the foreign-born population - Ghana (%)
Place of birth for the foreign-born population - Liberia (%)
Place of birth for the foreign-born population - Nigeria (%)
Place of birth for the foreign-born population - Senegal (%)
Place of birth for the foreign-born population - Sierra Leone (%)
Place of birth for the foreign-born population - Other Western Africa (%)
Place of birth for the foreign-born population - Australia (%)
Place of birth for the foreign-born population - New Zealand (%)
Place of birth for the foreign-born population - Fiji (%)
Place of birth for the foreign-born population - Micronesia (%)
Place of birth for the foreign-born population - Bahamas (%)
Place of birth for the foreign-born population - Barbados (%)
Place of birth for the foreign-born population - Cuba (%)
Place of birth for the foreign-born population - Dominica (%)
Place of birth for the foreign-born population - Dominican Republic (%)
Place of birth for the foreign-born population - Grenada (%)
Place of birth for the foreign-born population - Haiti (%)
Place of birth for the foreign-born population - Jamaica (%)
Place of birth for the foreign-born population - St. Vincent and the Grenadines (%)
Place of birth for the foreign-born population - Trinidad and Tobago (%)
Place of birth for the foreign-born population - West Indies (%)
Place of birth for the foreign-born population - Other Caribbean (%)
Place of birth for the foreign-born population - Belize (%)
Place of birth for the foreign-born population - Costa Rica (%)
Place of birth for the foreign-born population - El Salvador (%)
Place of birth for the foreign-born population - Guatemala (%)
Place of birth for the foreign-born population - Honduras (%)
Place of birth for the foreign-born population - Mexico (%)
Place of birth for the foreign-born population - Nicaragua (%)
Place of birth for the foreign-born population - Panama (%)
Place of birth for the foreign-born population - Other Central America (%)
Place of birth for the foreign-born population - Argentina (%)
Place of birth for the foreign-born population - Bolivia (%)
Place of birth for the foreign-born population - Brazil (%)
Place of birth for the foreign-born population - Chile (%)
Place of birth for the foreign-born population - Colombia (%)
Place of birth for the foreign-born population - Ecuador (%)
Place of birth for the foreign-born population - Guyana (%)
Place of birth for the foreign-born population - Peru (%)
Place of birth for the foreign-born population - Uruguay (%)
Place of birth for the foreign-born population - Venezuela (%)
Place of birth for the foreign-born population - Other South America (%)
Place of birth for the foreign-born population - Canada (%)
Place of birth for the foreign-born population - Other Northern America (%)
Place of birth for the foreign-born population - Other (%)
Latest news about races in Opa-locka, FL collected exclusively by city-data.com from local newspapers, TV, and radio stations
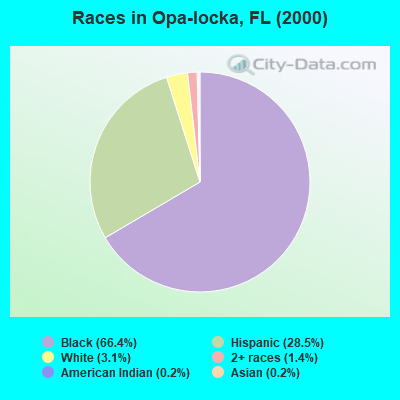
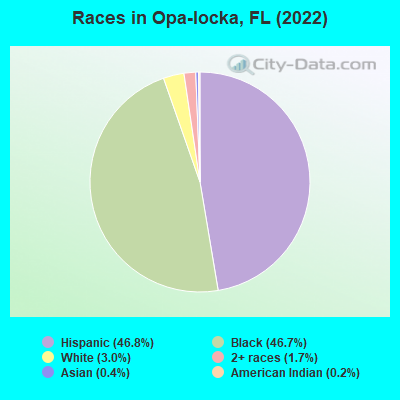
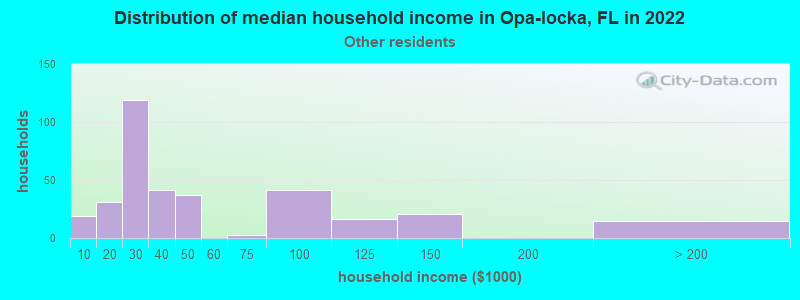
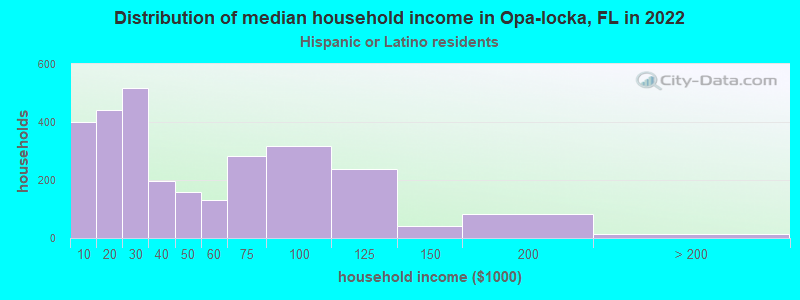
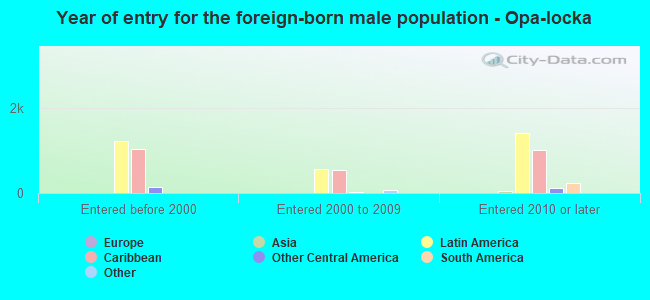
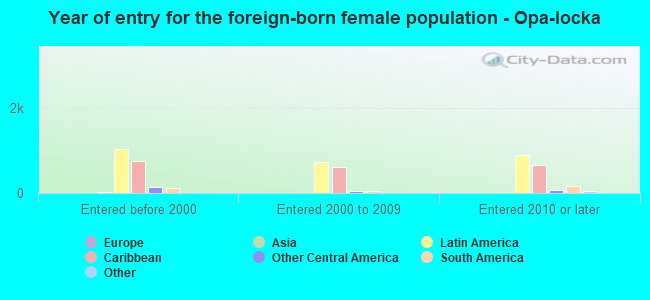
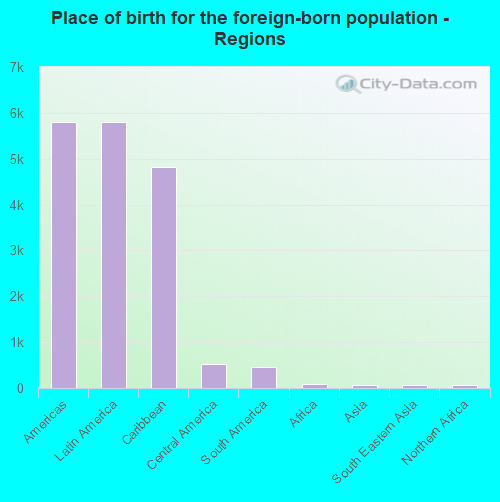
According to 2022 data, the most numerous races in Opa-locka, FL are White alone (477 residents), Hispanic (7,561 residents), and Black alone (7,537 residents). 49.3% of Opa-locka residents speak English at home. 36.9% of Opa-locka, FL residents are foreign-born (35.7% born in Latin America), which is 43.0% greater than the foreign-born rate of 21.0% across the entire state of Florida.
Race distribution in Opa-locka
2000 2022
10,458,509 65.4% White alone 2,682,715 16.8% Hispanic 2,264,268 14.2% Black alone 261,693 1.6% Asian alone 236,954 1.5% Two or more races 42,358 0.3% American Indian alone 28,994 0.2% Other race alone 6,887 0.04% Native Hawaiian and Other
11,309,403 50.8% White alone 6,025,039 27.1% Hispanic 3,241,015 14.6% Black alone 861,630 3.9% Two or more races 623,692 2.8% Asian alone 152,054 0.7% Other race alone 22,504 0.1% American Indian alone 9,486 0.04% Native Hawaiian and Other
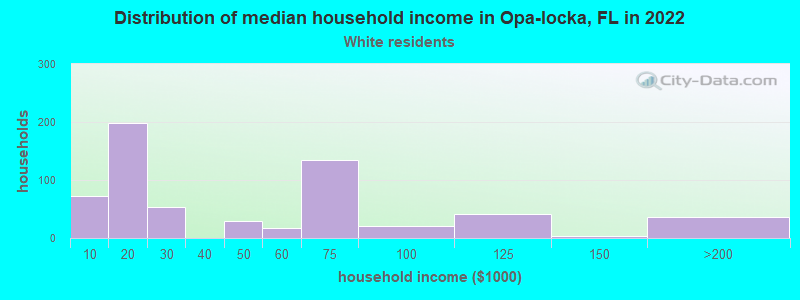
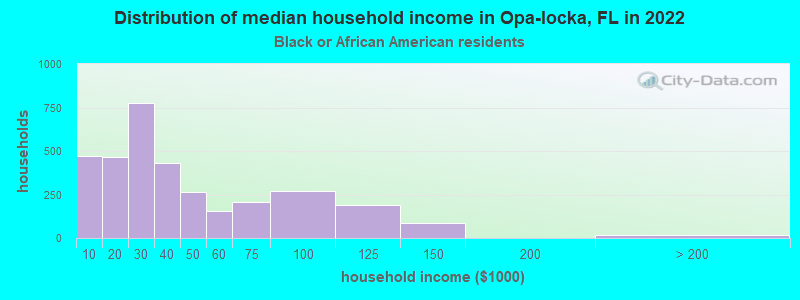
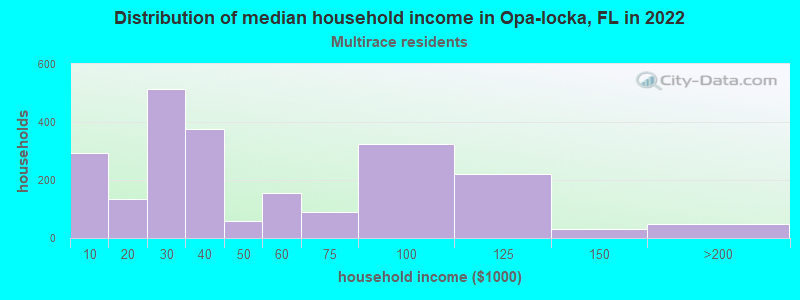
Income and house value in Opa-locka Median household income in 2022 $31,673 Black householders$25,775 Some other race householders$32,666 Two or more races householders$31,169 Hispanic or Latino race householdersMedian 2022 house value $290,033 White Non-Hispanic householders$305,829 Black or African American householders$285,206 Some other race householders$324,696 Two or more races householders$308,023 Hispanic or Latino householders
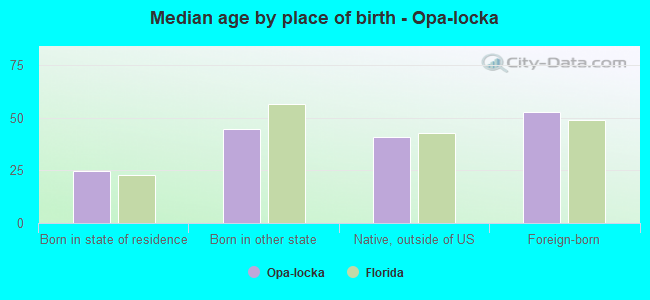
Median age by race in Opa-locka
31.7 Median age for White residents32.2 31.4 34.4 Median age for Black or African American residents32.2 35.4 -653,446,647.1 Median age for American Indian / Alaska Native residents-543,352,600.6 -762,696,213.5 -673,333,332.7 Median age for Asian residents-697,674,417.9 -653,626,731.2 -679,849,340.2 Median age for Native Hawaiian / Pacific Islander residents-858,307,848.3 -443,298,968.6 34.7 Median age for Other race residents32.2 34.7 42.1 Median age for Two or more races residents40.6 42.7 25.9 Median age for White alone residents26.2 25.4 41.6 Median age for Hispanic or Latino residents39.4 43.4
Owner/renter occupied households by race in Opa-locka
House owners and renters - White residents 303 45.3% Owner occupied365 54.7% Renter occupiedHouse owners and renters - Black or African American residents 817 23.8% Owner occupied2,617 76.2% Renter occupiedHouse owners and renters - Asian residents 25 100.0% Renter occupiedHouse owners and renters - Other race residents 117 31.0% Owner occupied260 69.0% Renter occupiedHouse owners and renters - Two or more races residents 880 38.8% Owner occupied1,388 61.2% Renter occupiedHouse owners and renters - White alone residents 18 26.7% Owner occupied49 73.3% Renter occupiedHouse owners and renters - Hispanic or Latino residents 1,180 40.8% Owner occupied1,712 59.2% Renter occupied
Language usage in Opa-locka
English speakers - Total 49.3% of residents of Opa-locka speak English at home.
46.8% of residents speak Spanish at home 3,328 46.8% Speak English very well3,789 53.2% Speak English less than very well4.1% of residents speak other language at home 382 61.2% Speak English very well242 38.8% Speak English less than very well
English speakers - Born in the United States 74.2% of residents of Opa-locka speak English at home.
24.0% of residents speak Spanish at home 255 86.4% Speak English very well40 13.6% Speak English less than very well1.3% of residents speak other language at home 16 100.0% Speak English very well
English speakers - Native, born elsewhere 51.1% of residents of Opa-locka speak English at home.
54.2% of residents speak Spanish at home 107 61.5% Speak English very well67 38.5% Speak English less than very well
English speakers - Foreign-born 12.3% of residents of Opa-locka speak English at home.
81.5% of residents speak Spanish at home 1,215 25.3% Speak English very well3,581 74.7% Speak English less than very well6.7% of residents speak other language at home 160 40.7% Speak English very well233 59.3% Speak English less than very well
White (Caucasian) - Speak only English Native:
18.6% (150)Foreign-born:
5.2% (41)
White (Caucasian) - Speak another language Native:
68.6% (553)Foreign-born:
93.2% (741)
Black or African American - Speak only English Native:
94.1% (6,005)Foreign-born:
52.7% (559)
Black or African American - Speak another language Native:
6.0% (381)Foreign-born:
49.8% (529)
Other race - Speak only English Native:
10.7% (31)Foreign-born:
0.5% (3)
Other race - Speak another language Native:
89.2% (259)Foreign-born:
99.6% (555)
Two or more races - Speak only English Native:
14.4% (279)Foreign-born:
3.2% (125)
Two or more races - Speak another language Native:
85.7% (1,660)Foreign-born:
96.7% (3,805)
White alone - Speak another language Native:
58.1% (199)Foreign-born:
93.5% (129)
Hispanic or Latino - Speak only English Native:
5.5% (121)Foreign-born:
3.9% (188)
Hispanic or Latino - Speak another language Native:
94.1% (2,073)Foreign-born:
96.1% (4,633)
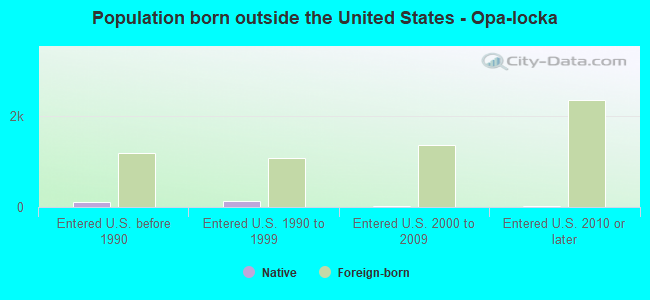
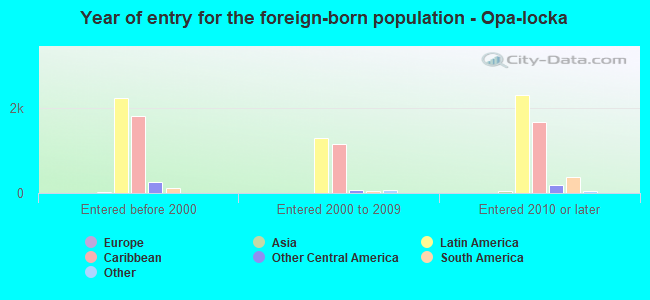
Foreign-born residents in Opa-locka 5,952 residents are foreign born (35.7% Latin America ).
This city:
36.9%Florida:
21.1%
Marital status for residents in Opa-locka Marital status - White (Caucasian) population 15 years and over
Males 33.8% Never married47.5% Now married0.0% Separated1.7% Widowed17.0% DivorcedFemales 42.2% Never married37.1% Now married1.7% Separated3.2% Widowed15.9% DivorcedWomen who gave birth in the past 12 months Now married:
0.0% (0)Unmarried:
100.0% (96)
Women who did not give birth in the past 12 months Now married:
36.7% (124)Unmarried:
63.3% (213)
Marital status - Black or African American population 15 years and over
Males 56.1% Never married22.7% Now married6.3% Separated3.8% Widowed11.1% DivorcedFemales 57.7% Never married18.8% Now married3.0% Separated9.3% Widowed11.2% DivorcedWomen who gave birth in the past 12 months Now married:
49.5% (91)Unmarried:
50.5% (93)
Women who did not give birth in the past 12 months Now married:
18.1% (309)Unmarried:
81.9% (1,397)
Marital status - Asian population 15 years and over
Males 0.0% Never married0.0% Now married100.0% Separated0.0% Widowed0.0% DivorcedFemales 0.0% Never married0.0% Now married100.0% Separated0.0% Widowed0.0% DivorcedWomen who did not give birth in the past 12 months Now married:
100.0% (25)Unmarried:
0.0% (0)
Marital status - Other race population 15 years and over
Males 62.2% Never married25.1% Now married0.4% Separated7.7% Widowed4.6% DivorcedFemales 43.8% Never married24.1% Now married0.0% Separated19.7% Widowed12.4% DivorcedWomen who gave birth in the past 12 months Now married:
0.0% (0)Unmarried:
100.0% (20)
Women who did not give birth in the past 12 months Now married:
14.5% (33)Unmarried:
85.5% (198)
Marital status - Two or more races population 15 years and over
Males 51.4% Never married25.4% Now married4.9% Separated2.2% Widowed16.1% DivorcedFemales 37.2% Never married38.0% Now married1.9% Separated7.2% Widowed15.7% DivorcedWomen who gave birth in the past 12 months Now married:
100.0% (11)Unmarried:
0.0% (0)
Women who did not give birth in the past 12 months Now married:
34.4% (467)Unmarried:
65.6% (888)
Marital status - White alone, not Hispanic / Latino population 15 years and over
Males 0.0% Never married80.6% Now married0.0% Separated0.0% Widowed19.4% DivorcedFemales 97.0% Never married0.0% Now married0.0% Separated3.0% Widowed0.0% DivorcedWomen who gave birth in the past 12 months Now married:
0.0% (0)Unmarried:
100.0% (95)
Women who did not give birth in the past 12 months Now married:
0.0% (0)Unmarried:
100.0% (189)
Marital status - Hispanic or Latino population 15 years and over
Males 48.1% Never married33.6% Now married2.4% Separated3.1% Widowed12.8% DivorcedFemales 33.4% Never married39.6% Now married1.3% Separated8.7% Widowed16.9% DivorcedWomen who gave birth in the past 12 months Now married:
7.2% (7)Unmarried:
92.8% (88)
Women who did not give birth in the past 12 months Now married:
36.5% (519)Unmarried:
63.5% (903)
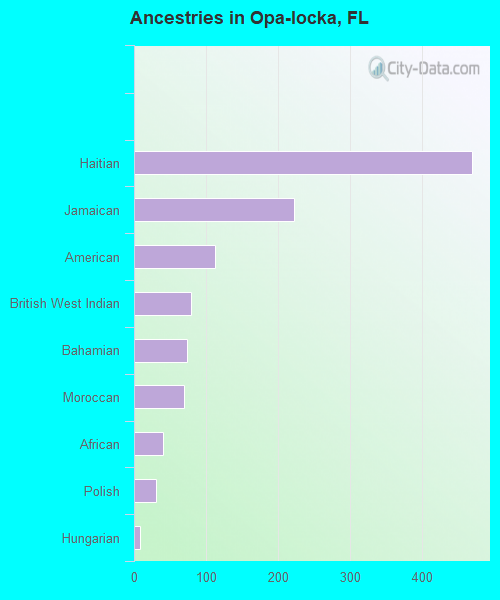
Ancestries in Opa-locka
470 3.7% Haitian222 1.7% Jamaican113 0.9% American79 0.6% British West Indian74 0.6% Bahamian69 0.5% Moroccan41 0.3% African31 0.2% Polish8 0.06% Hungarian4 0.03% Brazilian
Children Nativity (place of birth) in Opa-locka
Children under 6 years - Living with two parents Both parents native 306 100.0% NativeBoth parents foreign-born 7 100.0% NativeOne native, one foreign-born parent 18 100.0% NativeChildren under 6 years - Living with one parent Native parent 393 99.0% Native4 1.0% Foreign-bornForeign-born parent 259 75.1% Native86 24.9% Foreign-bornChildren 6 to 17 years - Living with two parents Both parents native 342 99.8% Native1 0.2% Foreign-bornBoth parents foreign-born 119 77.2% Native35 22.8% Foreign-bornOne native, one foreign-born parent 13 100.0% NativeChildren 6 to 17 years - Living with one parent Native parent 1,101 100.0% NativeForeign-born parent 688 57.1% Native517 42.9% Foreign-born
Grandparents responsible for own grandchildren in Opa-locka
Grandparents (30 to 59 years) White / Caucasian 7 100.0% Responsible for grandchildrenBlack or African American 47 78.6% Responsible for grandchildren13 21.4% Not responsible for grandchildrenTwo or more races 31 100.0% Not responsible for grandchildrenHispanic or Latino 12 32.0% Responsible for grandchildren26 68.0% Not responsible for grandchildrenGrandparents (60 years and over) White / Caucasian 28 100.0% Not responsible for grandchildrenBlack or African American 46 37.9% Responsible for grandchildren75 62.1% Not responsible for grandchildrenTwo or more races 125 100.0% Not responsible for grandchildrenHispanic or Latino 228 100.0% Not responsible for grandchildren