Races in Opportunity, Washington (WA) Detailed Stats
Ancestries, Foreign-born residents, place of birth

Recent posts about races in Opportunity, Washington on our local forum with over 2,400,000 registered users:
 | Short Term Apartment/Home Rental (1 reply) |
Latest news about races in Opportunity, WA collected exclusively by city-data.com from local newspapers, TV, and radio stations
3.5% of Opportunity, WA residents are foreign-born (1.2% born in Europe, 1.1% born in Asia, 0.8% born in North America), which is 328.2% less than the foreign-born rate of 15.0% across the entire state of Washington.
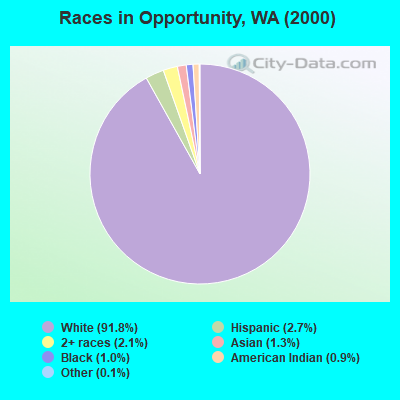
Race distribution in Opportunity

- 23,02191.8%White alone
- 6702.7%Hispanic
- 5302.1%Two or more races
- 3141.3%Asian alone
- 2451.0%Black alone
- 2330.9%American Indian alone
- 250.10%Native Hawaiian and Other
Pacific Islander alone - 270.1%Other race alone
2000
2022
-
- 4,652,49078.9%White alone
- 441,5097.5%Hispanic
- 319,4015.4%Asian alone
- 184,6313.1%Black alone
- 175,9263.0%Two or more races
- 85,3961.4%American Indian alone
- 22,7790.4%Native Hawaiian and Other
Pacific Islander alone - 11,9890.2%Other race alone

-
- 4,941,45663.5%White alone
- 1,093,31314.0%Hispanic
- 755,8329.7%Asian alone
- 523,4486.7%Two or more races
- 299,5373.8%Black alone
- 69,0240.9%American Indian alone
- 52,2310.7%Native Hawaiian and Other
Pacific Islander alone - 50,9450.7%Other race alone

Income and house value in Opportunity
- Median household income in 2022
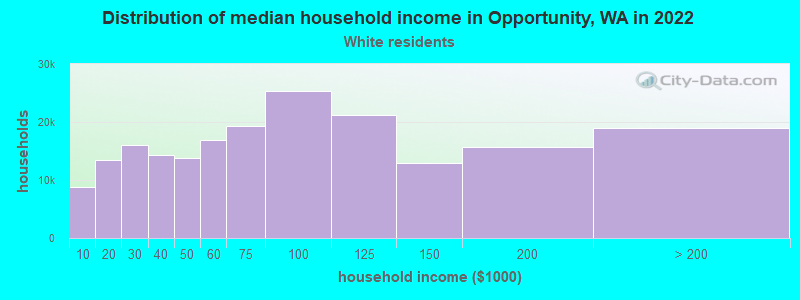
- $72,374White non-Hispanic householders
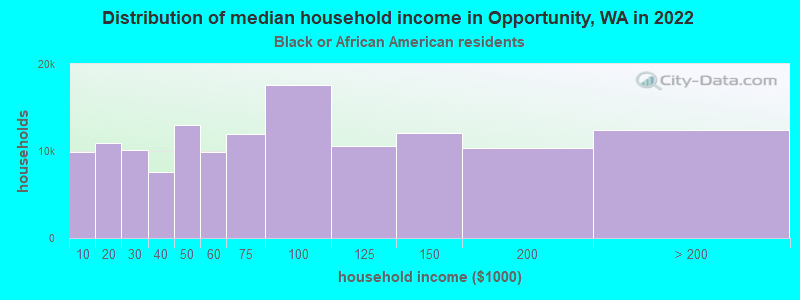
- $69,781Black householders
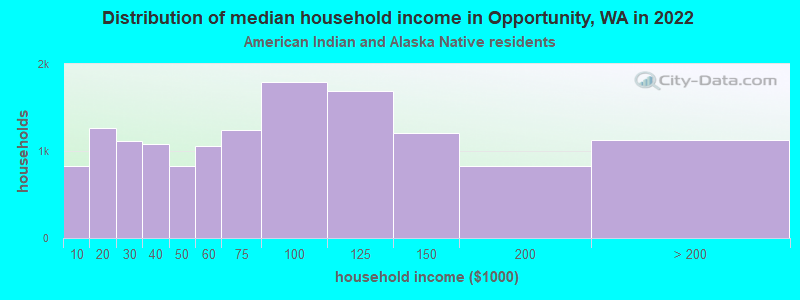
- $68,730American Indian and Alaska Native householders
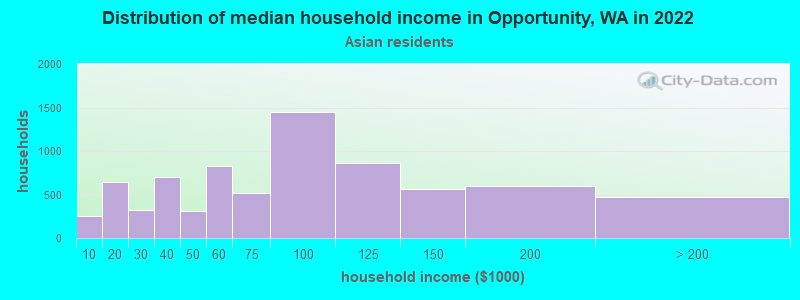
- $159,616Asian householders
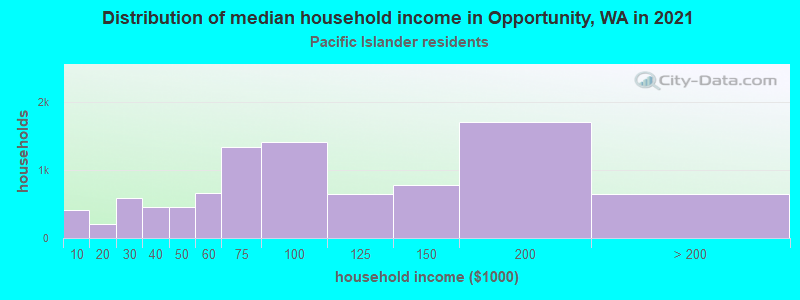
- $32,900Native Hawaiian and other Pacific Islander householders
- $77,149Some other race householders
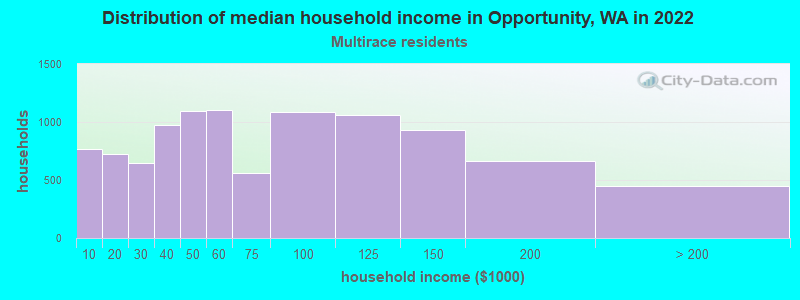
- $43,939Two or more races householders
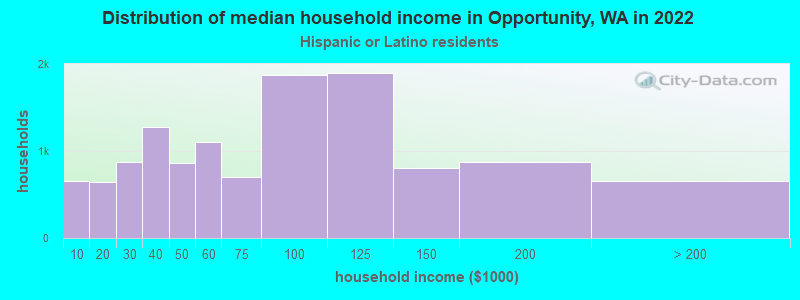
- $91,095Hispanic or Latino race householders
- Median 2022 house value
- $426,335White Non-Hispanic householders
- $420,357Black or African American householders
- $336,285American Indian or Alaska Native householders
- $422,599Asian householders
- $356,836Native Hawaiian and other Pacific Islander householders
- $427,083Some other race householders
- $336,285Two or more races householders
- $391,586Hispanic or Latino householders
Household income for White non-Hispanic householders
Household income for Black householders
Household income for American Indian and Alaska Native householders
Household income for Asian householders
Household income for Native Hawaiian and other Pacific Islander householders
Household income for Two or more races householders
Household income for Hispanic or Latino race householders
Foreign-born residents in Opportunity
878 residents are foreign born (1.2% Europe, 1.1% Asia, 0.8% North America).
| This city: | 3.5% |
| Washington: | 10.4% |
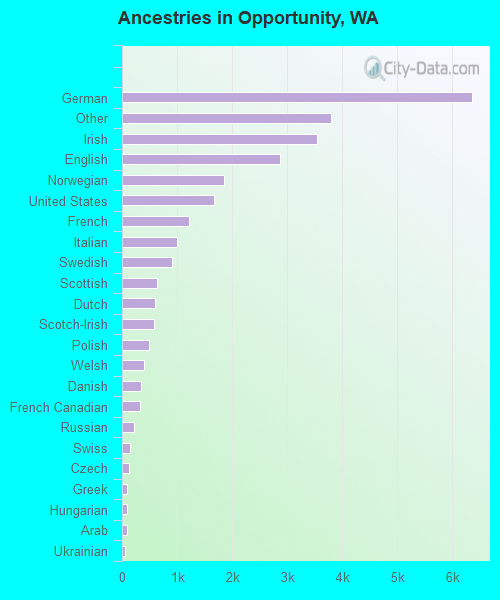
Ancestries in Opportunity

- 6,34623.1%German
- 3,79113.8%Other
- 3,54912.9%Irish
- 2,87710.5%English
- 1,8576.8%Norwegian
- 1,6766.1%United States
- 1,2224.4%French
- 1,0003.6%Italian
- 8993.3%Swedish
- 6432.3%Scottish
- 6002.2%Dutch
- 5822.1%Scotch-Irish
- 4981.8%Polish
- 3951.4%Welsh
- 3441.3%Danish
- 3201.2%French Canadian
- 2140.8%Russian
- 1380.5%Swiss
- 1340.5%Czech
- 880.3%Greek
- 850.3%Hungarian
- 840.3%Arab
- 620.2%Ukrainian
- 480.2%Subsaharan African
- 260.09%Lithuanian
- 100.04%Portuguese
- 80.03%West Indian
Zip codes: 99206.