Races in Orange Lake, New York (NY) Detailed Stats
Data:
Races - White alone (%)
Races - White alone (% change since 2000)
Races - Black alone (%)
Races - Black alone (% change since 2000)
Races - American Indian alone (%)
Races - American Indian alone (% change since 2000)
Races - Asian alone (%)
Races - Asian alone (% change since 2000)
Races - Hispanic (%)
Races - Hispanic (% change since 2000)
Races - Native Hawaiian and Other Pacific Islander alone (%)
Races - Native Hawaiian and Other Pacific Islander alone (% change since 2000)
Races - Two or more races(%)
Races - Two or more races(% change since 2000)
Races - Other race alone (%)
Races - Other race alone (% change since 2000)
Racial diversity
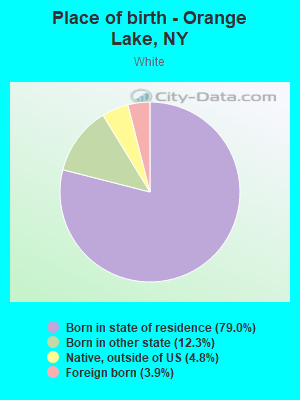
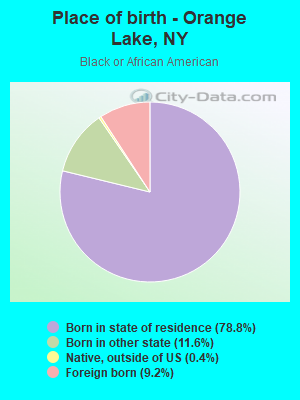
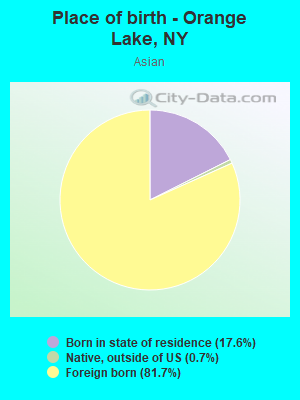
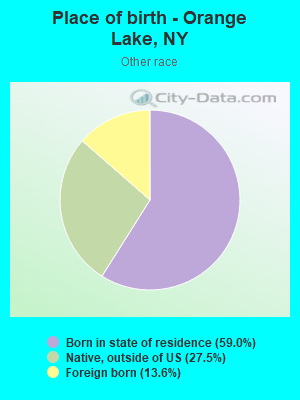
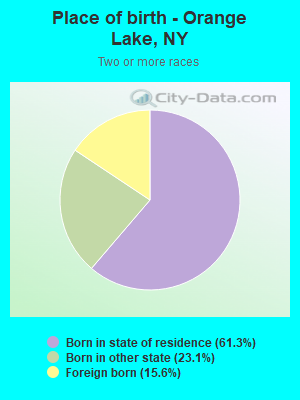
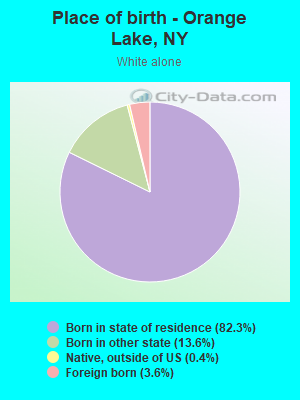
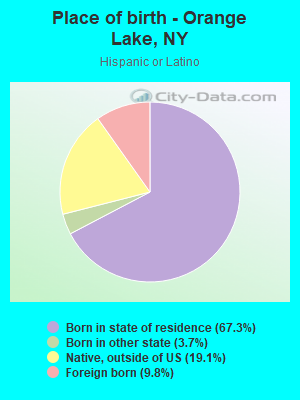
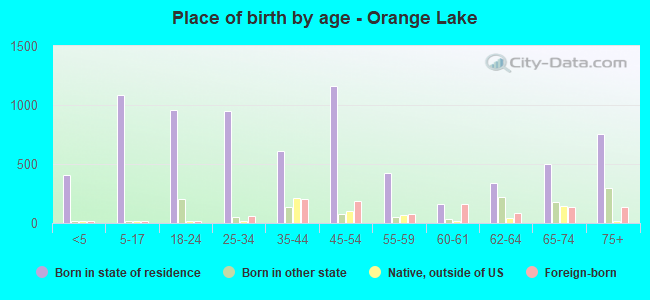
Place of birth - Born in state of residence (%)
Place of birth - Born in state of residence (%) - White
Place of birth - Born in state of residence (%) - Black or African American
Place of birth - Born in state of residence (%) - Asian
Place of birth - Born in state of residence (%) - Hispanic or Latino
Place of birth - Born in state of residence (%) - American Indian and Alaska Native
Place of birth - Born in state of residence (%) - Multirace
Place of birth - Born in state of residence (%) - Other Race
Place of birth - Born in other state (%)
Place of birth - Born in other state (%) - White
Place of birth - Born in other state (%) - Black or African American
Place of birth - Born in other state (%) - Asian
Place of birth - Born in other state (%) - Hispanic or Latino
Place of birth - Born in other state (%) - American Indian and Alaska Native
Place of birth - Born in other state (%) - Multirace
Place of birth - Born in other state (%) - Other Race
Place of birth - Native, outside of US (%)
Place of birth - Native, outside of US (%) - White
Place of birth - Native, outside of US (%) - Black or African American
Place of birth - Native, outside of US (%) - Asian
Place of birth - Native, outside of US (%) - Hispanic or Latino
Place of birth - Native, outside of US (%) - American Indian and Alaska Native
Place of birth - Native, outside of US (%) - Multirace
Place of birth - Native, outside of US (%) - Other Race
Place of birth - Foreign born (%)
Place of birth - Foreign born (%) - White
Place of birth - Foreign born (%) - Black or African American
Place of birth - Foreign born (%) - Asian
Place of birth - Foreign born (%) - Hispanic or Latino
Place of birth - Foreign born (%) - American Indian and Alaska Native
Place of birth - Foreign born (%) - Multirace
Place of birth - Foreign born (%) - Other Race
Residents speaking English at home (%)
Residents speaking English at home - Born in the United States (%)
Residents speaking English at home - Native, born elsewhere (%)
Residents speaking English at home - Foreign born (%)
Residents speaking Spanish at home (%)
Residents speaking Spanish at home - Born in the United States (%)
Residents speaking Spanish at home - Native, born elsewhere (%)
Residents speaking Spanish at home - Foreign born (%)
Residents speaking other language at home (%)
Residents speaking other language at home - Born in the United States (%)
Residents speaking other language at home - Native, born elsewhere (%)
Residents speaking other language at home - Foreign born (%)
Marital status - Never married (%)
Marital status - Now married (%)
Marital status - Separated (%)
Marital status - Widowed (%)
Marital status - Divorced (%)
Ancestries Reported - Arab (%)
Ancestries Reported - Czech (%)
Ancestries Reported - Danish (%)
Ancestries Reported - Dutch (%)
Ancestries Reported - English (%)
Ancestries Reported - French (%)
Ancestries Reported - French Canadian (%)
Ancestries Reported - German (%)
Ancestries Reported - Greek (%)
Ancestries Reported - Hungarian (%)
Ancestries Reported - Irish (%)
Ancestries Reported - Italian (%)
Ancestries Reported - Lithuanian (%)
Ancestries Reported - Norwegian (%)
Ancestries Reported - Polish (%)
Ancestries Reported - Portuguese (%)
Ancestries Reported - Russian (%)
Ancestries Reported - Scotch-Irish (%)
Ancestries Reported - Scottish (%)
Ancestries Reported - Slovak (%)
Ancestries Reported - Subsaharan African (%)
Ancestries Reported - Swedish (%)
Ancestries Reported - Swiss (%)
Ancestries Reported - Ukrainian (%)
Ancestries Reported - United States (%)
Ancestries Reported - Welsh (%)
Ancestries Reported - West Indian (%)
Ancestries Reported - Other (%)
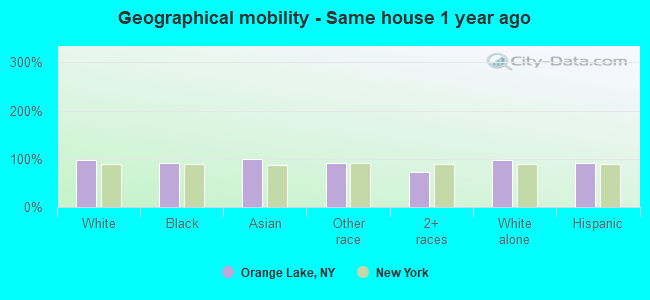
Geographical mobility - Same house 1 year ago (%)
Geographical mobility - Same house 1 year ago (%) - White
Geographical mobility - Same house 1 year ago (%) - Black or African American
Geographical mobility - Same house 1 year ago (%) - Asian
Geographical mobility - Same house 1 year ago (%) - Hispanic or Latino
Geographical mobility - Same house 1 year ago (%) - American Indian and Alaska Native
Geographical mobility - Same house 1 year ago (%) - Multirace
Geographical mobility - Same house 1 year ago (%) - Other Race
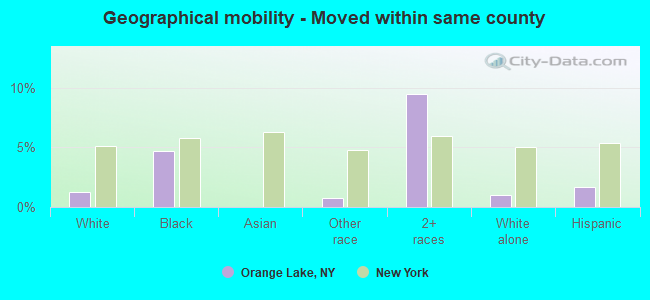
Geographical mobility - Moved within same county (%)
Geographical mobility - Moved within same county (%) - White
Geographical mobility - Moved within same county (%) - Black or African American
Geographical mobility - Moved within same county (%) - Asian
Geographical mobility - Moved within same county (%) - Hispanic or Latino
Geographical mobility - Moved within same county (%) - American Indian and Alaska Native
Geographical mobility - Moved within same county (%) - Multirace
Geographical mobility - Moved within same county (%) - Other Race
Geographical mobility - Moved from different county within same state (%)
Geographical mobility - Moved from different county within same state (%) - White
Geographical mobility - Moved from different county within same state (%) - Black or African American
Geographical mobility - Moved from different county within same state (%) - Asian
Geographical mobility - Moved from different county within same state (%) - Hispanic or Latino
Geographical mobility - Moved from different county within same state (%) - American Indian and Alaska Native
Geographical mobility - Moved from different county within same state (%) - Multirace
Geographical mobility - Moved from different county within same state (%) - Other Race
Geographical mobility - Moved from different state (%)
Geographical mobility - Moved from different state (%) - White
Geographical mobility - Moved from different state (%) - Black or African American
Geographical mobility - Moved from different state (%) - Asian
Geographical mobility - Moved from different state (%) - Hispanic or Latino
Geographical mobility - Moved from different state (%) - American Indian and Alaska Native
Geographical mobility - Moved from different state (%) - Multirace
Geographical mobility - Moved from different state (%) - Other Race
Geographical mobility - Moved from abroad (%)
Geographical mobility - Moved from abroad (%) - White
Geographical mobility - Moved from abroad (%) - Black or African American
Geographical mobility - Moved from abroad (%) - Asian
Geographical mobility - Moved from abroad (%) - Hispanic or Latino
Geographical mobility - Moved from abroad (%) - American Indian and Alaska Native
Geographical mobility - Moved from abroad (%) - Multirace
Geographical mobility - Moved from abroad (%) - Other Race
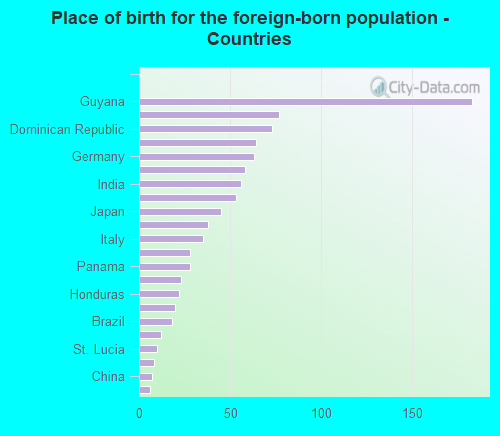
Place of birth for the foreign-born population - Ireland (%)
Place of birth for the foreign-born population - Denmark (%)
Place of birth for the foreign-born population - Norway (%)
Place of birth for the foreign-born population - Sweden (%)
Place of birth for the foreign-born population - United Kingdom (%)
Place of birth for the foreign-born population - England (%)
Place of birth for the foreign-born population - Scotland (%)
Place of birth for the foreign-born population - Other Northern Europe (%)
Place of birth for the foreign-born population - Austria (%)
Place of birth for the foreign-born population - Belgium (%)
Place of birth for the foreign-born population - France (%)
Place of birth for the foreign-born population - Germany (%)
Place of birth for the foreign-born population - Netherlands (%)
Place of birth for the foreign-born population - Switzerland (%)
Place of birth for the foreign-born population - Other Western Europe (%)
Place of birth for the foreign-born population - Greece (%)
Place of birth for the foreign-born population - Italy (%)
Place of birth for the foreign-born population - Portugal (%)
Place of birth for the foreign-born population - Spain (%)
Place of birth for the foreign-born population - Other Southern Europe (%)
Place of birth for the foreign-born population - Albania (%)
Place of birth for the foreign-born population - Belarus (%)
Place of birth for the foreign-born population - Bosnia and Herzegovina (%)
Place of birth for the foreign-born population - Bulgaria (%)
Place of birth for the foreign-born population - Croatia (%)
Place of birth for the foreign-born population - Czechoslovakia (%)
Place of birth for the foreign-born population - Hungary (%)
Place of birth for the foreign-born population - Latvia (%)
Place of birth for the foreign-born population - Lithuania (%)
Place of birth for the foreign-born population - North Macedonia (Macedonia) (%)
Place of birth for the foreign-born population - Moldova (%)
Place of birth for the foreign-born population - Poland (%)
Place of birth for the foreign-born population - Romania (%)
Place of birth for the foreign-born population - Russia (%)
Place of birth for the foreign-born population - Serbia (%)
Place of birth for the foreign-born population - Ukraine (%)
Place of birth for the foreign-born population - Other Eastern Europe (%)
Place of birth for the foreign-born population - China (%)
Place of birth for the foreign-born population - Hong Kong (%)
Place of birth for the foreign-born population - Taiwan (%)
Place of birth for the foreign-born population - Japan (%)
Place of birth for the foreign-born population - Korea (%)
Place of birth for the foreign-born population - Other Eastern Asia (%)
Place of birth for the foreign-born population - Afghanistan (%)
Place of birth for the foreign-born population - Bangladesh (%)
Place of birth for the foreign-born population - India (%)
Place of birth for the foreign-born population - Iran (%)
Place of birth for the foreign-born population - Kazakhstan (%)
Place of birth for the foreign-born population - Nepal (%)
Place of birth for the foreign-born population - Pakistan (%)
Place of birth for the foreign-born population - Sri Lanka (%)
Place of birth for the foreign-born population - Uzbekistan (%)
Place of birth for the foreign-born population - Other South Central Asia (%)
Place of birth for the foreign-born population - Burma (%)
Place of birth for the foreign-born population - Cambodia (%)
Place of birth for the foreign-born population - Indonesia (%)
Place of birth for the foreign-born population - Laos (%)
Place of birth for the foreign-born population - Malaysia (%)
Place of birth for the foreign-born population - Philippines (%)
Place of birth for the foreign-born population - Singapore (%)
Place of birth for the foreign-born population - Thailand (%)
Place of birth for the foreign-born population - Vietnam (%)
Place of birth for the foreign-born population - Other South Eastern Asia (%)
Place of birth for the foreign-born population - Armenia (%)
Place of birth for the foreign-born population - Iraq (%)
Place of birth for the foreign-born population - Israel (%)
Place of birth for the foreign-born population - Jordan (%)
Place of birth for the foreign-born population - Kuwait (%)
Place of birth for the foreign-born population - Lebanon (%)
Place of birth for the foreign-born population - Saudi Arabia (%)
Place of birth for the foreign-born population - Syria (%)
Place of birth for the foreign-born population - Turkey (%)
Place of birth for the foreign-born population - Yemen (%)
Place of birth for the foreign-born population - Other Western Asia (%)
Place of birth for the foreign-born population - Eritrea (%)
Place of birth for the foreign-born population - Ethiopia (%)
Place of birth for the foreign-born population - Kenya (%)
Place of birth for the foreign-born population - Somalia (%)
Place of birth for the foreign-born population - Uganda (%)
Place of birth for the foreign-born population - Zimbabwe (%)
Place of birth for the foreign-born population - Other Eastern Africa (%)
Place of birth for the foreign-born population - Cameroon (%)
Place of birth for the foreign-born population - Congo (%)
Place of birth for the foreign-born population - Democratic Republic of Congo (Zaire) (%)
Place of birth for the foreign-born population - Other Middle Africa (%)
Place of birth for the foreign-born population - Egypt (%)
Place of birth for the foreign-born population - Morocco (%)
Place of birth for the foreign-born population - Sudan (%)
Place of birth for the foreign-born population - Other Northern Africa (%)
Place of birth for the foreign-born population - South Africa (%)
Place of birth for the foreign-born population - Other Southern Africa (%)
Place of birth for the foreign-born population - Cabo Verde (%)
Place of birth for the foreign-born population - Ghana (%)
Place of birth for the foreign-born population - Liberia (%)
Place of birth for the foreign-born population - Nigeria (%)
Place of birth for the foreign-born population - Senegal (%)
Place of birth for the foreign-born population - Sierra Leone (%)
Place of birth for the foreign-born population - Other Western Africa (%)
Place of birth for the foreign-born population - Australia (%)
Place of birth for the foreign-born population - New Zealand (%)
Place of birth for the foreign-born population - Fiji (%)
Place of birth for the foreign-born population - Micronesia (%)
Place of birth for the foreign-born population - Bahamas (%)
Place of birth for the foreign-born population - Barbados (%)
Place of birth for the foreign-born population - Cuba (%)
Place of birth for the foreign-born population - Dominica (%)
Place of birth for the foreign-born population - Dominican Republic (%)
Place of birth for the foreign-born population - Grenada (%)
Place of birth for the foreign-born population - Haiti (%)
Place of birth for the foreign-born population - Jamaica (%)
Place of birth for the foreign-born population - St. Vincent and the Grenadines (%)
Place of birth for the foreign-born population - Trinidad and Tobago (%)
Place of birth for the foreign-born population - West Indies (%)
Place of birth for the foreign-born population - Other Caribbean (%)
Place of birth for the foreign-born population - Belize (%)
Place of birth for the foreign-born population - Costa Rica (%)
Place of birth for the foreign-born population - El Salvador (%)
Place of birth for the foreign-born population - Guatemala (%)
Place of birth for the foreign-born population - Honduras (%)
Place of birth for the foreign-born population - Mexico (%)
Place of birth for the foreign-born population - Nicaragua (%)
Place of birth for the foreign-born population - Panama (%)
Place of birth for the foreign-born population - Other Central America (%)
Place of birth for the foreign-born population - Argentina (%)
Place of birth for the foreign-born population - Bolivia (%)
Place of birth for the foreign-born population - Brazil (%)
Place of birth for the foreign-born population - Chile (%)
Place of birth for the foreign-born population - Colombia (%)
Place of birth for the foreign-born population - Ecuador (%)
Place of birth for the foreign-born population - Guyana (%)
Place of birth for the foreign-born population - Peru (%)
Place of birth for the foreign-born population - Uruguay (%)
Place of birth for the foreign-born population - Venezuela (%)
Place of birth for the foreign-born population - Other South America (%)
Place of birth for the foreign-born population - Canada (%)
Place of birth for the foreign-born population - Other Northern America (%)
Place of birth for the foreign-born population - Other (%)
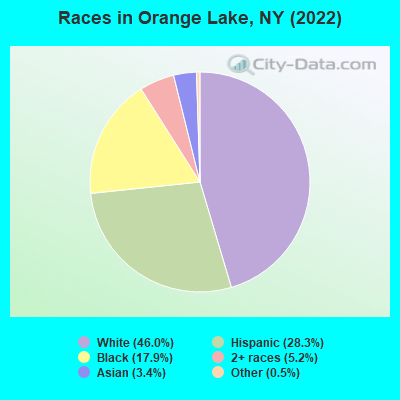
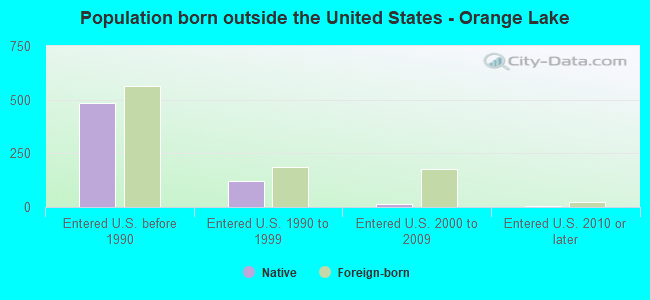
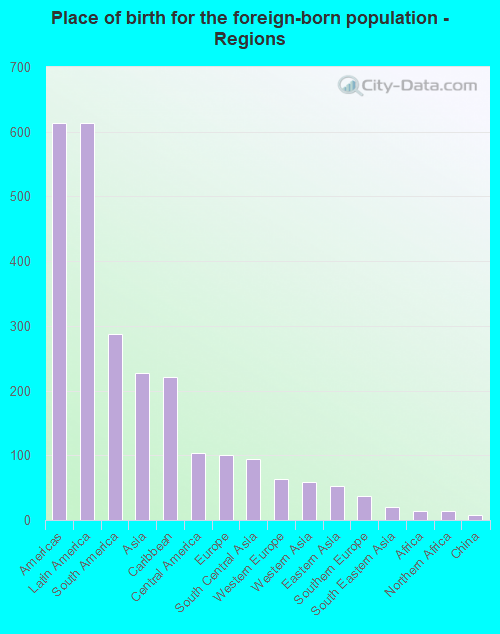
According to 2022 data, the most numerous races in Orange Lake, NY are White alone (4,680 residents), Hispanic (2,876 residents), and Black alone (1,826 residents). 77.1% of Orange Lake residents speak English at home. 9.4% of Orange Lake, NY residents are foreign-born (6.2% born in Latin America, 2.3% born in Asia, 1.0% born in Europe), which is 134.0% less than the foreign-born rate of 22.0% across the entire state of New York.
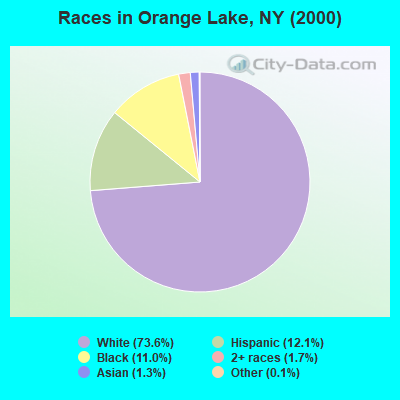
Race distribution in Orange Lake
2000 2022
11,760,981 62.0% White alone 2,867,583 15.1% Hispanic 2,812,623 14.8% Black alone 1,035,926 5.5% Asian alone 366,116 1.9% Two or more races 75,499 0.4% Other race alone 52,499 0.3% American Indian alone 5,230 0.03% Native Hawaiian and Other
10,408,933 52.9% White alone 3,867,299 19.7% Hispanic 2,633,840 13.4% Black alone 1,776,286 9.0% Asian alone 732,670 3.7% Two or more races 216,110 1.1% Other race alone 35,082 0.2% American Indian alone 6,931 0.04% Native Hawaiian and Other
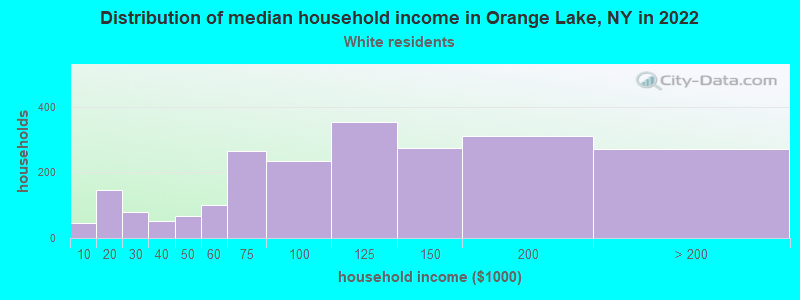
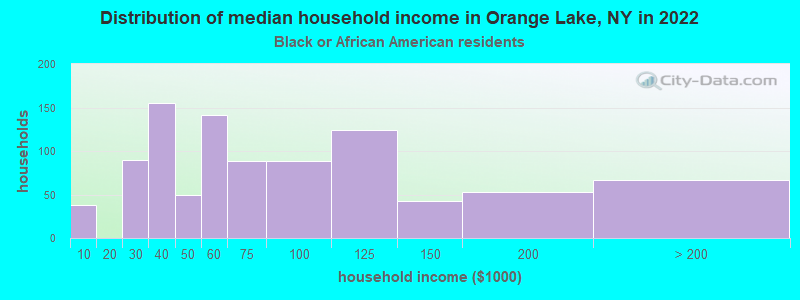
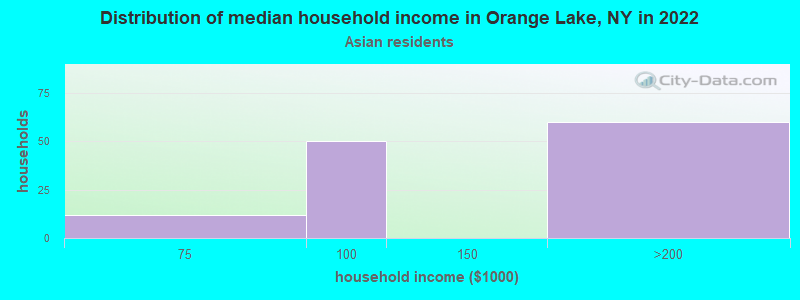
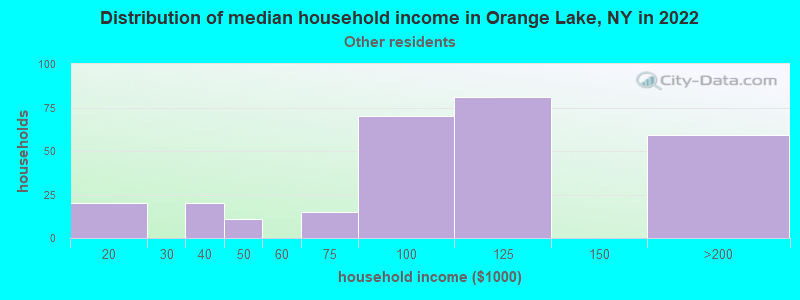
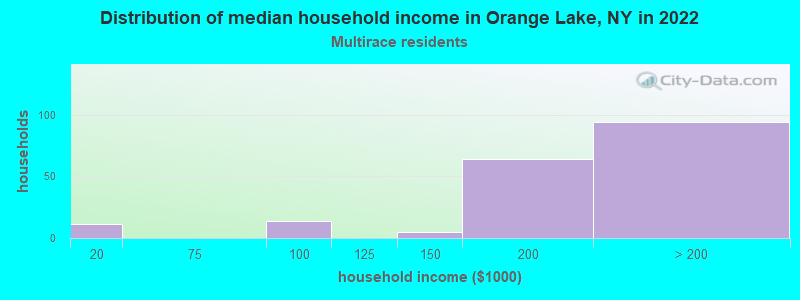
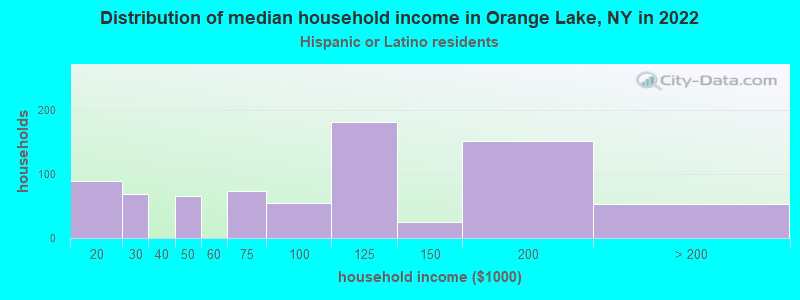
Income and house value in Orange Lake Median household income in 2022 $103,580 White non-Hispanic householders$64,346 Black householders$127,456 Some other race householders$195,403 Two or more races householders$112,747 Hispanic or Latino race householdersMedian 2022 house value $341,888 White Non-Hispanic householders$368,938 Black or African American householders$187,850 American Indian or Alaska Native householders$373,948 Some other race householders$367,436 Two or more races householders$357,166 Hispanic or Latino householders
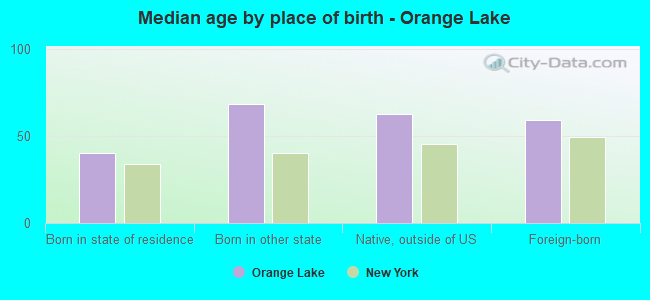
Median age by race in Orange Lake
50.1 Median age for White residents49.3 52.1 48.4 Median age for Black or African American residents36.3 53.2 -671,929,823.9 Median age for American Indian / Alaska Native residents-677,083,332.7 -603,603,603.0 45.6 Median age for Asian residents68.1 41.8 -487,992,314.6 Median age for Native Hawaiian / Pacific Islander residents-477,502,295.2 -497,387,669.3 39.7 Median age for Other race residents44.4 24.5 24.4 Median age for Two or more races residents24.7 24.2 51.4 Median age for White alone residents51.0 54.3 36.8 Median age for Hispanic or Latino residents38.0 33.9
Owner/renter occupied households by race in Orange Lake
House owners and renters - White residents 1,946 86.7% Owner occupied299 13.3% Renter occupiedHouse owners and renters - Black or African American residents 899 97.5% Owner occupied23 2.5% Renter occupiedHouse owners and renters - Asian residents 135 100.0% Owner occupiedHouse owners and renters - Other race residents 317 97.2% Owner occupied9 2.8% Renter occupiedHouse owners and renters - Two or more races residents 176 86.3% Owner occupied28 13.7% Renter occupiedHouse owners and renters - White alone residents 1,700 88.4% Owner occupied223 11.6% Renter occupiedHouse owners and renters - Hispanic or Latino residents 688 87.7% Owner occupied97 12.3% Renter occupied
Language usage in Orange Lake
English speakers - Total 77.1% of residents of Orange Lake speak English at home.
16.3% of residents speak Spanish at home 1,072 67.3% Speak English very well522 32.7% Speak English less than very well4.4% of residents speak other language at home 376 87.6% Speak English very well53 12.4% Speak English less than very well
English speakers - Born in the United States 93.4% of residents of Orange Lake speak English at home.
5.5% of residents speak Spanish at home 64 100.0% Speak English very well
English speakers - Native, born elsewhere 39.2% of residents of Orange Lake speak English at home.
56.0% of residents speak Spanish at home 204 58.8% Speak English very well143 41.2% Speak English less than very well
English speakers - Foreign-born 38.8% of residents of Orange Lake speak English at home.
26.9% of residents speak Spanish at home 203 71.7% Speak English very well80 28.3% Speak English less than very well29.4% of residents speak other language at home 264 85.2% Speak English very well46 14.8% Speak English less than very well
White (Caucasian) - Speak only English Native:
87.0% (4,296)Foreign-born:
34.2% (73)
White (Caucasian) - Speak another language Native:
11.3% (557)Foreign-born:
63.3% (134)
Black or African American - Speak only English Native:
92.9% (1,863)Foreign-born:
71.2% (145)
Asian - Speak only English Native:
100.0% (18)Foreign-born:
43.1% (124)
Other race - Speak only English Native:
50.8% (505)Foreign-born:
20.2% (35)
Other race - Speak another language Native:
50.3% (500)Foreign-born:
83.8% (146)
Two or more races - Speak only English Native:
62.5% (593)Foreign-born:
18.4% (30)
Two or more races - Speak another language Native:
39.0% (370)Foreign-born:
68.3% (112)
White alone - Speak only English Native:
91.9% (4,024)Foreign-born:
42.0% (72)
White alone - Speak another language Native:
3.4% (148)Foreign-born:
57.5% (98)
Hispanic or Latino - Speak only English Native:
52.6% (1,243)Foreign-born:
10.9% (30)
Hispanic or Latino - Speak another language Native:
47.4% (1,121)Foreign-born:
88.1% (245)
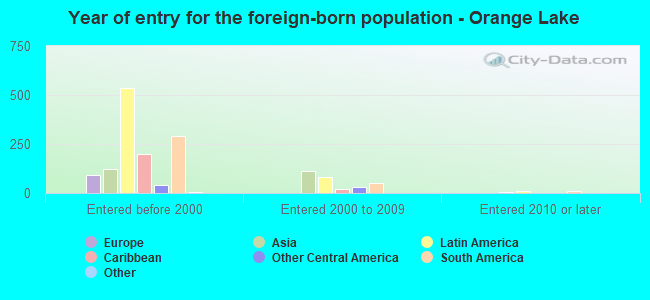
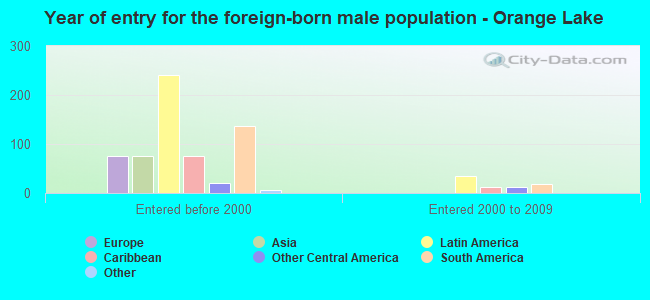
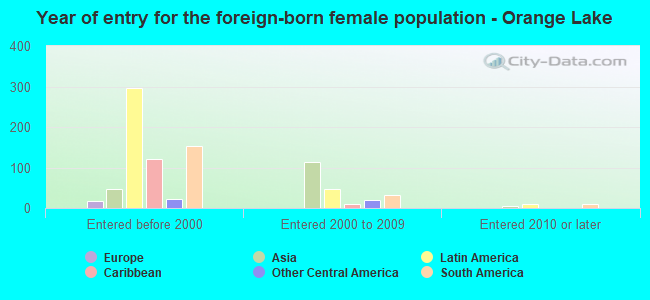
Foreign-born residents in Orange Lake 957 residents are foreign born (6.2% Latin America , 2.3% Asia , 1.0% Europe ).
This city:
9.4%New York:
22.6%
Marital status for residents in Orange Lake Marital status - White (Caucasian) population 15 years and over
Males 28.2% Never married57.1% Now married1.4% Separated4.4% Widowed8.8% DivorcedFemales 16.3% Never married56.9% Now married0.6% Separated9.1% Widowed17.1% DivorcedWomen who gave birth in the past 12 months Now married:
100.0% (42)Unmarried:
0.0% (0)
Women who did not give birth in the past 12 months Now married:
54.3% (549)Unmarried:
45.7% (462)
Marital status - Black or African American population 15 years and over
Males 38.6% Never married46.8% Now married0.0% Separated10.3% Widowed4.3% DivorcedFemales 33.9% Never married35.6% Now married0.0% Separated7.6% Widowed22.9% DivorcedWomen who did not give birth in the past 12 months Now married:
45.1% (203)Unmarried:
54.9% (248)
Marital status - Asian population 15 years and over
Males 33.3% Never married66.7% Now married0.0% Separated0.0% Widowed0.0% DivorcedFemales 55.4% Never married44.6% Now married0.0% Separated0.0% Widowed0.0% DivorcedWomen who did not give birth in the past 12 months Now married:
7.6% (9)Unmarried:
92.4% (108)
Marital status - Other race population 15 years and over
Males 28.7% Never married66.1% Now married0.0% Separated1.1% Widowed4.1% DivorcedFemales 52.2% Never married35.1% Now married0.0% Separated10.6% Widowed2.1% DivorcedWomen who did not give birth in the past 12 months Now married:
32.7% (128)Unmarried:
67.3% (265)
Marital status - Two or more races population 15 years and over
Males 70.7% Never married19.6% Now married9.8% Separated0.0% Widowed0.0% DivorcedFemales 78.9% Never married17.7% Now married0.0% Separated0.0% Widowed3.4% DivorcedWomen who did not give birth in the past 12 months Now married:
0.6% (3)Unmarried:
99.4% (460)
Marital status - White alone, not Hispanic / Latino population 15 years and over
Males 28.4% Never married55.3% Now married1.1% Separated5.1% Widowed10.1% DivorcedFemales 15.5% Never married60.1% Now married0.7% Separated11.1% Widowed12.6% DivorcedWomen who did not give birth in the past 12 months Now married:
57.5% (498)Unmarried:
42.5% (369)
Marital status - Hispanic or Latino population 15 years and over
Males 43.2% Never married54.6% Now married1.8% Separated0.4% Widowed0.0% DivorcedFemales 37.8% Never married42.3% Now married0.0% Separated3.5% Widowed16.3% DivorcedWomen who gave birth in the past 12 months Now married:
100.0% (51)Unmarried:
0.0% (0)
Women who did not give birth in the past 12 months Now married:
38.2% (307)Unmarried:
61.8% (497)
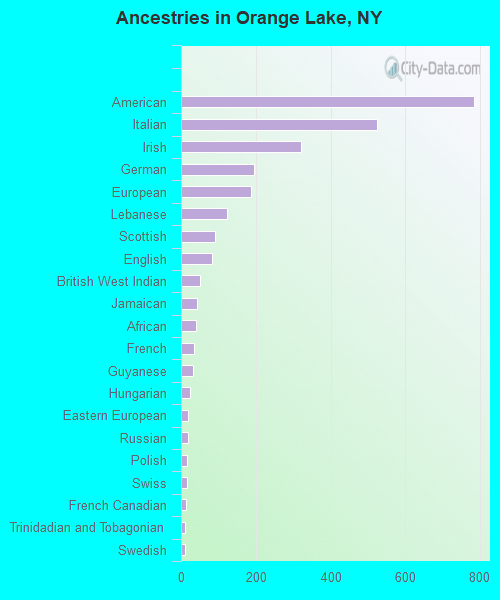
Ancestries in Orange Lake
784 15.0% American525 10.1% Italian320 6.1% Irish194 3.7% German186 3.6% European123 2.4% Lebanese92 1.8% Scottish84 1.6% English50 1.0% British West Indian42 0.8% Jamaican40 0.8% African35 0.7% French31 0.6% Guyanese24 0.5% Hungarian20 0.4% Eastern European19 0.4% Russian17 0.3% Polish16 0.3% Swiss14 0.3% French Canadian12 0.2% Trinidadian and Tobagonian10 0.2% Swedish
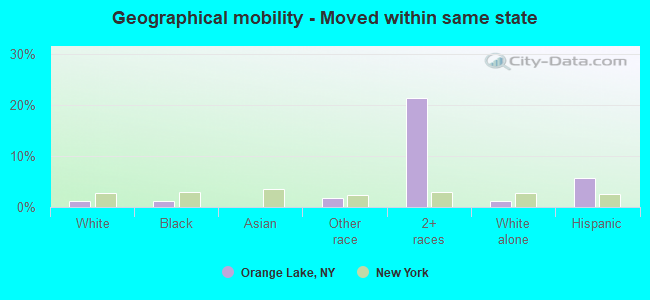
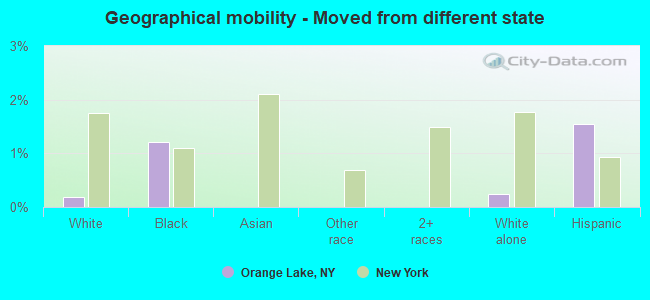
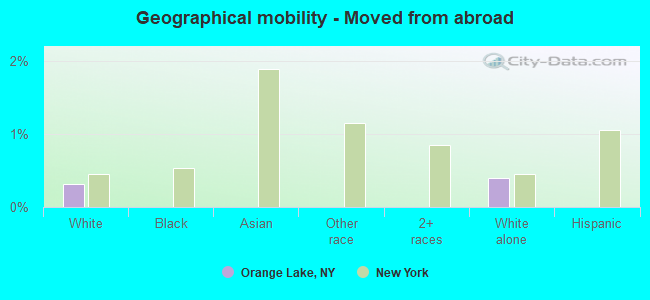
Geographical mobility in Orange Lake Same house 1 year ago 5,154 97.7% White (Caucasian)2,045 90.9% Black or African American335 99.1% Asian1,104 90.5% Other race892 73.3% Two or more races4,553 97.4% White alone, not Hispanic / Latino2,549 90.5% Hispanic or LatinoMoved within same county 64 1.2% White / Caucasian107 4.7% Black or African American9 0.7% Other race115 9.5% Two or more races46 1.0% White alone, not Hispanic / Latino48 1.7% Hispanic or LatinoMoved within same state 67 1.3% White / Caucasian27 1.2% Black or African American21 1.8% Other race260 21.3% Two or more races59 1.3% White alone, not Hispanic / Latino162 5.7% Hispanic or LatinoMoved from different state 10 0.2% White / Caucasian27 1.2% Black or African American12 0.2% White alone, not Hispanic / Latino44 1.5% Hispanic or LatinoMoved from abroad 16 0.3% White19 0.4% White alone, not Hispanic / Latino
Children Nativity (place of birth) in Orange Lake
Children under 6 years - Living with two parents Both parents native 283 100.0% NativeChildren under 6 years - Living with one parent Native parent 94 100.0% NativeForeign-born parent 40 100.0% Native
Children 6 to 17 years - Living with two parents Both parents native 557 100.0% NativeBoth parents foreign-born 37 100.0% NativeOne native, one foreign-born parent 95 100.0% NativeChildren 6 to 17 years - Living with one parent Native parent 180 100.0% Native
Grandparents responsible for own grandchildren in Orange Lake
Grandparents (30 to 59 years) White / Caucasian 21 100.0% Not responsible for grandchildrenOther race 98 100.0% Not responsible for grandchildrenHispanic or Latino 105 100.0% Not responsible for grandchildrenGrandparents (60 years and over) White / Caucasian 31 39.4% Responsible for grandchildren47 60.6% Not responsible for grandchildrenOther race 31 100.0% Not responsible for grandchildrenHispanic or Latino 45 100.0% Not responsible for grandchildren