Races in Orem, Utah (UT) Detailed Stats
Data:
Races - White alone (%)
Races - White alone (% change since 2000)
Races - Black alone (%)
Races - Black alone (% change since 2000)
Races - American Indian alone (%)
Races - American Indian alone (% change since 2000)
Races - Asian alone (%)
Races - Asian alone (% change since 2000)
Races - Hispanic (%)
Races - Hispanic (% change since 2000)
Races - Native Hawaiian and Other Pacific Islander alone (%)
Races - Native Hawaiian and Other Pacific Islander alone (% change since 2000)
Races - Two or more races(%)
Races - Two or more races(% change since 2000)
Races - Other race alone (%)
Races - Other race alone (% change since 2000)
Racial diversity
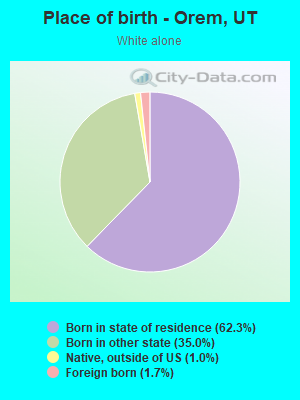
Place of birth - Born in state of residence (%)
Place of birth - Born in state of residence (%) - White
Place of birth - Born in state of residence (%) - Black or African American
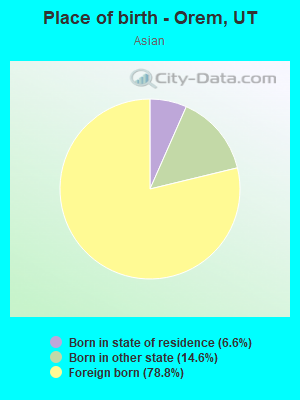
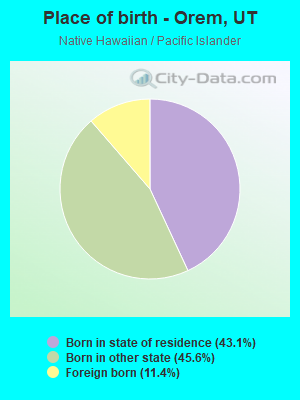
Place of birth - Born in state of residence (%) - Asian
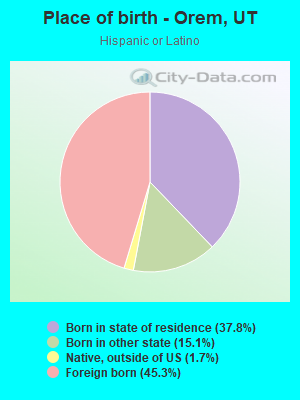
Place of birth - Born in state of residence (%) - Hispanic or Latino
Place of birth - Born in state of residence (%) - American Indian and Alaska Native
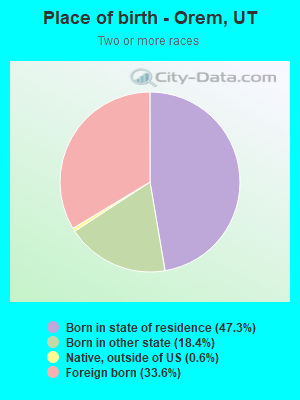
Place of birth - Born in state of residence (%) - Multirace
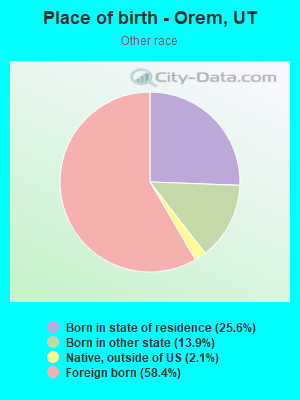
Place of birth - Born in state of residence (%) - Other Race
Place of birth - Born in other state (%)
Place of birth - Born in other state (%) - White
Place of birth - Born in other state (%) - Black or African American
Place of birth - Born in other state (%) - Asian
Place of birth - Born in other state (%) - Hispanic or Latino
Place of birth - Born in other state (%) - American Indian and Alaska Native
Place of birth - Born in other state (%) - Multirace
Place of birth - Born in other state (%) - Other Race
Place of birth - Native, outside of US (%)
Place of birth - Native, outside of US (%) - White
Place of birth - Native, outside of US (%) - Black or African American
Place of birth - Native, outside of US (%) - Asian
Place of birth - Native, outside of US (%) - Hispanic or Latino
Place of birth - Native, outside of US (%) - American Indian and Alaska Native
Place of birth - Native, outside of US (%) - Multirace
Place of birth - Native, outside of US (%) - Other Race
Place of birth - Foreign born (%)
Place of birth - Foreign born (%) - White
Place of birth - Foreign born (%) - Black or African American
Place of birth - Foreign born (%) - Asian
Place of birth - Foreign born (%) - Hispanic or Latino
Place of birth - Foreign born (%) - American Indian and Alaska Native
Place of birth - Foreign born (%) - Multirace
Place of birth - Foreign born (%) - Other Race
Residents speaking English at home (%)
Residents speaking English at home - Born in the United States (%)
Residents speaking English at home - Native, born elsewhere (%)
Residents speaking English at home - Foreign born (%)
Residents speaking Spanish at home (%)
Residents speaking Spanish at home - Born in the United States (%)
Residents speaking Spanish at home - Native, born elsewhere (%)
Residents speaking Spanish at home - Foreign born (%)
Residents speaking other language at home (%)
Residents speaking other language at home - Born in the United States (%)
Residents speaking other language at home - Native, born elsewhere (%)
Residents speaking other language at home - Foreign born (%)
Marital status - Never married (%)
Marital status - Now married (%)
Marital status - Separated (%)
Marital status - Widowed (%)
Marital status - Divorced (%)
Ancestries Reported - Arab (%)
Ancestries Reported - Czech (%)
Ancestries Reported - Danish (%)
Ancestries Reported - Dutch (%)
Ancestries Reported - English (%)
Ancestries Reported - French (%)
Ancestries Reported - French Canadian (%)
Ancestries Reported - German (%)
Ancestries Reported - Greek (%)
Ancestries Reported - Hungarian (%)
Ancestries Reported - Irish (%)
Ancestries Reported - Italian (%)
Ancestries Reported - Lithuanian (%)
Ancestries Reported - Norwegian (%)
Ancestries Reported - Polish (%)
Ancestries Reported - Portuguese (%)
Ancestries Reported - Russian (%)
Ancestries Reported - Scotch-Irish (%)
Ancestries Reported - Scottish (%)
Ancestries Reported - Slovak (%)
Ancestries Reported - Subsaharan African (%)
Ancestries Reported - Swedish (%)
Ancestries Reported - Swiss (%)
Ancestries Reported - Ukrainian (%)
Ancestries Reported - United States (%)
Ancestries Reported - Welsh (%)
Ancestries Reported - West Indian (%)
Ancestries Reported - Other (%)
Geographical mobility - Same house 1 year ago (%)
Geographical mobility - Same house 1 year ago (%) - White
Geographical mobility - Same house 1 year ago (%) - Black or African American
Geographical mobility - Same house 1 year ago (%) - Asian
Geographical mobility - Same house 1 year ago (%) - Hispanic or Latino
Geographical mobility - Same house 1 year ago (%) - American Indian and Alaska Native
Geographical mobility - Same house 1 year ago (%) - Multirace
Geographical mobility - Same house 1 year ago (%) - Other Race
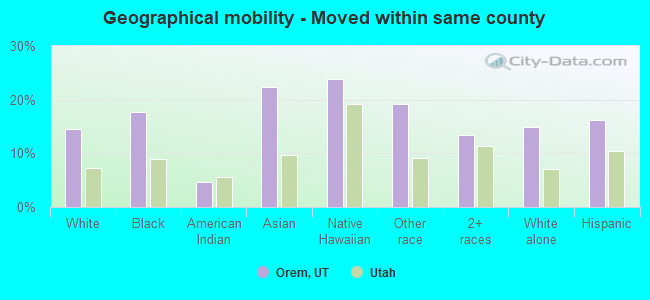
Geographical mobility - Moved within same county (%)
Geographical mobility - Moved within same county (%) - White
Geographical mobility - Moved within same county (%) - Black or African American
Geographical mobility - Moved within same county (%) - Asian
Geographical mobility - Moved within same county (%) - Hispanic or Latino
Geographical mobility - Moved within same county (%) - American Indian and Alaska Native
Geographical mobility - Moved within same county (%) - Multirace
Geographical mobility - Moved within same county (%) - Other Race
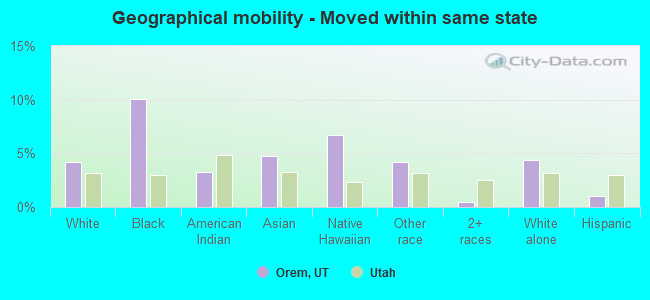
Geographical mobility - Moved from different county within same state (%)
Geographical mobility - Moved from different county within same state (%) - White
Geographical mobility - Moved from different county within same state (%) - Black or African American
Geographical mobility - Moved from different county within same state (%) - Asian
Geographical mobility - Moved from different county within same state (%) - Hispanic or Latino
Geographical mobility - Moved from different county within same state (%) - American Indian and Alaska Native
Geographical mobility - Moved from different county within same state (%) - Multirace
Geographical mobility - Moved from different county within same state (%) - Other Race
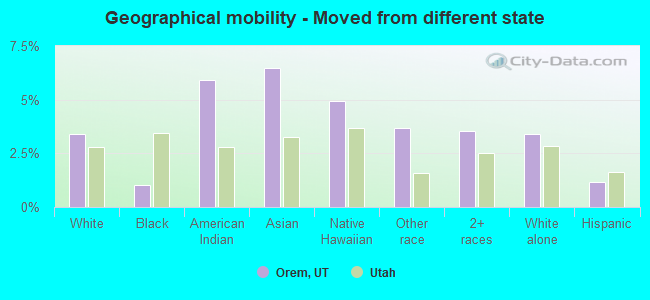
Geographical mobility - Moved from different state (%)
Geographical mobility - Moved from different state (%) - White
Geographical mobility - Moved from different state (%) - Black or African American
Geographical mobility - Moved from different state (%) - Asian
Geographical mobility - Moved from different state (%) - Hispanic or Latino
Geographical mobility - Moved from different state (%) - American Indian and Alaska Native
Geographical mobility - Moved from different state (%) - Multirace
Geographical mobility - Moved from different state (%) - Other Race
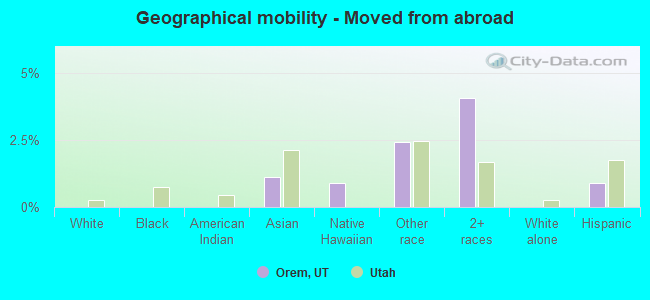
Geographical mobility - Moved from abroad (%)
Geographical mobility - Moved from abroad (%) - White
Geographical mobility - Moved from abroad (%) - Black or African American
Geographical mobility - Moved from abroad (%) - Asian
Geographical mobility - Moved from abroad (%) - Hispanic or Latino
Geographical mobility - Moved from abroad (%) - American Indian and Alaska Native
Geographical mobility - Moved from abroad (%) - Multirace
Geographical mobility - Moved from abroad (%) - Other Race
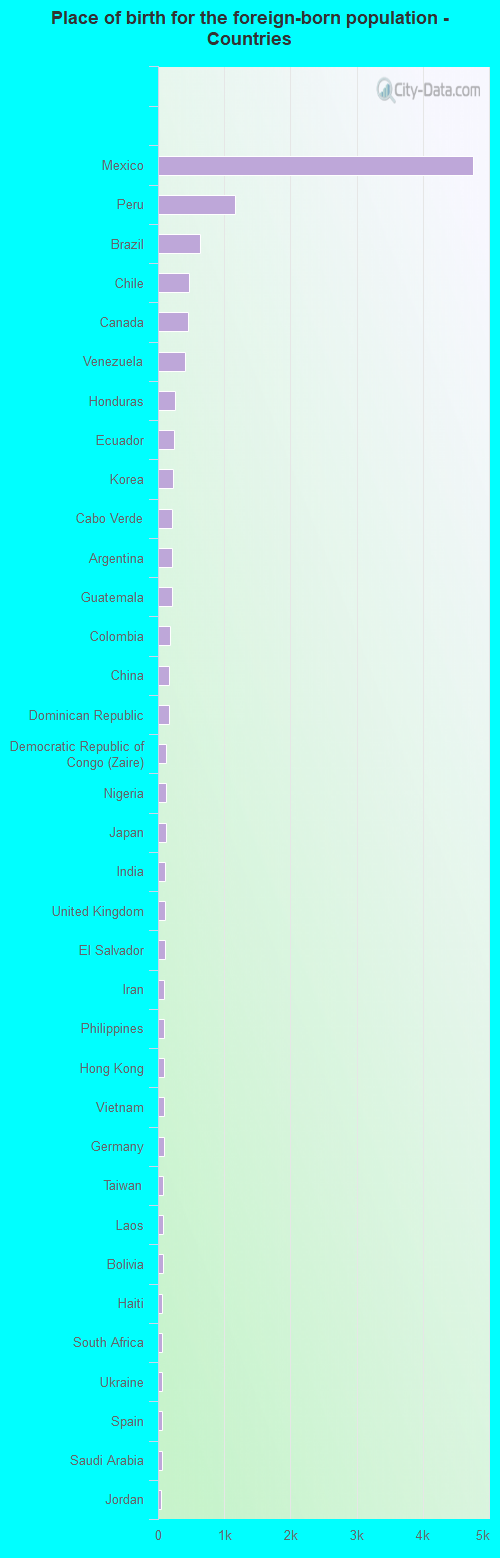
Place of birth for the foreign-born population - Ireland (%)
Place of birth for the foreign-born population - Denmark (%)
Place of birth for the foreign-born population - Norway (%)
Place of birth for the foreign-born population - Sweden (%)
Place of birth for the foreign-born population - United Kingdom (%)
Place of birth for the foreign-born population - England (%)
Place of birth for the foreign-born population - Scotland (%)
Place of birth for the foreign-born population - Other Northern Europe (%)
Place of birth for the foreign-born population - Austria (%)
Place of birth for the foreign-born population - Belgium (%)
Place of birth for the foreign-born population - France (%)
Place of birth for the foreign-born population - Germany (%)
Place of birth for the foreign-born population - Netherlands (%)
Place of birth for the foreign-born population - Switzerland (%)
Place of birth for the foreign-born population - Other Western Europe (%)
Place of birth for the foreign-born population - Greece (%)
Place of birth for the foreign-born population - Italy (%)
Place of birth for the foreign-born population - Portugal (%)
Place of birth for the foreign-born population - Spain (%)
Place of birth for the foreign-born population - Other Southern Europe (%)
Place of birth for the foreign-born population - Albania (%)
Place of birth for the foreign-born population - Belarus (%)
Place of birth for the foreign-born population - Bosnia and Herzegovina (%)
Place of birth for the foreign-born population - Bulgaria (%)
Place of birth for the foreign-born population - Croatia (%)
Place of birth for the foreign-born population - Czechoslovakia (%)
Place of birth for the foreign-born population - Hungary (%)
Place of birth for the foreign-born population - Latvia (%)
Place of birth for the foreign-born population - Lithuania (%)
Place of birth for the foreign-born population - North Macedonia (Macedonia) (%)
Place of birth for the foreign-born population - Moldova (%)
Place of birth for the foreign-born population - Poland (%)
Place of birth for the foreign-born population - Romania (%)
Place of birth for the foreign-born population - Russia (%)
Place of birth for the foreign-born population - Serbia (%)
Place of birth for the foreign-born population - Ukraine (%)
Place of birth for the foreign-born population - Other Eastern Europe (%)
Place of birth for the foreign-born population - China (%)
Place of birth for the foreign-born population - Hong Kong (%)
Place of birth for the foreign-born population - Taiwan (%)
Place of birth for the foreign-born population - Japan (%)
Place of birth for the foreign-born population - Korea (%)
Place of birth for the foreign-born population - Other Eastern Asia (%)
Place of birth for the foreign-born population - Afghanistan (%)
Place of birth for the foreign-born population - Bangladesh (%)
Place of birth for the foreign-born population - India (%)
Place of birth for the foreign-born population - Iran (%)
Place of birth for the foreign-born population - Kazakhstan (%)
Place of birth for the foreign-born population - Nepal (%)
Place of birth for the foreign-born population - Pakistan (%)
Place of birth for the foreign-born population - Sri Lanka (%)
Place of birth for the foreign-born population - Uzbekistan (%)
Place of birth for the foreign-born population - Other South Central Asia (%)
Place of birth for the foreign-born population - Burma (%)
Place of birth for the foreign-born population - Cambodia (%)
Place of birth for the foreign-born population - Indonesia (%)
Place of birth for the foreign-born population - Laos (%)
Place of birth for the foreign-born population - Malaysia (%)
Place of birth for the foreign-born population - Philippines (%)
Place of birth for the foreign-born population - Singapore (%)
Place of birth for the foreign-born population - Thailand (%)
Place of birth for the foreign-born population - Vietnam (%)
Place of birth for the foreign-born population - Other South Eastern Asia (%)
Place of birth for the foreign-born population - Armenia (%)
Place of birth for the foreign-born population - Iraq (%)
Place of birth for the foreign-born population - Israel (%)
Place of birth for the foreign-born population - Jordan (%)
Place of birth for the foreign-born population - Kuwait (%)
Place of birth for the foreign-born population - Lebanon (%)
Place of birth for the foreign-born population - Saudi Arabia (%)
Place of birth for the foreign-born population - Syria (%)
Place of birth for the foreign-born population - Turkey (%)
Place of birth for the foreign-born population - Yemen (%)
Place of birth for the foreign-born population - Other Western Asia (%)
Place of birth for the foreign-born population - Eritrea (%)
Place of birth for the foreign-born population - Ethiopia (%)
Place of birth for the foreign-born population - Kenya (%)
Place of birth for the foreign-born population - Somalia (%)
Place of birth for the foreign-born population - Uganda (%)
Place of birth for the foreign-born population - Zimbabwe (%)
Place of birth for the foreign-born population - Other Eastern Africa (%)
Place of birth for the foreign-born population - Cameroon (%)
Place of birth for the foreign-born population - Congo (%)
Place of birth for the foreign-born population - Democratic Republic of Congo (Zaire) (%)
Place of birth for the foreign-born population - Other Middle Africa (%)
Place of birth for the foreign-born population - Egypt (%)
Place of birth for the foreign-born population - Morocco (%)
Place of birth for the foreign-born population - Sudan (%)
Place of birth for the foreign-born population - Other Northern Africa (%)
Place of birth for the foreign-born population - South Africa (%)
Place of birth for the foreign-born population - Other Southern Africa (%)
Place of birth for the foreign-born population - Cabo Verde (%)
Place of birth for the foreign-born population - Ghana (%)
Place of birth for the foreign-born population - Liberia (%)
Place of birth for the foreign-born population - Nigeria (%)
Place of birth for the foreign-born population - Senegal (%)
Place of birth for the foreign-born population - Sierra Leone (%)
Place of birth for the foreign-born population - Other Western Africa (%)
Place of birth for the foreign-born population - Australia (%)
Place of birth for the foreign-born population - New Zealand (%)
Place of birth for the foreign-born population - Fiji (%)
Place of birth for the foreign-born population - Micronesia (%)
Place of birth for the foreign-born population - Bahamas (%)
Place of birth for the foreign-born population - Barbados (%)
Place of birth for the foreign-born population - Cuba (%)
Place of birth for the foreign-born population - Dominica (%)
Place of birth for the foreign-born population - Dominican Republic (%)
Place of birth for the foreign-born population - Grenada (%)
Place of birth for the foreign-born population - Haiti (%)
Place of birth for the foreign-born population - Jamaica (%)
Place of birth for the foreign-born population - St. Vincent and the Grenadines (%)
Place of birth for the foreign-born population - Trinidad and Tobago (%)
Place of birth for the foreign-born population - West Indies (%)
Place of birth for the foreign-born population - Other Caribbean (%)
Place of birth for the foreign-born population - Belize (%)
Place of birth for the foreign-born population - Costa Rica (%)
Place of birth for the foreign-born population - El Salvador (%)
Place of birth for the foreign-born population - Guatemala (%)
Place of birth for the foreign-born population - Honduras (%)
Place of birth for the foreign-born population - Mexico (%)
Place of birth for the foreign-born population - Nicaragua (%)
Place of birth for the foreign-born population - Panama (%)
Place of birth for the foreign-born population - Other Central America (%)
Place of birth for the foreign-born population - Argentina (%)
Place of birth for the foreign-born population - Bolivia (%)
Place of birth for the foreign-born population - Brazil (%)
Place of birth for the foreign-born population - Chile (%)
Place of birth for the foreign-born population - Colombia (%)
Place of birth for the foreign-born population - Ecuador (%)
Place of birth for the foreign-born population - Guyana (%)
Place of birth for the foreign-born population - Peru (%)
Place of birth for the foreign-born population - Uruguay (%)
Place of birth for the foreign-born population - Venezuela (%)
Place of birth for the foreign-born population - Other South America (%)
Place of birth for the foreign-born population - Canada (%)
Place of birth for the foreign-born population - Other Northern America (%)
Place of birth for the foreign-born population - Other (%)
Latest news about races in Orem, UT collected exclusively by city-data.com from local newspapers, TV, and radio stations
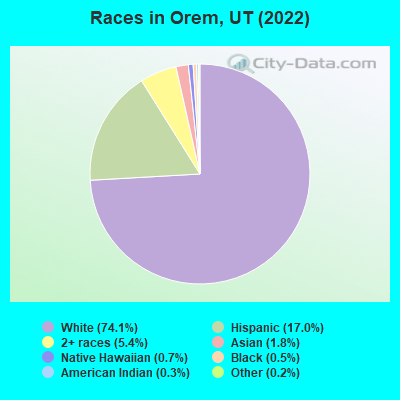
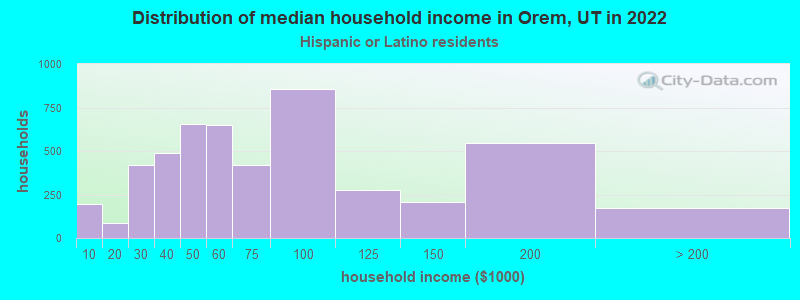
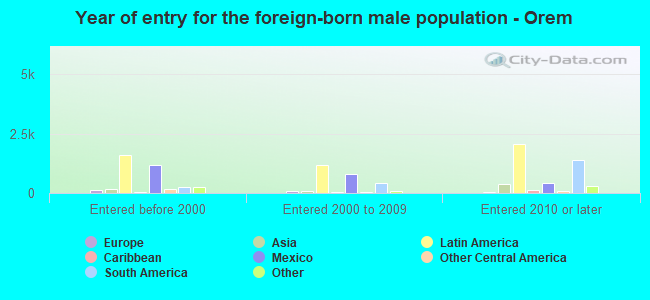
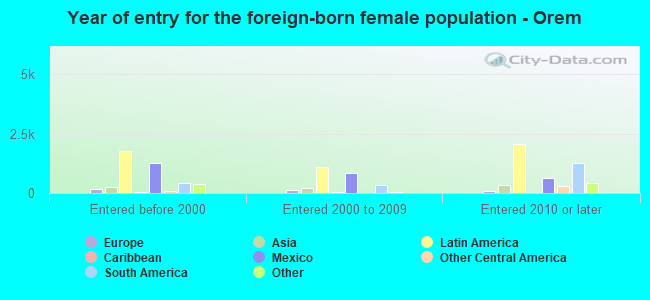
According to 2022 data, the most numerous races in Orem, UT are White alone (71,072 residents), Hispanic (16,269 residents), and Two or more races (5,187 residents). 79.4% of Orem residents speak English at home. 12.1% of Orem, UT residents are foreign-born (8.8% born in Latin America, 1.4% born in Asia), which is 33.8% greater than the foreign-born rate of 8.0% across the entire state of Utah.
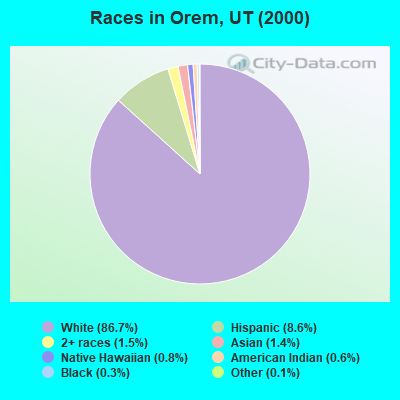
Race distribution in Orem
2000 2022
1,904,265 85.3% White alone 201,559 9.0% Hispanic 36,483 1.6% Asian alone 31,308 1.4% Two or more races 26,663 1.2% American Indian alone 14,806 0.7% Native Hawaiian and Other 16,137 0.7% Black alone 1,948 0.09% Other race alone
2,557,466 75.6% White alone 512,086 15.1% Hispanic 119,308 3.5% Two or more races 82,388 2.4% Asian alone 36,978 1.1% Native Hawaiian and Other 34,873 1.0% Black alone 22,803 0.7% American Indian alone 14,898 0.4% Other race alone
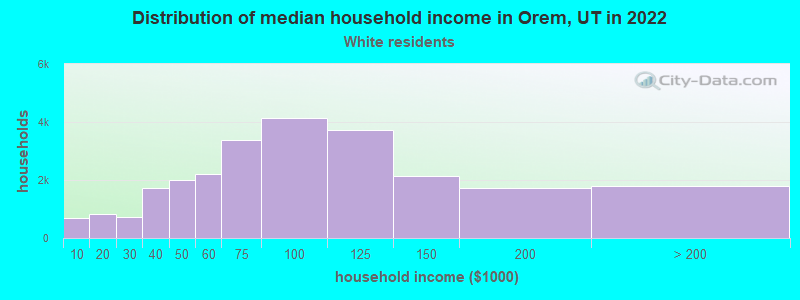
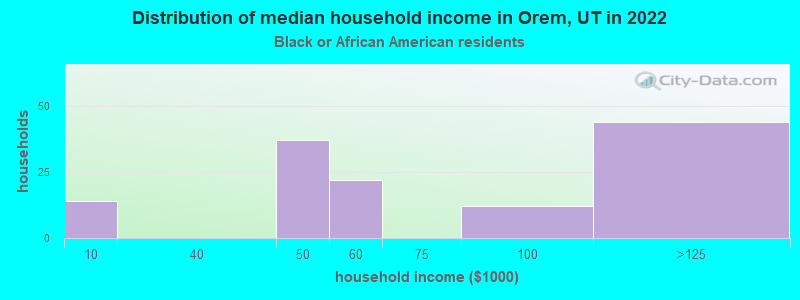
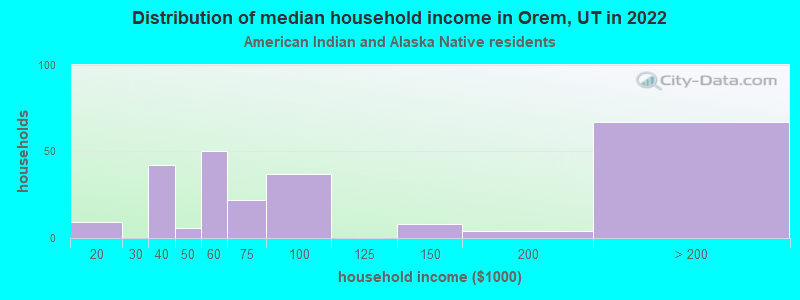
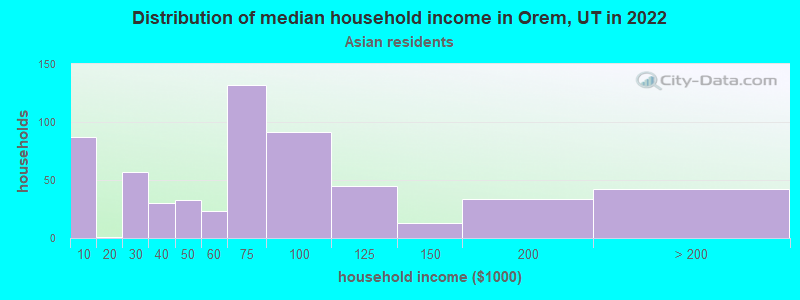
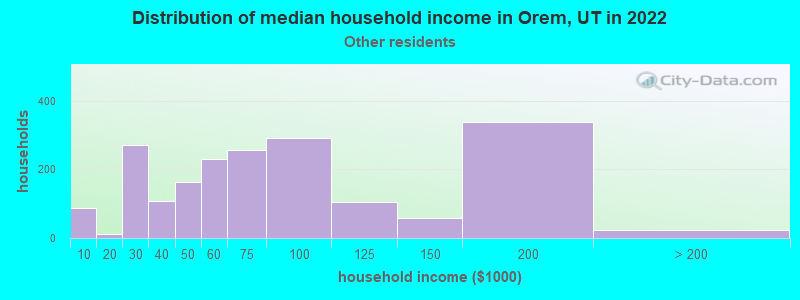
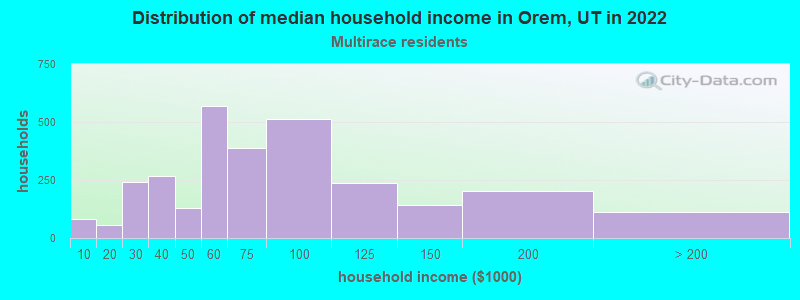
Income and house value in Orem Median household income in 2022 $80,702 White non-Hispanic householders$159,565 American Indian and Alaska Native householders$91,062 Asian householders$68,465 Some other race householders$57,335 Two or more races householders$56,502 Hispanic or Latino race householdersMedian 2022 house value $503,114 White Non-Hispanic householders$469,015 Black or African American householders$436,525 American Indian or Alaska Native householders $497,002 Asian householders$476,736 Native Hawaiian and other Pacific Islander householders$432,022 Some other race householders$506,974 Two or more races householders$442,315 Hispanic or Latino householders
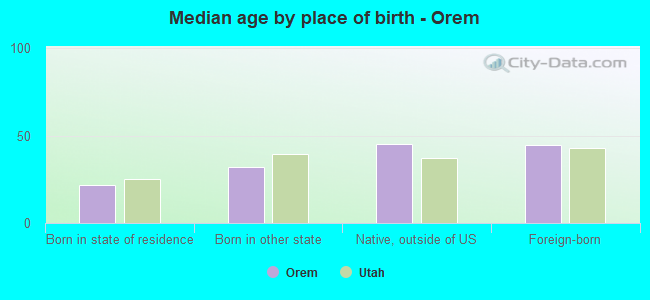
Median age by race in Orem
28.0 Median age for White residents27.0 28.3 21.5 Median age for Black or African American residents-666,666,666.0 21.7 33.5 Median age for American Indian / Alaska Native residents29.6 37.2 34.5 Median age for Asian residents27.8 34.7 50.9 Median age for Native Hawaiian / Pacific Islander residents74.2 46.1 30.5 Median age for Other race residents24.2 35.4 22.4 Median age for Two or more races residents22.0 23.3 28.4 Median age for White alone residents27.6 28.7 25.3 Median age for Hispanic or Latino residents22.7 29.8
Owner/renter occupied households by race in Orem
House owners and renters - White residents 15,368 61.3% Owner occupied9,721 38.7% Renter occupiedHouse owners and renters - Black or African American residents 40 29.2% Owner occupied97 70.8% Renter occupiedHouse owners and renters - American Indian / Alaska Native residents 59 38.3% Owner occupied95 61.7% Renter occupiedHouse owners and renters - Asian residents 305 50.1% Owner occupied304 49.9% Renter occupiedHouse owners and renters - Native Hawaiian / Pacific Islander residents 77 43.0% Owner occupied102 57.0% Renter occupiedHouse owners and renters - Other race residents 693 36.6% Owner occupied1,202 63.4% Renter occupiedHouse owners and renters - Two or more races residents 875 29.1% Owner occupied2,127 70.9% Renter occupiedHouse owners and renters - White alone residents 15,290 62.0% Owner occupied9,366 38.0% Renter occupiedHouse owners and renters - Hispanic or Latino residents 1,238 28.4% Owner occupied3,116 71.6% Renter occupied
Language usage in Orem
English speakers - Total 79.4% of residents of Orem speak English at home.
15.2% of residents speak Spanish at home 7,577 55.7% Speak English very well6,034 44.3% Speak English less than very well5.4% of residents speak other language at home 4,055 83.9% Speak English very well776 16.1% Speak English less than very well
English speakers - Born in the United States 89.7% of residents of Orem speak English at home.
6.5% of residents speak Spanish at home 1,698 89.9% Speak English very well191 10.1% Speak English less than very well3.8% of residents speak other language at home 1,089 100.0% Speak English very well
English speakers - Native, born elsewhere 83.6% of residents of Orem speak English at home.
13.5% of residents speak Spanish at home 76 58.9% Speak English very well53 41.1% Speak English less than very well2.9% of residents speak other language at home 28 100.0% Speak English very well
English speakers - Foreign-born 13.0% of residents of Orem speak English at home.
63.6% of residents speak Spanish at home 1,962 26.5% Speak English very well5,448 73.5% Speak English less than very well23.4% of residents speak other language at home 1,973 72.4% Speak English very well752 27.6% Speak English less than very well
White (Caucasian) - Speak only English Native:
95.2% (64,053)Foreign-born:
59.1% (779)
White (Caucasian) - Speak another language Native:
4.8% (3,213)Foreign-born:
40.9% (539)
Black or African American - Speak only English Native:
58.5% (147)Foreign-born:
15.9% (100)
Black or African American - Speak another language Native:
41.0% (103)Foreign-born:
52.9% (333)
American Indian / Alaska Native - Speak only English Native:
81.6% (390)Foreign-born:
26.3% (25)
American Indian / Alaska Native - Speak another language Native:
12.0% (57)Foreign-born:
81.0% (77)
Asian - Speak only English Native:
93.5% (348)Foreign-born:
28.9% (399)
Asian - Speak another language Native:
6.5% (24)Foreign-born:
71.1% (982)
Native Hawaiian / Pacific Islander - Speak only English Native:
77.9% (592)Foreign-born:
26.3% (23)
Native Hawaiian / Pacific Islander - Speak another language Native:
20.5% (156)Foreign-born:
71.5% (62)
Other race - Speak only English Native:
28.2% (725)Foreign-born:
4.7% (188)
Other race - Speak another language Native:
71.8% (1,849)Foreign-born:
95.3% (3,840)
Two or more races - Speak only English Native:
54.4% (3,697)Foreign-born:
2.7% (110)
Two or more races - Speak another language Native:
45.6% (3,099)Foreign-born:
97.3% (3,979)
White alone - Speak only English Native:
95.7% (62,562)Foreign-born:
65.1% (779)
White alone - Speak another language Native:
4.3% (2,796)Foreign-born:
34.9% (418)
Hispanic or Latino - Speak only English Native:
39.7% (2,986)Foreign-born:
2.4% (180)
Hispanic or Latino - Speak another language Native:
60.3% (4,526)Foreign-born:
97.6% (7,195)
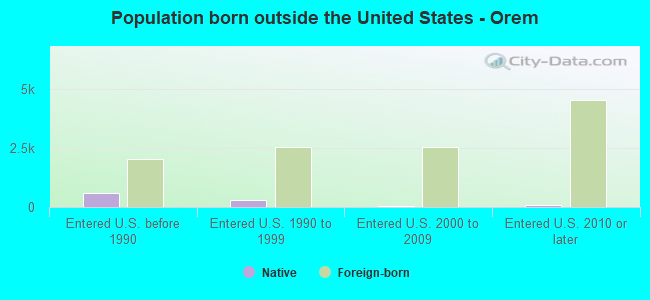
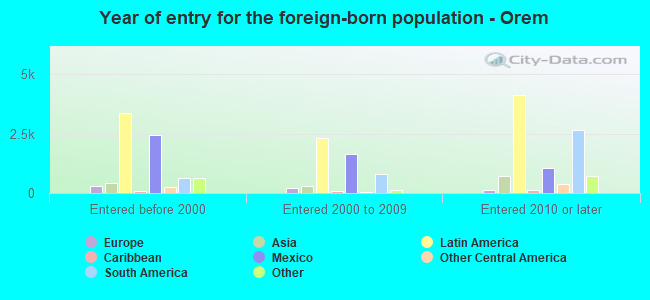
Foreign-born residents in Orem 12,385 residents are foreign born (8.8% Latin America , 1.4% Asia ).
Marital status for residents in Orem Marital status - White (Caucasian) population 15 years and over
Males 34.0% Never married56.0% Now married1.0% Separated2.0% Widowed6.9% DivorcedFemales 31.8% Never married55.4% Now married0.3% Separated5.1% Widowed7.3% DivorcedWomen who gave birth in the past 12 months Now married:
95.5% (1,425)Unmarried:
4.5% (67)
Women who did not give birth in the past 12 months Now married:
47.1% (9,167)Unmarried:
52.9% (10,302)
Marital status - Black or African American population 15 years and over
Males 27.0% Never married68.2% Now married4.7% Separated0.0% Widowed0.0% DivorcedFemales 75.5% Never married24.5% Now married0.0% Separated0.0% Widowed0.0% DivorcedWomen who did not give birth in the past 12 months Now married:
18.6% (46)Unmarried:
81.4% (204)
Marital status - American Indian / Alaska Native population 15 years and over
Males 44.2% Never married43.6% Now married2.5% Separated0.0% Widowed9.8% DivorcedFemales 24.4% Never married51.3% Now married0.0% Separated0.0% Widowed24.4% DivorcedWomen who did not give birth in the past 12 months Now married:
43.0% (122)Unmarried:
57.0% (162)
Marital status - Asian population 15 years and over
Males 25.6% Never married67.9% Now married0.0% Separated0.0% Widowed6.6% DivorcedFemales 21.4% Never married68.9% Now married4.5% Separated1.3% Widowed3.8% DivorcedWomen who gave birth in the past 12 months Now married:
100.0% (55)Unmarried:
0.0% (0)
Women who did not give birth in the past 12 months Now married:
69.9% (448)Unmarried:
30.1% (193)
Marital status - Native Hawaiian / Pacific Islander population 15 years and over
Males 9.2% Never married77.7% Now married4.9% Separated0.0% Widowed8.3% DivorcedFemales 29.5% Never married55.6% Now married0.0% Separated3.4% Widowed11.5% DivorcedWomen who gave birth in the past 12 months Now married:
100.0% (44)Unmarried:
0.0% (0)
Women who did not give birth in the past 12 months Now married:
54.6% (226)Unmarried:
45.4% (188)
Marital status - Other race population 15 years and over
Males 40.8% Never married53.5% Now married0.0% Separated0.0% Widowed5.7% DivorcedFemales 25.8% Never married54.8% Now married8.0% Separated2.4% Widowed9.0% DivorcedWomen who gave birth in the past 12 months Now married:
100.0% (236)Unmarried:
0.0% (0)
Women who did not give birth in the past 12 months Now married:
64.3% (1,081)Unmarried:
35.7% (599)
Marital status - Two or more races population 15 years and over
Males 41.1% Never married51.9% Now married2.3% Separated0.0% Widowed4.8% DivorcedFemales 41.1% Never married44.2% Now married5.4% Separated0.6% Widowed8.6% DivorcedWomen who gave birth in the past 12 months Now married:
71.9% (235)Unmarried:
28.1% (92)
Women who did not give birth in the past 12 months Now married:
42.0% (1,168)Unmarried:
58.0% (1,612)
Marital status - White alone, not Hispanic / Latino population 15 years and over
Males 33.7% Never married56.1% Now married1.0% Separated2.1% Widowed7.0% DivorcedFemales 31.2% Never married56.1% Now married0.4% Separated5.3% Widowed7.0% DivorcedWomen who gave birth in the past 12 months Now married:
95.2% (1,327)Unmarried:
4.8% (67)
Women who did not give birth in the past 12 months Now married:
47.9% (8,906)Unmarried:
52.1% (9,676)
Marital status - Hispanic or Latino population 15 years and over
Males 45.5% Never married49.4% Now married1.5% Separated0.0% Widowed3.7% DivorcedFemales 30.2% Never married52.3% Now married7.7% Separated1.4% Widowed8.3% DivorcedWomen who gave birth in the past 12 months Now married:
100.0% (194)Unmarried:
0.0% (0)
Women who did not give birth in the past 12 months Now married:
54.2% (2,335)Unmarried:
45.8% (1,977)
Ancestries in Orem
13,043 27.3% English3,404 7.1% European2,847 6.0% American2,074 4.3% German1,024 2.1% Italian796 1.7% Scottish698 1.5% Danish625 1.3% Irish604 1.3% Welsh591 1.2% Norwegian497 1.0% Scandinavian457 1.0% Swedish438 0.9% British357 0.7% Dutch308 0.6% Swiss268 0.6% Polish252 0.5% Brazilian214 0.4% Northern European171 0.4% French165 0.3% Nigerian150 0.3% Canadian146 0.3% Scotch-Irish130 0.3% Haitian129 0.3% African124 0.3% Arab108 0.2% Cape Verdean92 0.2% Ukrainian80 0.2% Finnish78 0.2% Russian72 0.2% Greek61 0.1% French Canadian59 0.1% Austrian59 0.1% Armenian51 0.1% Portuguese49 0.1% Iranian26 0.05% Slovak22 0.05% Czech17 0.04% Lithuanian17 0.04% Ethiopian17 0.04% Ghanaian17 0.04% South African11 0.02% Belizean10 0.02% Celtic9 0.02% Latvian8 0.02% Hungarian6 0.01% Croatian5 0.01% Palestinian
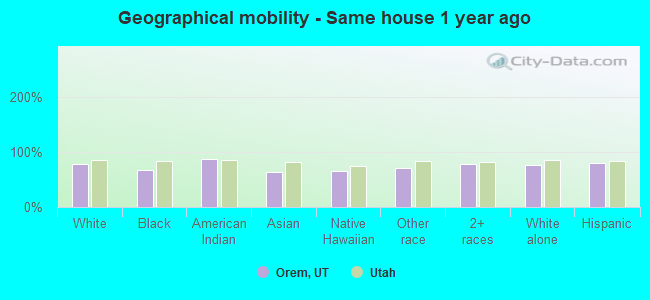
Geographical mobility in Orem Same house 1 year ago 56,116 77.8% White (Caucasian)462 67.3% Black or African American506 87.0% American Indian / Alaska Native1,089 64.0% Asian523 66.0% Native Hawaiian / Pacific Islander5,170 70.9% Other race9,390 78.5% Two or more races54,122 77.5% White alone, not Hispanic / Latino12,933 80.8% Hispanic or LatinoMoved within same county 10,549 14.6% White / Caucasian121 17.6% Black or African American27 4.6% American Indian / Alaska Native382 22.4% Asian189 23.8% Native Hawaiian / Pacific Islander1,399 19.2% Other race1,604 13.4% Two or more races10,353 14.8% White alone, not Hispanic / Latino2,590 16.2% Hispanic or LatinoMoved within same state 3,029 4.2% White / Caucasian69 10.1% Black or African American19 3.2% American Indian / Alaska Native82 4.8% Asian53 6.7% Native Hawaiian / Pacific Islander309 4.2% Other race56 0.5% Two or more races3,029 4.3% White alone, not Hispanic / Latino159 1.0% Hispanic or LatinoMoved from different state 2,470 3.4% White / Caucasian7 1.0% Black or African American34 5.9% American Indian / Alaska Native110 6.5% Asian39 4.9% Native Hawaiian / Pacific Islander269 3.7% Other race425 3.6% Two or more races2,371 3.4% White alone, not Hispanic / Latino186 1.2% Hispanic or LatinoMoved from abroad 19 1.1% Asian7 0.9% Native Hawaiian / Pacific Islander177 2.4% Other race488 4.1% Two or more races143 0.9% Hispanic or Latino
Children Nativity (place of birth) in Orem
Children under 6 years - Living with two parents Both parents native 5,001 100.0% NativeOne native, one foreign-born parent 1,116 100.0% NativeChildren under 6 years - Living with one parent Native parent 1,015 100.0% NativeForeign-born parent 351 100.0% NativeChildren 6 to 17 years - Living with two parents Both parents native 11,160 100.0% NativeBoth parents foreign-born 1,270 79.1% Native336 20.9% Foreign-bornOne native, one foreign-born parent 1,172 100.0% NativeChildren 6 to 17 years - Living with one parent Native parent 1,786 100.0% NativeForeign-born parent 1,062 53.4% Native927 46.6% Foreign-born
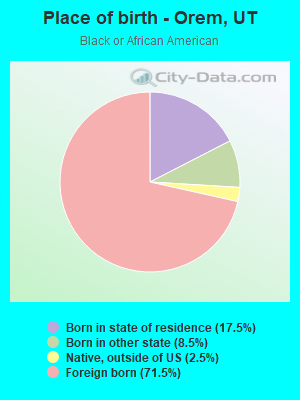
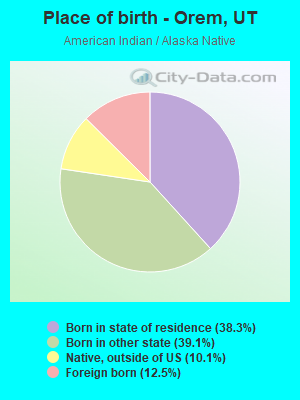
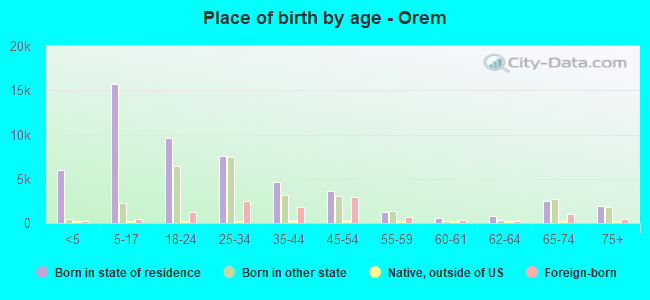
Place of birth for residents in Orem
Grandparents responsible for own grandchildren in Orem
Grandparents (30 to 59 years) White / Caucasian 79 13.3% Responsible for grandchildren512 86.7% Not responsible for grandchildrenOther race 44 100.0% Not responsible for grandchildrenTwo or more races 122 100.0% Not responsible for grandchildrenWhite alone, not Hispanic / Latino 85 16.9% Responsible for grandchildren418 83.1% Not responsible for grandchildrenHispanic or Latino 221 100.0% Not responsible for grandchildrenGrandparents (60 years and over) White / Caucasian 329 29.8% Responsible for grandchildren775 70.2% Not responsible for grandchildrenOther race 4 11.0% Responsible for grandchildren36 89.0% Not responsible for grandchildrenTwo or more races 295 100.0% Not responsible for grandchildrenWhite alone, not Hispanic / Latino 338 32.8% Responsible for grandchildren692 67.2% Not responsible for grandchildrenHispanic or Latino 5 1.7% Responsible for grandchildren265 98.3% Not responsible for grandchildren