Races in Orland Hills, Illinois (IL) Detailed Stats
Data:
Races - White alone (%)
Races - White alone (% change since 2000)
Races - Black alone (%)
Races - Black alone (% change since 2000)
Races - American Indian alone (%)
Races - American Indian alone (% change since 2000)
Races - Asian alone (%)
Races - Asian alone (% change since 2000)
Races - Hispanic (%)
Races - Hispanic (% change since 2000)
Races - Native Hawaiian and Other Pacific Islander alone (%)
Races - Native Hawaiian and Other Pacific Islander alone (% change since 2000)
Races - Two or more races(%)
Races - Two or more races(% change since 2000)
Races - Other race alone (%)
Races - Other race alone (% change since 2000)
Racial diversity
Place of birth - Born in state of residence (%)
Place of birth - Born in state of residence (%) - White
Place of birth - Born in state of residence (%) - Black or African American
Place of birth - Born in state of residence (%) - Asian
Place of birth - Born in state of residence (%) - Hispanic or Latino
Place of birth - Born in state of residence (%) - American Indian and Alaska Native
Place of birth - Born in state of residence (%) - Multirace
Place of birth - Born in state of residence (%) - Other Race
Place of birth - Born in other state (%)
Place of birth - Born in other state (%) - White
Place of birth - Born in other state (%) - Black or African American
Place of birth - Born in other state (%) - Asian
Place of birth - Born in other state (%) - Hispanic or Latino
Place of birth - Born in other state (%) - American Indian and Alaska Native
Place of birth - Born in other state (%) - Multirace
Place of birth - Born in other state (%) - Other Race
Place of birth - Native, outside of US (%)
Place of birth - Native, outside of US (%) - White
Place of birth - Native, outside of US (%) - Black or African American
Place of birth - Native, outside of US (%) - Asian
Place of birth - Native, outside of US (%) - Hispanic or Latino
Place of birth - Native, outside of US (%) - American Indian and Alaska Native
Place of birth - Native, outside of US (%) - Multirace
Place of birth - Native, outside of US (%) - Other Race
Place of birth - Foreign born (%)
Place of birth - Foreign born (%) - White
Place of birth - Foreign born (%) - Black or African American
Place of birth - Foreign born (%) - Asian
Place of birth - Foreign born (%) - Hispanic or Latino
Place of birth - Foreign born (%) - American Indian and Alaska Native
Place of birth - Foreign born (%) - Multirace
Place of birth - Foreign born (%) - Other Race
Residents speaking English at home (%)
Residents speaking English at home - Born in the United States (%)
Residents speaking English at home - Native, born elsewhere (%)
Residents speaking English at home - Foreign born (%)
Residents speaking Spanish at home (%)
Residents speaking Spanish at home - Born in the United States (%)
Residents speaking Spanish at home - Native, born elsewhere (%)
Residents speaking Spanish at home - Foreign born (%)
Residents speaking other language at home (%)
Residents speaking other language at home - Born in the United States (%)
Residents speaking other language at home - Native, born elsewhere (%)
Residents speaking other language at home - Foreign born (%)
Marital status - Never married (%)
Marital status - Now married (%)
Marital status - Separated (%)
Marital status - Widowed (%)
Marital status - Divorced (%)
Ancestries Reported - Arab (%)
Ancestries Reported - Czech (%)
Ancestries Reported - Danish (%)
Ancestries Reported - Dutch (%)
Ancestries Reported - English (%)
Ancestries Reported - French (%)
Ancestries Reported - French Canadian (%)
Ancestries Reported - German (%)
Ancestries Reported - Greek (%)
Ancestries Reported - Hungarian (%)
Ancestries Reported - Irish (%)
Ancestries Reported - Italian (%)
Ancestries Reported - Lithuanian (%)
Ancestries Reported - Norwegian (%)
Ancestries Reported - Polish (%)
Ancestries Reported - Portuguese (%)
Ancestries Reported - Russian (%)
Ancestries Reported - Scotch-Irish (%)
Ancestries Reported - Scottish (%)
Ancestries Reported - Slovak (%)
Ancestries Reported - Subsaharan African (%)
Ancestries Reported - Swedish (%)
Ancestries Reported - Swiss (%)
Ancestries Reported - Ukrainian (%)
Ancestries Reported - United States (%)
Ancestries Reported - Welsh (%)
Ancestries Reported - West Indian (%)
Ancestries Reported - Other (%)
Geographical mobility - Same house 1 year ago (%)
Geographical mobility - Same house 1 year ago (%) - White
Geographical mobility - Same house 1 year ago (%) - Black or African American
Geographical mobility - Same house 1 year ago (%) - Asian
Geographical mobility - Same house 1 year ago (%) - Hispanic or Latino
Geographical mobility - Same house 1 year ago (%) - American Indian and Alaska Native
Geographical mobility - Same house 1 year ago (%) - Multirace
Geographical mobility - Same house 1 year ago (%) - Other Race
Geographical mobility - Moved within same county (%)
Geographical mobility - Moved within same county (%) - White
Geographical mobility - Moved within same county (%) - Black or African American
Geographical mobility - Moved within same county (%) - Asian
Geographical mobility - Moved within same county (%) - Hispanic or Latino
Geographical mobility - Moved within same county (%) - American Indian and Alaska Native
Geographical mobility - Moved within same county (%) - Multirace
Geographical mobility - Moved within same county (%) - Other Race
Geographical mobility - Moved from different county within same state (%)
Geographical mobility - Moved from different county within same state (%) - White
Geographical mobility - Moved from different county within same state (%) - Black or African American
Geographical mobility - Moved from different county within same state (%) - Asian
Geographical mobility - Moved from different county within same state (%) - Hispanic or Latino
Geographical mobility - Moved from different county within same state (%) - American Indian and Alaska Native
Geographical mobility - Moved from different county within same state (%) - Multirace
Geographical mobility - Moved from different county within same state (%) - Other Race
Geographical mobility - Moved from different state (%)
Geographical mobility - Moved from different state (%) - White
Geographical mobility - Moved from different state (%) - Black or African American
Geographical mobility - Moved from different state (%) - Asian
Geographical mobility - Moved from different state (%) - Hispanic or Latino
Geographical mobility - Moved from different state (%) - American Indian and Alaska Native
Geographical mobility - Moved from different state (%) - Multirace
Geographical mobility - Moved from different state (%) - Other Race
Geographical mobility - Moved from abroad (%)
Geographical mobility - Moved from abroad (%) - White
Geographical mobility - Moved from abroad (%) - Black or African American
Geographical mobility - Moved from abroad (%) - Asian
Geographical mobility - Moved from abroad (%) - Hispanic or Latino
Geographical mobility - Moved from abroad (%) - American Indian and Alaska Native
Geographical mobility - Moved from abroad (%) - Multirace
Geographical mobility - Moved from abroad (%) - Other Race
Place of birth for the foreign-born population - Ireland (%)
Place of birth for the foreign-born population - Denmark (%)
Place of birth for the foreign-born population - Norway (%)
Place of birth for the foreign-born population - Sweden (%)
Place of birth for the foreign-born population - United Kingdom (%)
Place of birth for the foreign-born population - England (%)
Place of birth for the foreign-born population - Scotland (%)
Place of birth for the foreign-born population - Other Northern Europe (%)
Place of birth for the foreign-born population - Austria (%)
Place of birth for the foreign-born population - Belgium (%)
Place of birth for the foreign-born population - France (%)
Place of birth for the foreign-born population - Germany (%)
Place of birth for the foreign-born population - Netherlands (%)
Place of birth for the foreign-born population - Switzerland (%)
Place of birth for the foreign-born population - Other Western Europe (%)
Place of birth for the foreign-born population - Greece (%)
Place of birth for the foreign-born population - Italy (%)
Place of birth for the foreign-born population - Portugal (%)
Place of birth for the foreign-born population - Spain (%)
Place of birth for the foreign-born population - Other Southern Europe (%)
Place of birth for the foreign-born population - Albania (%)
Place of birth for the foreign-born population - Belarus (%)
Place of birth for the foreign-born population - Bosnia and Herzegovina (%)
Place of birth for the foreign-born population - Bulgaria (%)
Place of birth for the foreign-born population - Croatia (%)
Place of birth for the foreign-born population - Czechoslovakia (%)
Place of birth for the foreign-born population - Hungary (%)
Place of birth for the foreign-born population - Latvia (%)
Place of birth for the foreign-born population - Lithuania (%)
Place of birth for the foreign-born population - North Macedonia (Macedonia) (%)
Place of birth for the foreign-born population - Moldova (%)
Place of birth for the foreign-born population - Poland (%)
Place of birth for the foreign-born population - Romania (%)
Place of birth for the foreign-born population - Russia (%)
Place of birth for the foreign-born population - Serbia (%)
Place of birth for the foreign-born population - Ukraine (%)
Place of birth for the foreign-born population - Other Eastern Europe (%)
Place of birth for the foreign-born population - China (%)
Place of birth for the foreign-born population - Hong Kong (%)
Place of birth for the foreign-born population - Taiwan (%)
Place of birth for the foreign-born population - Japan (%)
Place of birth for the foreign-born population - Korea (%)
Place of birth for the foreign-born population - Other Eastern Asia (%)
Place of birth for the foreign-born population - Afghanistan (%)
Place of birth for the foreign-born population - Bangladesh (%)
Place of birth for the foreign-born population - India (%)
Place of birth for the foreign-born population - Iran (%)
Place of birth for the foreign-born population - Kazakhstan (%)
Place of birth for the foreign-born population - Nepal (%)
Place of birth for the foreign-born population - Pakistan (%)
Place of birth for the foreign-born population - Sri Lanka (%)
Place of birth for the foreign-born population - Uzbekistan (%)
Place of birth for the foreign-born population - Other South Central Asia (%)
Place of birth for the foreign-born population - Burma (%)
Place of birth for the foreign-born population - Cambodia (%)
Place of birth for the foreign-born population - Indonesia (%)
Place of birth for the foreign-born population - Laos (%)
Place of birth for the foreign-born population - Malaysia (%)
Place of birth for the foreign-born population - Philippines (%)
Place of birth for the foreign-born population - Singapore (%)
Place of birth for the foreign-born population - Thailand (%)
Place of birth for the foreign-born population - Vietnam (%)
Place of birth for the foreign-born population - Other South Eastern Asia (%)
Place of birth for the foreign-born population - Armenia (%)
Place of birth for the foreign-born population - Iraq (%)
Place of birth for the foreign-born population - Israel (%)
Place of birth for the foreign-born population - Jordan (%)
Place of birth for the foreign-born population - Kuwait (%)
Place of birth for the foreign-born population - Lebanon (%)
Place of birth for the foreign-born population - Saudi Arabia (%)
Place of birth for the foreign-born population - Syria (%)
Place of birth for the foreign-born population - Turkey (%)
Place of birth for the foreign-born population - Yemen (%)
Place of birth for the foreign-born population - Other Western Asia (%)
Place of birth for the foreign-born population - Eritrea (%)
Place of birth for the foreign-born population - Ethiopia (%)
Place of birth for the foreign-born population - Kenya (%)
Place of birth for the foreign-born population - Somalia (%)
Place of birth for the foreign-born population - Uganda (%)
Place of birth for the foreign-born population - Zimbabwe (%)
Place of birth for the foreign-born population - Other Eastern Africa (%)
Place of birth for the foreign-born population - Cameroon (%)
Place of birth for the foreign-born population - Congo (%)
Place of birth for the foreign-born population - Democratic Republic of Congo (Zaire) (%)
Place of birth for the foreign-born population - Other Middle Africa (%)
Place of birth for the foreign-born population - Egypt (%)
Place of birth for the foreign-born population - Morocco (%)
Place of birth for the foreign-born population - Sudan (%)
Place of birth for the foreign-born population - Other Northern Africa (%)
Place of birth for the foreign-born population - South Africa (%)
Place of birth for the foreign-born population - Other Southern Africa (%)
Place of birth for the foreign-born population - Cabo Verde (%)
Place of birth for the foreign-born population - Ghana (%)
Place of birth for the foreign-born population - Liberia (%)
Place of birth for the foreign-born population - Nigeria (%)
Place of birth for the foreign-born population - Senegal (%)
Place of birth for the foreign-born population - Sierra Leone (%)
Place of birth for the foreign-born population - Other Western Africa (%)
Place of birth for the foreign-born population - Australia (%)
Place of birth for the foreign-born population - New Zealand (%)
Place of birth for the foreign-born population - Fiji (%)
Place of birth for the foreign-born population - Micronesia (%)
Place of birth for the foreign-born population - Bahamas (%)
Place of birth for the foreign-born population - Barbados (%)
Place of birth for the foreign-born population - Cuba (%)
Place of birth for the foreign-born population - Dominica (%)
Place of birth for the foreign-born population - Dominican Republic (%)
Place of birth for the foreign-born population - Grenada (%)
Place of birth for the foreign-born population - Haiti (%)
Place of birth for the foreign-born population - Jamaica (%)
Place of birth for the foreign-born population - St. Vincent and the Grenadines (%)
Place of birth for the foreign-born population - Trinidad and Tobago (%)
Place of birth for the foreign-born population - West Indies (%)
Place of birth for the foreign-born population - Other Caribbean (%)
Place of birth for the foreign-born population - Belize (%)
Place of birth for the foreign-born population - Costa Rica (%)
Place of birth for the foreign-born population - El Salvador (%)
Place of birth for the foreign-born population - Guatemala (%)
Place of birth for the foreign-born population - Honduras (%)
Place of birth for the foreign-born population - Mexico (%)
Place of birth for the foreign-born population - Nicaragua (%)
Place of birth for the foreign-born population - Panama (%)
Place of birth for the foreign-born population - Other Central America (%)
Place of birth for the foreign-born population - Argentina (%)
Place of birth for the foreign-born population - Bolivia (%)
Place of birth for the foreign-born population - Brazil (%)
Place of birth for the foreign-born population - Chile (%)
Place of birth for the foreign-born population - Colombia (%)
Place of birth for the foreign-born population - Ecuador (%)
Place of birth for the foreign-born population - Guyana (%)
Place of birth for the foreign-born population - Peru (%)
Place of birth for the foreign-born population - Uruguay (%)
Place of birth for the foreign-born population - Venezuela (%)
Place of birth for the foreign-born population - Other South America (%)
Place of birth for the foreign-born population - Canada (%)
Place of birth for the foreign-born population - Other Northern America (%)
Place of birth for the foreign-born population - Other (%)
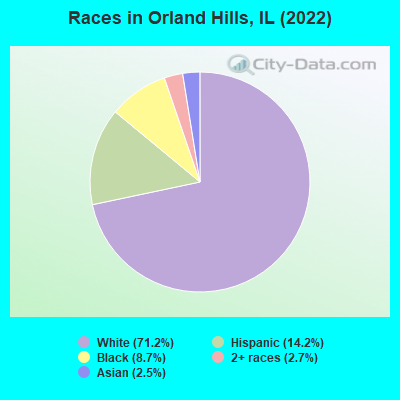
According to 2022 data, the most numerous races in Orland Hills, IL are White alone (4,761 residents), Hispanic (953 residents), and Black alone (580 residents). 73.0% of Orland Hills residents speak English at home. 16.5% of Orland Hills, IL residents are foreign-born (10.1% born in Asia, 3.4% born in Latin America, 1.9% born in Europe), which is 15.2% greater than the foreign-born rate of 14.0% across the entire state of Illinois.
Race distribution in Orland Hills
2000 2022
8,424,140 67.8% White alone 1,856,152 14.9% Black alone 1,530,262 12.3% Hispanic 419,916 3.4% Asian alone 153,996 1.2% Two or more races 13,479 0.1% Other race alone 18,232 0.1% American Indian alone 3,116 0.03% Native Hawaiian and Other
7,356,301 58.5% White alone 2,299,726 18.3% Hispanic 1,660,423 13.2% Black alone 747,296 5.9% Asian alone 458,599 3.6% Two or more races 45,386 0.4% Other race alone 10,405 0.08% American Indian alone 3,896 0.03% Native Hawaiian and Other
Income and house value in Orland Hills Median household income in 2022 $89,767 White non-Hispanic householders$122,232 Asian householders$158,798 Some other race householders$149,075 Two or more races householders$155,763 Hispanic or Latino race householdersMedian 2022 house value $252,372 White Non-Hispanic householders$220,465 Black or African American householders $232,650 Asian householders$230,566 Some other race householders$217,098 Two or more races householders$287,807 Hispanic or Latino householders
Median age by race in Orland Hills
37.3 Median age for White residents30.7 48.3 31.1 Median age for Black or African American residents42.6 28.8 -680,473,372.1 Median age for American Indian / Alaska Native residents-736,736,736.0 -641,399,416.3 40.8 Median age for Asian residents28.0 53.1 -687,999,999.3 Median age for Native Hawaiian / Pacific Islander residents-918,721,460.3 -610,229,276.3 56.7 Median age for Other race residents41.5 68.2 19.5 Median age for Two or more races residents19.5 18.9 36.8 Median age for White alone residents29.2 46.9 32.2 Median age for Hispanic or Latino residents34.2 32.0
Owner/renter occupied households by race in Orland Hills
House owners and renters - White residents 1,494 87.7% Owner occupied210 12.3% Renter occupiedHouse owners and renters - Black or African American residents 93 28.2% Owner occupied236 71.8% Renter occupiedHouse owners and renters - Asian residents 48 100.0% Owner occupiedHouse owners and renters - Other race residents 82 100.0% Owner occupiedHouse owners and renters - Two or more races residents 86 92.2% Owner occupied7 7.8% Renter occupiedHouse owners and renters - White alone residents 1,504 86.6% Owner occupied232 13.4% Renter occupiedHouse owners and renters - Hispanic or Latino residents 218 97.7% Owner occupied5 2.3% Renter occupied
Language usage in Orland Hills
English speakers - Total 73.0% of residents of Orland Hills speak English at home.
6.4% of residents speak Spanish at home 319 80.2% Speak English very well79 19.8% Speak English less than very well20.5% of residents speak other language at home 989 77.2% Speak English very well292 22.8% Speak English less than very well
English speakers - Born in the United States 84.8% of residents of Orland Hills speak English at home.
9.6% of residents speak Spanish at home 23 69.7% Speak English very well10 30.3% Speak English less than very well5.6% of residents speak other language at home 19 100.0% Speak English very well
All residents speak only English at home
English speakers - Foreign-born 15.7% of residents of Orland Hills speak English at home.
18.6% of residents speak Spanish at home 137 66.8% Speak English very well68 33.2% Speak English less than very well64.7% of residents speak other language at home 421 58.9% Speak English very well294 41.1% Speak English less than very well
White (Caucasian) - Speak only English Native:
87.8% (3,292)Foreign-born:
15.4% (85)
White (Caucasian) - Speak another language Native:
11.9% (447)Foreign-born:
84.7% (470)
Asian - Speak only English Native:
100.0% (45)Foreign-born:
30.7% (39)
Other race - Speak only English Native:
26.8% (17)Foreign-born:
17.5% (20)
Other race - Speak another language Native:
73.4% (47)Foreign-born:
80.9% (92)
Two or more races - Speak only English Native:
88.6% (497)Foreign-born:
20.6% (29)
Two or more races - Speak another language Native:
8.0% (45)Foreign-born:
79.4% (111)
White alone - Speak only English Native:
84.3% (3,228)Foreign-born:
13.8% (94)
White alone - Speak another language Native:
16.5% (630)Foreign-born:
86.3% (588)
Hispanic or Latino - Speak only English Native:
76.5% (426)Foreign-born:
15.0% (35)
Hispanic or Latino - Speak another language Native:
26.3% (146)Foreign-born:
83.7% (196)
Foreign-born residents in Orland Hills 1,105 residents are foreign born (10.1% Asia , 3.4% Latin America , 1.9% Europe ).
This city:
16.5%Illinois:
14.1%
Marital status for residents in Orland Hills Marital status - White (Caucasian) population 15 years and over
Males 45.4% Never married48.7% Now married0.2% Separated0.6% Widowed5.0% DivorcedFemales 20.1% Never married59.1% Now married1.8% Separated5.6% Widowed13.4% DivorcedWomen who gave birth in the past 12 months Now married:
79.2% (36)Unmarried:
20.8% (9)
Women who did not give birth in the past 12 months Now married:
59.4% (554)Unmarried:
40.6% (379)
Marital status - Black or African American population 15 years and over
Males 0.0% Never married69.4% Now married30.6% Separated0.0% Widowed0.0% DivorcedFemales 66.8% Never married10.1% Now married8.3% Separated0.0% Widowed14.8% DivorcedWomen who did not give birth in the past 12 months Now married:
21.6% (48)Unmarried:
78.4% (175)
Marital status - Asian population 15 years and over
Males 34.3% Never married65.7% Now married0.0% Separated0.0% Widowed0.0% DivorcedFemales 0.0% Never married40.4% Now married0.0% Separated34.8% Widowed24.7% DivorcedWomen who did not give birth in the past 12 months Now married:
100.0% (23)Unmarried:
0.0% (0)
Marital status - Other race population 15 years and over
Males 30.6% Never married39.8% Now married0.0% Separated0.0% Widowed29.6% DivorcedFemales 25.5% Never married74.5% Now married0.0% Separated0.0% Widowed0.0% DivorcedWomen who did not give birth in the past 12 months Now married:
46.2% (14)Unmarried:
53.8% (16)
Marital status - Two or more races population 15 years and over
Males 60.2% Never married15.4% Now married0.0% Separated0.0% Widowed24.4% DivorcedFemales 37.6% Never married53.5% Now married0.0% Separated0.0% Widowed8.9% DivorcedWomen who gave birth in the past 12 months Now married:
0.0% (0)Unmarried:
100.0% (7)
Women who did not give birth in the past 12 months Now married:
43.3% (72)Unmarried:
56.7% (94)
Marital status - White alone, not Hispanic / Latino population 15 years and over
Males 46.4% Never married48.5% Now married0.2% Separated0.7% Widowed4.2% DivorcedFemales 20.9% Never married58.0% Now married1.9% Separated6.0% Widowed13.2% DivorcedWomen who gave birth in the past 12 months Now married:
79.2% (40)Unmarried:
20.8% (10)
Women who did not give birth in the past 12 months Now married:
57.3% (555)Unmarried:
42.7% (413)
Marital status - Hispanic or Latino population 15 years and over
Males 46.3% Never married34.5% Now married0.0% Separated0.0% Widowed19.1% DivorcedFemales 30.7% Never married59.4% Now married0.0% Separated0.0% Widowed9.9% DivorcedWomen who gave birth in the past 12 months Now married:
0.0% (0)Unmarried:
100.0% (5)
Women who did not give birth in the past 12 months Now married:
50.6% (123)Unmarried:
49.4% (120)
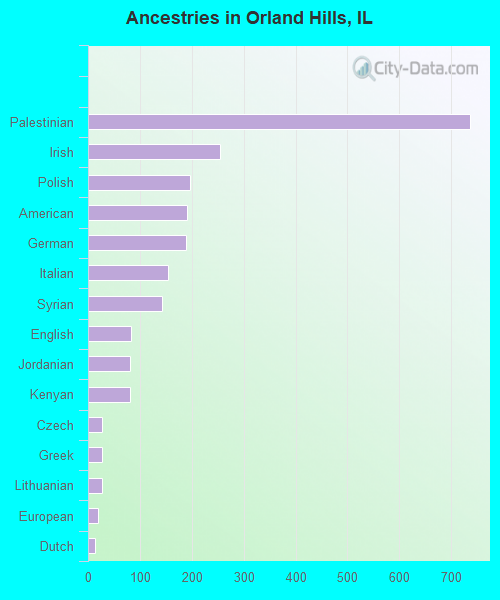
Ancestries in Orland Hills
736 24.3% Palestinian254 8.4% Irish197 6.5% Polish190 6.3% American189 6.2% German154 5.1% Italian143 4.7% Syrian82 2.7% English81 2.7% Jordanian80 2.6% Kenyan27 0.9% Czech27 0.9% Greek27 0.9% Lithuanian19 0.6% European13 0.4% Dutch
Children Nativity (place of birth) in Orland Hills
Children under 6 years - Living with two parents Both parents native 158 100.0% NativeBoth parents foreign-born 105 100.0% NativeOne native, one foreign-born parent 136 100.0% NativeChildren under 6 years - Living with one parent Native parent 171 100.0% NativeChildren 6 to 17 years - Living with two parents Both parents native 291 100.0% NativeBoth parents foreign-born 235 94.0% Native15 6.0% Foreign-bornOne native, one foreign-born parent 80 100.0% NativeChildren 6 to 17 years - Living with one parent Native parent 194 100.0% Native
Grandparents responsible for own grandchildren in Orland Hills
Grandparents (30 to 59 years) White / Caucasian 13 100.0% Not responsible for grandchildrenBlack or African American 25 100.0% Responsible for grandchildrenWhite alone, not Hispanic / Latino 11 100.0% Not responsible for grandchildren
Grandparents (60 years and over) White / Caucasian 12 100.0% Responsible for grandchildrenWhite alone, not Hispanic / Latino 15 100.0% Responsible for grandchildren