Races in Orlovista, Florida (FL) Detailed Stats
Data:
Races - White alone (%)
Races - White alone (% change since 2000)
Races - Black alone (%)
Races - Black alone (% change since 2000)
Races - American Indian alone (%)
Races - American Indian alone (% change since 2000)
Races - Asian alone (%)
Races - Asian alone (% change since 2000)
Races - Hispanic (%)
Races - Hispanic (% change since 2000)
Races - Native Hawaiian and Other Pacific Islander alone (%)
Races - Native Hawaiian and Other Pacific Islander alone (% change since 2000)
Races - Two or more races(%)
Races - Two or more races(% change since 2000)
Races - Other race alone (%)
Races - Other race alone (% change since 2000)
Racial diversity
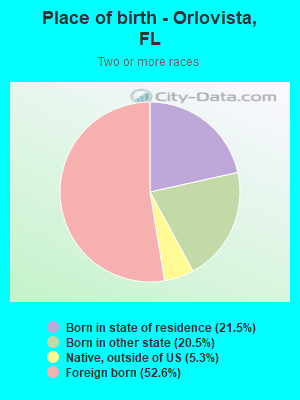
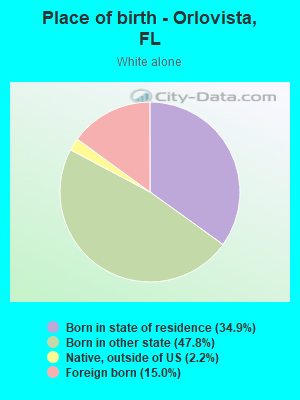
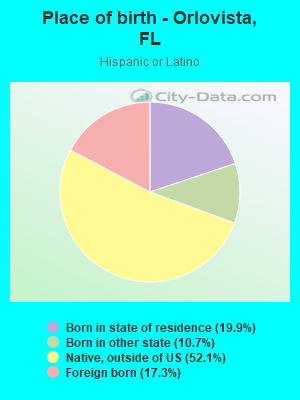
Place of birth - Born in state of residence (%)
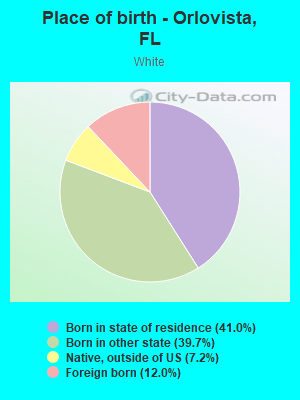
Place of birth - Born in state of residence (%) - White
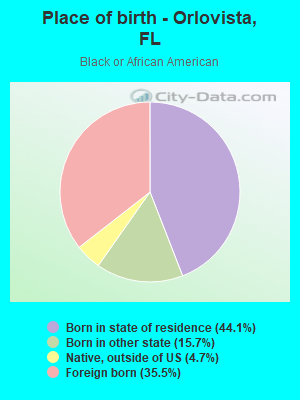
Place of birth - Born in state of residence (%) - Black or African American
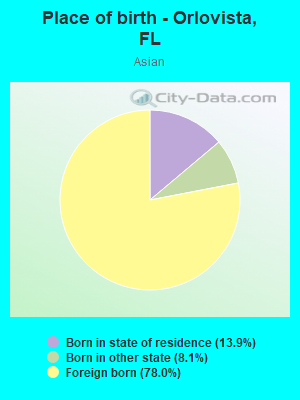
Place of birth - Born in state of residence (%) - Asian
Place of birth - Born in state of residence (%) - Hispanic or Latino
Place of birth - Born in state of residence (%) - American Indian and Alaska Native
Place of birth - Born in state of residence (%) - Multirace
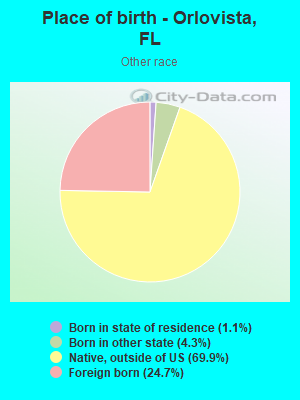
Place of birth - Born in state of residence (%) - Other Race
Place of birth - Born in other state (%)
Place of birth - Born in other state (%) - White
Place of birth - Born in other state (%) - Black or African American
Place of birth - Born in other state (%) - Asian
Place of birth - Born in other state (%) - Hispanic or Latino
Place of birth - Born in other state (%) - American Indian and Alaska Native
Place of birth - Born in other state (%) - Multirace
Place of birth - Born in other state (%) - Other Race
Place of birth - Native, outside of US (%)
Place of birth - Native, outside of US (%) - White
Place of birth - Native, outside of US (%) - Black or African American
Place of birth - Native, outside of US (%) - Asian
Place of birth - Native, outside of US (%) - Hispanic or Latino
Place of birth - Native, outside of US (%) - American Indian and Alaska Native
Place of birth - Native, outside of US (%) - Multirace
Place of birth - Native, outside of US (%) - Other Race
Place of birth - Foreign born (%)
Place of birth - Foreign born (%) - White
Place of birth - Foreign born (%) - Black or African American
Place of birth - Foreign born (%) - Asian
Place of birth - Foreign born (%) - Hispanic or Latino
Place of birth - Foreign born (%) - American Indian and Alaska Native
Place of birth - Foreign born (%) - Multirace
Place of birth - Foreign born (%) - Other Race
Residents speaking English at home (%)
Residents speaking English at home - Born in the United States (%)
Residents speaking English at home - Native, born elsewhere (%)
Residents speaking English at home - Foreign born (%)
Residents speaking Spanish at home (%)
Residents speaking Spanish at home - Born in the United States (%)
Residents speaking Spanish at home - Native, born elsewhere (%)
Residents speaking Spanish at home - Foreign born (%)
Residents speaking other language at home (%)
Residents speaking other language at home - Born in the United States (%)
Residents speaking other language at home - Native, born elsewhere (%)
Residents speaking other language at home - Foreign born (%)
Marital status - Never married (%)
Marital status - Now married (%)
Marital status - Separated (%)
Marital status - Widowed (%)
Marital status - Divorced (%)
Ancestries Reported - Arab (%)
Ancestries Reported - Czech (%)
Ancestries Reported - Danish (%)
Ancestries Reported - Dutch (%)
Ancestries Reported - English (%)
Ancestries Reported - French (%)
Ancestries Reported - French Canadian (%)
Ancestries Reported - German (%)
Ancestries Reported - Greek (%)
Ancestries Reported - Hungarian (%)
Ancestries Reported - Irish (%)
Ancestries Reported - Italian (%)
Ancestries Reported - Lithuanian (%)
Ancestries Reported - Norwegian (%)
Ancestries Reported - Polish (%)
Ancestries Reported - Portuguese (%)
Ancestries Reported - Russian (%)
Ancestries Reported - Scotch-Irish (%)
Ancestries Reported - Scottish (%)
Ancestries Reported - Slovak (%)
Ancestries Reported - Subsaharan African (%)
Ancestries Reported - Swedish (%)
Ancestries Reported - Swiss (%)
Ancestries Reported - Ukrainian (%)
Ancestries Reported - United States (%)
Ancestries Reported - Welsh (%)
Ancestries Reported - West Indian (%)
Ancestries Reported - Other (%)
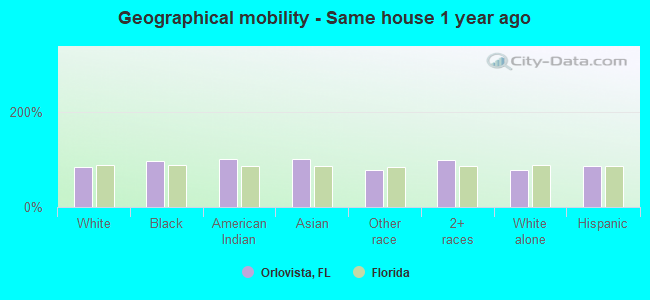
Geographical mobility - Same house 1 year ago (%)
Geographical mobility - Same house 1 year ago (%) - White
Geographical mobility - Same house 1 year ago (%) - Black or African American
Geographical mobility - Same house 1 year ago (%) - Asian
Geographical mobility - Same house 1 year ago (%) - Hispanic or Latino
Geographical mobility - Same house 1 year ago (%) - American Indian and Alaska Native
Geographical mobility - Same house 1 year ago (%) - Multirace
Geographical mobility - Same house 1 year ago (%) - Other Race
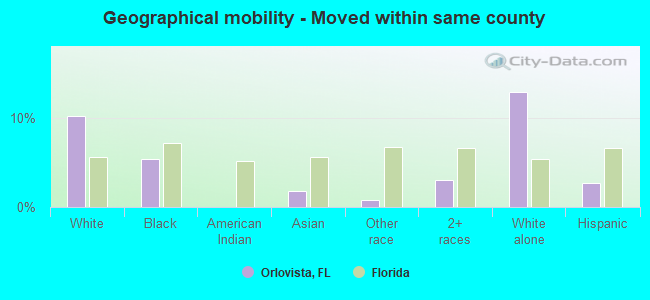
Geographical mobility - Moved within same county (%)
Geographical mobility - Moved within same county (%) - White
Geographical mobility - Moved within same county (%) - Black or African American
Geographical mobility - Moved within same county (%) - Asian
Geographical mobility - Moved within same county (%) - Hispanic or Latino
Geographical mobility - Moved within same county (%) - American Indian and Alaska Native
Geographical mobility - Moved within same county (%) - Multirace
Geographical mobility - Moved within same county (%) - Other Race
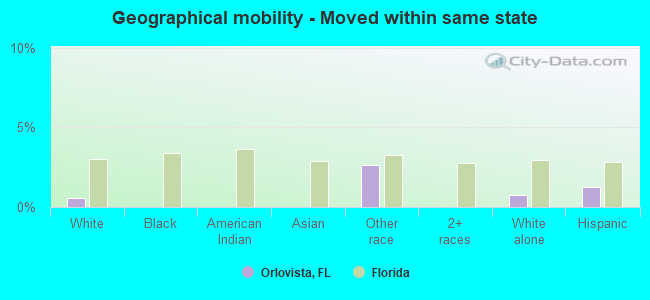
Geographical mobility - Moved from different county within same state (%)
Geographical mobility - Moved from different county within same state (%) - White
Geographical mobility - Moved from different county within same state (%) - Black or African American
Geographical mobility - Moved from different county within same state (%) - Asian
Geographical mobility - Moved from different county within same state (%) - Hispanic or Latino
Geographical mobility - Moved from different county within same state (%) - American Indian and Alaska Native
Geographical mobility - Moved from different county within same state (%) - Multirace
Geographical mobility - Moved from different county within same state (%) - Other Race
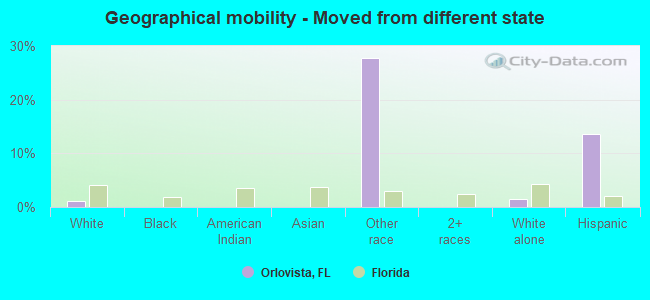
Geographical mobility - Moved from different state (%)
Geographical mobility - Moved from different state (%) - White
Geographical mobility - Moved from different state (%) - Black or African American
Geographical mobility - Moved from different state (%) - Asian
Geographical mobility - Moved from different state (%) - Hispanic or Latino
Geographical mobility - Moved from different state (%) - American Indian and Alaska Native
Geographical mobility - Moved from different state (%) - Multirace
Geographical mobility - Moved from different state (%) - Other Race
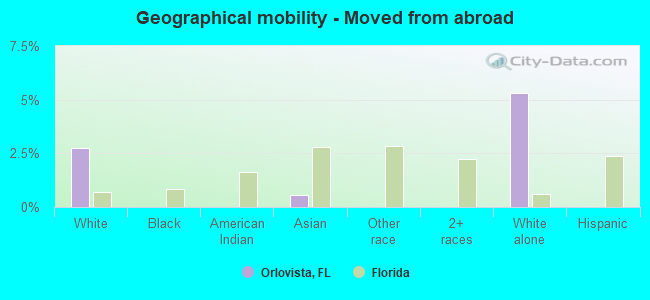
Geographical mobility - Moved from abroad (%)
Geographical mobility - Moved from abroad (%) - White
Geographical mobility - Moved from abroad (%) - Black or African American
Geographical mobility - Moved from abroad (%) - Asian
Geographical mobility - Moved from abroad (%) - Hispanic or Latino
Geographical mobility - Moved from abroad (%) - American Indian and Alaska Native
Geographical mobility - Moved from abroad (%) - Multirace
Geographical mobility - Moved from abroad (%) - Other Race
Place of birth for the foreign-born population - Ireland (%)
Place of birth for the foreign-born population - Denmark (%)
Place of birth for the foreign-born population - Norway (%)
Place of birth for the foreign-born population - Sweden (%)
Place of birth for the foreign-born population - United Kingdom (%)
Place of birth for the foreign-born population - England (%)
Place of birth for the foreign-born population - Scotland (%)
Place of birth for the foreign-born population - Other Northern Europe (%)
Place of birth for the foreign-born population - Austria (%)
Place of birth for the foreign-born population - Belgium (%)
Place of birth for the foreign-born population - France (%)
Place of birth for the foreign-born population - Germany (%)
Place of birth for the foreign-born population - Netherlands (%)
Place of birth for the foreign-born population - Switzerland (%)
Place of birth for the foreign-born population - Other Western Europe (%)
Place of birth for the foreign-born population - Greece (%)
Place of birth for the foreign-born population - Italy (%)
Place of birth for the foreign-born population - Portugal (%)
Place of birth for the foreign-born population - Spain (%)
Place of birth for the foreign-born population - Other Southern Europe (%)
Place of birth for the foreign-born population - Albania (%)
Place of birth for the foreign-born population - Belarus (%)
Place of birth for the foreign-born population - Bosnia and Herzegovina (%)
Place of birth for the foreign-born population - Bulgaria (%)
Place of birth for the foreign-born population - Croatia (%)
Place of birth for the foreign-born population - Czechoslovakia (%)
Place of birth for the foreign-born population - Hungary (%)
Place of birth for the foreign-born population - Latvia (%)
Place of birth for the foreign-born population - Lithuania (%)
Place of birth for the foreign-born population - North Macedonia (Macedonia) (%)
Place of birth for the foreign-born population - Moldova (%)
Place of birth for the foreign-born population - Poland (%)
Place of birth for the foreign-born population - Romania (%)
Place of birth for the foreign-born population - Russia (%)
Place of birth for the foreign-born population - Serbia (%)
Place of birth for the foreign-born population - Ukraine (%)
Place of birth for the foreign-born population - Other Eastern Europe (%)
Place of birth for the foreign-born population - China (%)
Place of birth for the foreign-born population - Hong Kong (%)
Place of birth for the foreign-born population - Taiwan (%)
Place of birth for the foreign-born population - Japan (%)
Place of birth for the foreign-born population - Korea (%)
Place of birth for the foreign-born population - Other Eastern Asia (%)
Place of birth for the foreign-born population - Afghanistan (%)
Place of birth for the foreign-born population - Bangladesh (%)
Place of birth for the foreign-born population - India (%)
Place of birth for the foreign-born population - Iran (%)
Place of birth for the foreign-born population - Kazakhstan (%)
Place of birth for the foreign-born population - Nepal (%)
Place of birth for the foreign-born population - Pakistan (%)
Place of birth for the foreign-born population - Sri Lanka (%)
Place of birth for the foreign-born population - Uzbekistan (%)
Place of birth for the foreign-born population - Other South Central Asia (%)
Place of birth for the foreign-born population - Burma (%)
Place of birth for the foreign-born population - Cambodia (%)
Place of birth for the foreign-born population - Indonesia (%)
Place of birth for the foreign-born population - Laos (%)
Place of birth for the foreign-born population - Malaysia (%)
Place of birth for the foreign-born population - Philippines (%)
Place of birth for the foreign-born population - Singapore (%)
Place of birth for the foreign-born population - Thailand (%)
Place of birth for the foreign-born population - Vietnam (%)
Place of birth for the foreign-born population - Other South Eastern Asia (%)
Place of birth for the foreign-born population - Armenia (%)
Place of birth for the foreign-born population - Iraq (%)
Place of birth for the foreign-born population - Israel (%)
Place of birth for the foreign-born population - Jordan (%)
Place of birth for the foreign-born population - Kuwait (%)
Place of birth for the foreign-born population - Lebanon (%)
Place of birth for the foreign-born population - Saudi Arabia (%)
Place of birth for the foreign-born population - Syria (%)
Place of birth for the foreign-born population - Turkey (%)
Place of birth for the foreign-born population - Yemen (%)
Place of birth for the foreign-born population - Other Western Asia (%)
Place of birth for the foreign-born population - Eritrea (%)
Place of birth for the foreign-born population - Ethiopia (%)
Place of birth for the foreign-born population - Kenya (%)
Place of birth for the foreign-born population - Somalia (%)
Place of birth for the foreign-born population - Uganda (%)
Place of birth for the foreign-born population - Zimbabwe (%)
Place of birth for the foreign-born population - Other Eastern Africa (%)
Place of birth for the foreign-born population - Cameroon (%)
Place of birth for the foreign-born population - Congo (%)
Place of birth for the foreign-born population - Democratic Republic of Congo (Zaire) (%)
Place of birth for the foreign-born population - Other Middle Africa (%)
Place of birth for the foreign-born population - Egypt (%)
Place of birth for the foreign-born population - Morocco (%)
Place of birth for the foreign-born population - Sudan (%)
Place of birth for the foreign-born population - Other Northern Africa (%)
Place of birth for the foreign-born population - South Africa (%)
Place of birth for the foreign-born population - Other Southern Africa (%)
Place of birth for the foreign-born population - Cabo Verde (%)
Place of birth for the foreign-born population - Ghana (%)
Place of birth for the foreign-born population - Liberia (%)
Place of birth for the foreign-born population - Nigeria (%)
Place of birth for the foreign-born population - Senegal (%)
Place of birth for the foreign-born population - Sierra Leone (%)
Place of birth for the foreign-born population - Other Western Africa (%)
Place of birth for the foreign-born population - Australia (%)
Place of birth for the foreign-born population - New Zealand (%)
Place of birth for the foreign-born population - Fiji (%)
Place of birth for the foreign-born population - Micronesia (%)
Place of birth for the foreign-born population - Bahamas (%)
Place of birth for the foreign-born population - Barbados (%)
Place of birth for the foreign-born population - Cuba (%)
Place of birth for the foreign-born population - Dominica (%)
Place of birth for the foreign-born population - Dominican Republic (%)
Place of birth for the foreign-born population - Grenada (%)
Place of birth for the foreign-born population - Haiti (%)
Place of birth for the foreign-born population - Jamaica (%)
Place of birth for the foreign-born population - St. Vincent and the Grenadines (%)
Place of birth for the foreign-born population - Trinidad and Tobago (%)
Place of birth for the foreign-born population - West Indies (%)
Place of birth for the foreign-born population - Other Caribbean (%)
Place of birth for the foreign-born population - Belize (%)
Place of birth for the foreign-born population - Costa Rica (%)
Place of birth for the foreign-born population - El Salvador (%)
Place of birth for the foreign-born population - Guatemala (%)
Place of birth for the foreign-born population - Honduras (%)
Place of birth for the foreign-born population - Mexico (%)
Place of birth for the foreign-born population - Nicaragua (%)
Place of birth for the foreign-born population - Panama (%)
Place of birth for the foreign-born population - Other Central America (%)
Place of birth for the foreign-born population - Argentina (%)
Place of birth for the foreign-born population - Bolivia (%)
Place of birth for the foreign-born population - Brazil (%)
Place of birth for the foreign-born population - Chile (%)
Place of birth for the foreign-born population - Colombia (%)
Place of birth for the foreign-born population - Ecuador (%)
Place of birth for the foreign-born population - Guyana (%)
Place of birth for the foreign-born population - Peru (%)
Place of birth for the foreign-born population - Uruguay (%)
Place of birth for the foreign-born population - Venezuela (%)
Place of birth for the foreign-born population - Other South America (%)
Place of birth for the foreign-born population - Canada (%)
Place of birth for the foreign-born population - Other Northern America (%)
Place of birth for the foreign-born population - Other (%)
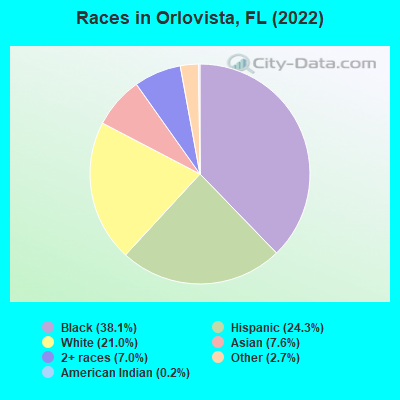
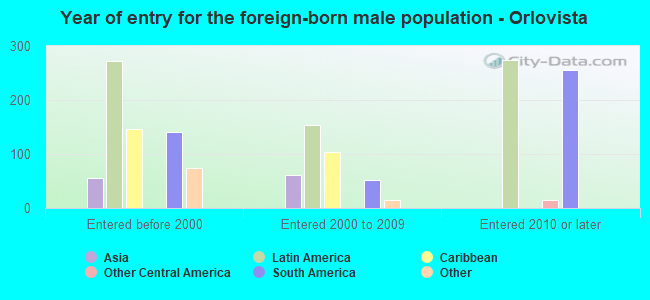
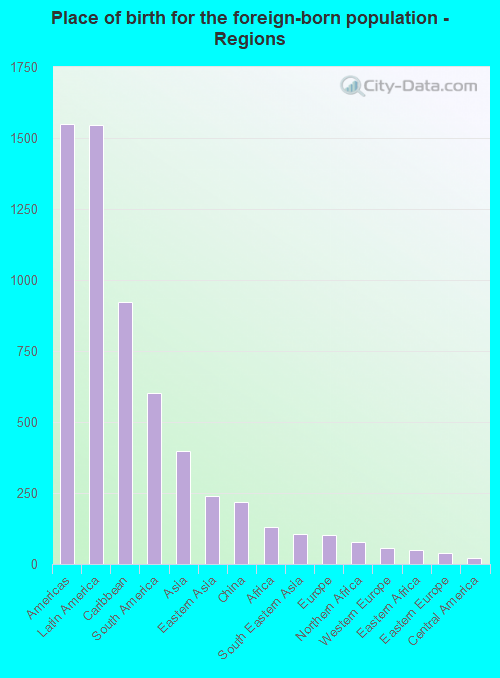
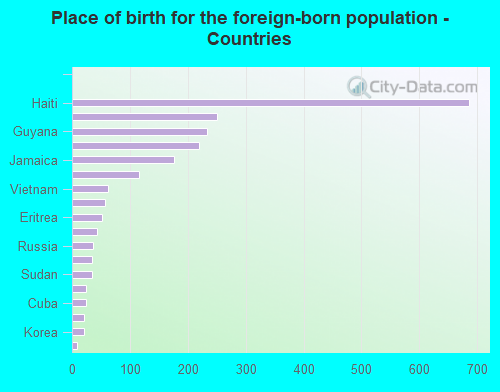
According to 2022 data, the most numerous races in Orlovista, FL are White alone (1,425 residents), Hispanic (1,647 residents), and Black alone (2,580 residents). 52.9% of Orlovista residents speak English at home. 32.1% of Orlovista, FL residents are foreign-born (22.0% born in Latin America, 5.7% born in Asia), which is 34.6% greater than the foreign-born rate of 21.0% across the entire state of Florida.
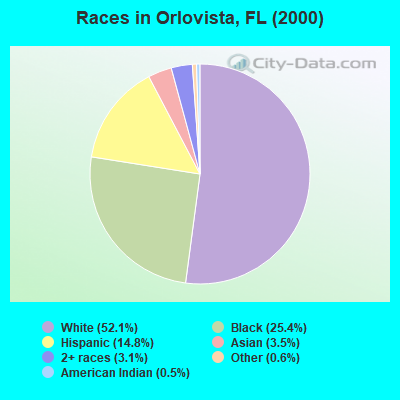
Race distribution in Orlovista
2000 2022
10,458,509 65.4% White alone 2,682,715 16.8% Hispanic 2,264,268 14.2% Black alone 261,693 1.6% Asian alone 236,954 1.5% Two or more races 42,358 0.3% American Indian alone 28,994 0.2% Other race alone 6,887 0.04% Native Hawaiian and Other
11,309,403 50.8% White alone 6,025,039 27.1% Hispanic 3,241,015 14.6% Black alone 861,630 3.9% Two or more races 623,692 2.8% Asian alone 152,054 0.7% Other race alone 22,504 0.1% American Indian alone 9,486 0.04% Native Hawaiian and Other
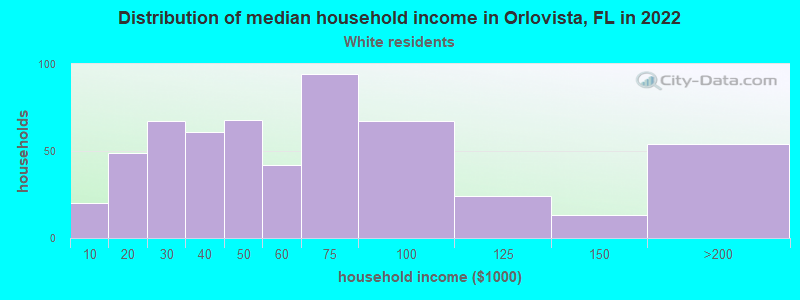
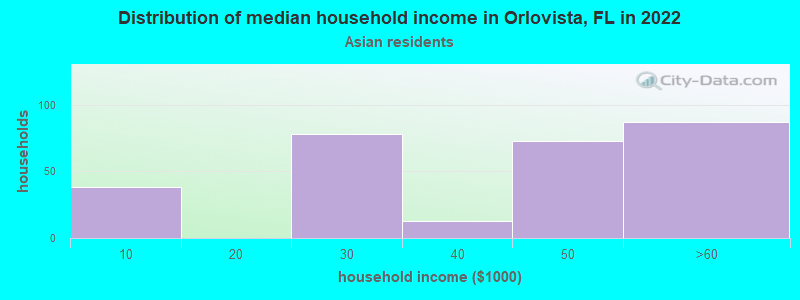
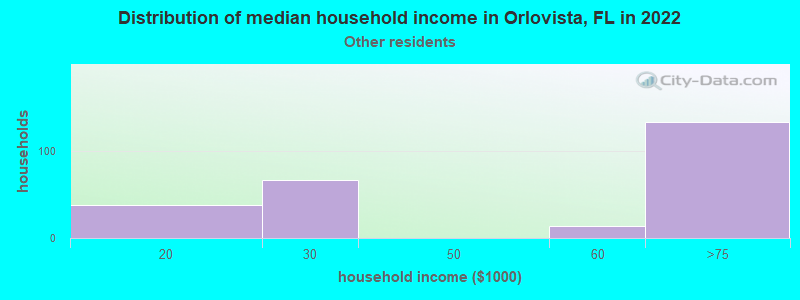
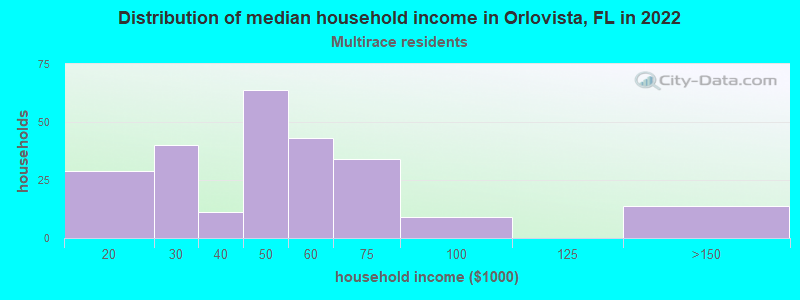
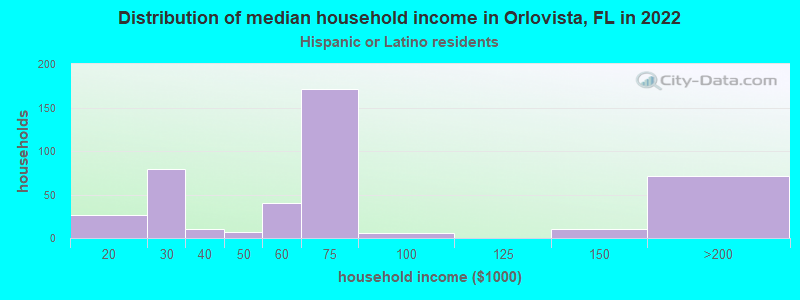
Income and house value in Orlovista Median household income in 2022 $39,184 White non-Hispanic householders$45,980 Black householders$40,603 Asian householders$43,883 Two or more races householders$67,264 Hispanic or Latino race householdersMedian 2022 house value $211,965 White Non-Hispanic householders$216,852 Black or African American householders $176,230 Asian householders$198,527 Some other race householders$205,246 Two or more races householders$223,266 Hispanic or Latino householders
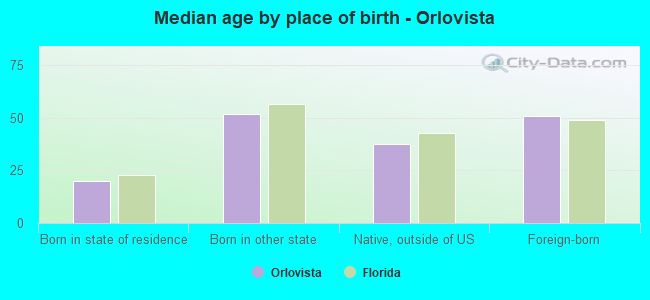
Median age by race in Orlovista
32.8 Median age for White residents28.5 34.2 29.1 Median age for Black or African American residents25.3 45.8 10.7 Median age for American Indian / Alaska Native residents12.8 -529,680,364.8 47.3 Median age for Asian residents45.1 56.7 -679,790,025.6 Median age for Native Hawaiian / Pacific Islander residents-1,327,635,326.3 -611,111,110.5 69.0 Median age for Other race residents72.8 35.3 50.2 Median age for Two or more races residents60.9 48.6 39.9 Median age for White alone residents42.6 40.0 34.9 Median age for Hispanic or Latino residents34.7 36.1
Owner/renter occupied households by race in Orlovista
House owners and renters - White residents 355 59.5% Owner occupied241 40.5% Renter occupiedHouse owners and renters - Black or African American residents 664 60.9% Owner occupied427 39.1% Renter occupiedHouse owners and renters - American Indian / Alaska Native residents 6 100.0% Renter occupiedHouse owners and renters - Asian residents 187 67.2% Owner occupied91 32.8% Renter occupiedHouse owners and renters - Other race residents 181 53.7% Owner occupied156 46.3% Renter occupiedHouse owners and renters - Two or more races residents 163 63.9% Owner occupied92 36.1% Renter occupiedHouse owners and renters - White alone residents 336 58.3% Owner occupied240 41.7% Renter occupiedHouse owners and renters - Hispanic or Latino residents 260 60.4% Owner occupied170 39.6% Renter occupied
Language usage in Orlovista
English speakers - Total 52.9% of residents of Orlovista speak English at home.
17.9% of residents speak Spanish at home 540 49.4% Speak English very well553 50.6% Speak English less than very well30.5% of residents speak other language at home 1,081 58.1% Speak English very well781 41.9% Speak English less than very well
English speakers - Born in the United States 82.2% of residents of Orlovista speak English at home.
9.5% of residents speak Spanish at home 115 89.1% Speak English very well14 10.9% Speak English less than very well7.7% of residents speak other language at home 105 100.0% Speak English very well
English speakers - Native, born elsewhere 18.2% of residents of Orlovista speak English at home.
61.2% of residents speak Spanish at home 261 43.9% Speak English very well334 56.1% Speak English less than very well15.0% of residents speak other language at home 146 100.0% Speak English very well
English speakers - Foreign-born 27.3% of residents of Orlovista speak English at home.
7.4% of residents speak Spanish at home 59 36.6% Speak English very well102 63.4% Speak English less than very well65.8% of residents speak other language at home 681 47.8% Speak English very well743 52.2% Speak English less than very well
White (Caucasian) - Speak only English Native:
82.6% (1,042)Foreign-born:
40.0% (81)
White (Caucasian) - Speak another language Native:
13.7% (173)Foreign-born:
64.1% (129)
Black or African American - Speak only English Native:
77.3% (1,150)Foreign-born:
23.9% (225)
Black or African American - Speak another language Native:
24.4% (363)Foreign-born:
73.0% (688)
Asian - Speak another language Native:
89.7% (93)Foreign-born:
81.1% (328)
Other race - Speak another language Native:
68.6% (621)Foreign-born:
100.0% (219)
Two or more races - Speak only English Native:
61.1% (190)Foreign-born:
68.2% (271)
Two or more races - Speak another language Native:
38.0% (118)Foreign-born:
30.2% (120)
White alone - Speak only English Native:
96.6% (1,026)Foreign-born:
44.4% (95)
White alone - Speak another language Native:
3.4% (36)Foreign-born:
49.6% (106)
Hispanic or Latino - Speak only English Native:
25.2% (300)Foreign-born:
17.9% (43)
Hispanic or Latino - Speak another language Native:
72.8% (867)Foreign-born:
80.3% (195)
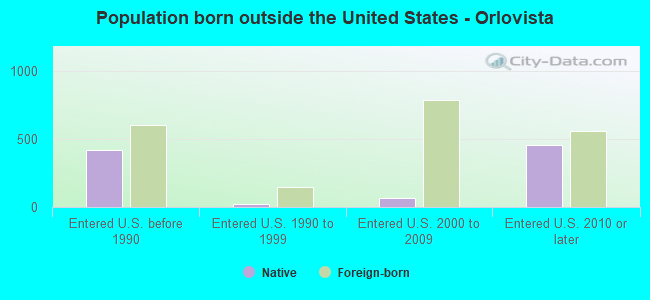
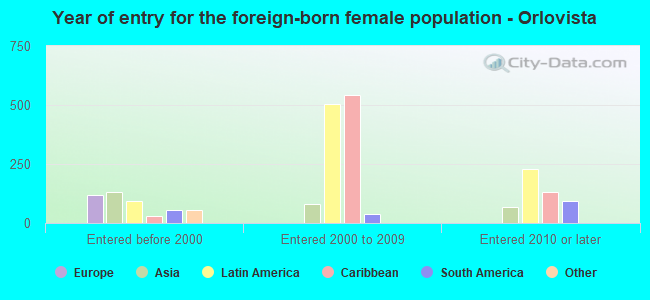
Foreign-born residents in Orlovista 2,178 residents are foreign born (22.0% Latin America , 5.7% Asia ).
This city:
32.1%Florida:
21.1%
Marital status for residents in Orlovista Marital status - White (Caucasian) population 15 years and over
Males 32.9% Never married34.7% Now married1.1% Separated0.3% Widowed31.0% DivorcedFemales 37.3% Never married29.5% Now married1.9% Separated8.9% Widowed22.4% DivorcedWomen who gave birth in the past 12 months Now married:
65.5% (29)Unmarried:
34.5% (15)
Women who did not give birth in the past 12 months Now married:
19.0% (94)Unmarried:
81.0% (400)
Marital status - Black or African American population 15 years and over
Males 55.4% Never married29.3% Now married2.9% Separated0.0% Widowed12.4% DivorcedFemales 65.6% Never married16.1% Now married1.3% Separated9.7% Widowed7.4% DivorcedWomen who did not give birth in the past 12 months Now married:
16.4% (155)Unmarried:
83.6% (793)
Marital status - Asian population 15 years and over
Males 19.9% Never married68.1% Now married0.0% Separated0.0% Widowed12.0% DivorcedFemales 17.6% Never married40.0% Now married7.5% Separated0.0% Widowed34.9% DivorcedWomen who did not give birth in the past 12 months Now married:
60.7% (72)Unmarried:
39.3% (47)
Marital status - Other race population 15 years and over
Males 44.0% Never married42.9% Now married0.0% Separated0.0% Widowed13.1% DivorcedFemales 2.8% Never married74.1% Now married0.0% Separated2.4% Widowed20.7% DivorcedWomen who did not give birth in the past 12 months Now married:
43.4% (63)Unmarried:
56.6% (83)
Marital status - Two or more races population 15 years and over
Males 22.0% Never married46.2% Now married3.6% Separated0.0% Widowed28.3% DivorcedFemales 29.9% Never married45.3% Now married0.0% Separated0.5% Widowed24.4% DivorcedWomen who gave birth in the past 12 months Now married:
100.0% (26)Unmarried:
0.0% (0)
Women who did not give birth in the past 12 months Now married:
16.2% (24)Unmarried:
83.8% (126)
Marital status - White alone, not Hispanic / Latino population 15 years and over
Males 30.7% Never married24.4% Now married1.5% Separated0.4% Widowed43.0% DivorcedFemales 37.1% Never married23.1% Now married2.5% Separated11.6% Widowed25.7% DivorcedWomen who gave birth in the past 12 months Now married:
100.0% (35)Unmarried:
0.0% (0)
Women who did not give birth in the past 12 months Now married:
5.2% (21)Unmarried:
94.8% (383)
Marital status - Hispanic or Latino population 15 years and over
Males 52.0% Never married43.3% Now married1.3% Separated0.0% Widowed3.4% DivorcedFemales 17.4% Never married62.7% Now married0.0% Separated1.3% Widowed18.6% DivorcedWomen who gave birth in the past 12 months Now married:
0.0% (0)Unmarried:
100.0% (19)
Women who did not give birth in the past 12 months Now married:
46.3% (158)Unmarried:
53.7% (183)
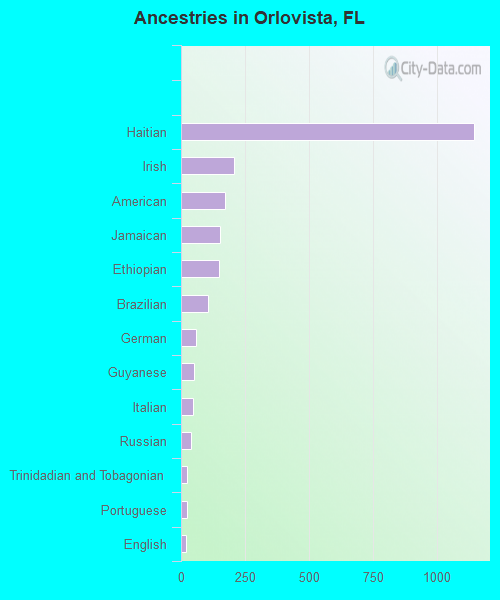
Ancestries in Orlovista
1,147 24.2% Haitian207 4.4% Irish172 3.6% American152 3.2% Jamaican149 3.1% Ethiopian107 2.3% Brazilian60 1.3% German50 1.1% Guyanese47 1.0% Italian38 0.8% Russian25 0.5% Trinidadian and Tobagonian22 0.5% Portuguese18 0.4% English8 0.2% Danish8 0.2% Scotch-Irish5 0.1% European
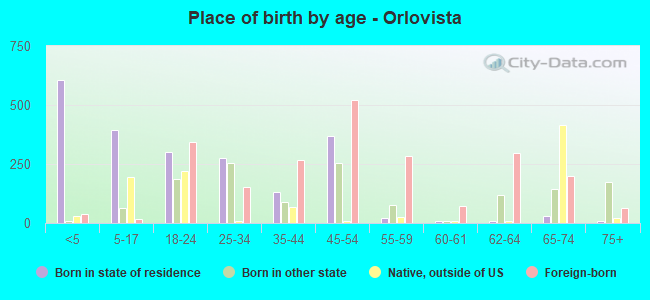
Children Nativity (place of birth) in Orlovista
Children under 6 years - Living with two parents Both parents native 39 100.0% NativeBoth parents foreign-born 128 73.4% Native47 26.6% Foreign-bornOne native, one foreign-born parent 155 100.0% NativeChildren under 6 years - Living with one parent Native parent 118 100.0% NativeForeign-born parent 237 100.0% NativeChildren 6 to 17 years - Living with two parents Both parents native 58 99.8% Native0 0.2% Foreign-bornBoth parents foreign-born 61 76.8% Native18 23.2% Foreign-bornOne native, one foreign-born parent 34 100.0% NativeChildren 6 to 17 years - Living with one parent Native parent 374 100.0% Native
Grandparents responsible for own grandchildren in Orlovista
Grandparents (30 to 59 years) White / Caucasian 76 79.8% Responsible for grandchildren19 20.2% Not responsible for grandchildrenBlack or African American 23 100.0% Responsible for grandchildrenWhite alone, not Hispanic / Latino 74 84.5% Responsible for grandchildren13 15.5% Not responsible for grandchildrenHispanic or Latino 25 57.0% Responsible for grandchildren19 43.0% Not responsible for grandchildren
Grandparents (60 years and over) White / Caucasian 4 100.0% Not responsible for grandchildrenBlack or African American 84 100.0% Not responsible for grandchildrenWhite alone, not Hispanic / Latino 6 100.0% Not responsible for grandchildren