Races in Orono, Maine (ME) Detailed Stats
Data:
Races - White alone (%)
Races - White alone (% change since 2000)
Races - Black alone (%)
Races - Black alone (% change since 2000)
Races - American Indian alone (%)
Races - American Indian alone (% change since 2000)
Races - Asian alone (%)
Races - Asian alone (% change since 2000)
Races - Hispanic (%)
Races - Hispanic (% change since 2000)
Races - Native Hawaiian and Other Pacific Islander alone (%)
Races - Native Hawaiian and Other Pacific Islander alone (% change since 2000)
Races - Two or more races(%)
Races - Two or more races(% change since 2000)
Races - Other race alone (%)
Races - Other race alone (% change since 2000)
Racial diversity
Place of birth - Born in state of residence (%)
Place of birth - Born in state of residence (%) - White
Place of birth - Born in state of residence (%) - Black or African American
Place of birth - Born in state of residence (%) - Asian
Place of birth - Born in state of residence (%) - Hispanic or Latino
Place of birth - Born in state of residence (%) - American Indian and Alaska Native
Place of birth - Born in state of residence (%) - Multirace
Place of birth - Born in state of residence (%) - Other Race
Place of birth - Born in other state (%)
Place of birth - Born in other state (%) - White
Place of birth - Born in other state (%) - Black or African American
Place of birth - Born in other state (%) - Asian
Place of birth - Born in other state (%) - Hispanic or Latino
Place of birth - Born in other state (%) - American Indian and Alaska Native
Place of birth - Born in other state (%) - Multirace
Place of birth - Born in other state (%) - Other Race
Place of birth - Native, outside of US (%)
Place of birth - Native, outside of US (%) - White
Place of birth - Native, outside of US (%) - Black or African American
Place of birth - Native, outside of US (%) - Asian
Place of birth - Native, outside of US (%) - Hispanic or Latino
Place of birth - Native, outside of US (%) - American Indian and Alaska Native
Place of birth - Native, outside of US (%) - Multirace
Place of birth - Native, outside of US (%) - Other Race
Place of birth - Foreign born (%)
Place of birth - Foreign born (%) - White
Place of birth - Foreign born (%) - Black or African American
Place of birth - Foreign born (%) - Asian
Place of birth - Foreign born (%) - Hispanic or Latino
Place of birth - Foreign born (%) - American Indian and Alaska Native
Place of birth - Foreign born (%) - Multirace
Place of birth - Foreign born (%) - Other Race
Residents speaking English at home (%)
Residents speaking English at home - Born in the United States (%)
Residents speaking English at home - Native, born elsewhere (%)
Residents speaking English at home - Foreign born (%)
Residents speaking Spanish at home (%)
Residents speaking Spanish at home - Born in the United States (%)
Residents speaking Spanish at home - Native, born elsewhere (%)
Residents speaking Spanish at home - Foreign born (%)
Residents speaking other language at home (%)
Residents speaking other language at home - Born in the United States (%)
Residents speaking other language at home - Native, born elsewhere (%)
Residents speaking other language at home - Foreign born (%)
Marital status - Never married (%)
Marital status - Now married (%)
Marital status - Separated (%)
Marital status - Widowed (%)
Marital status - Divorced (%)
Ancestries Reported - Arab (%)
Ancestries Reported - Czech (%)
Ancestries Reported - Danish (%)
Ancestries Reported - Dutch (%)
Ancestries Reported - English (%)
Ancestries Reported - French (%)
Ancestries Reported - French Canadian (%)
Ancestries Reported - German (%)
Ancestries Reported - Greek (%)
Ancestries Reported - Hungarian (%)
Ancestries Reported - Irish (%)
Ancestries Reported - Italian (%)
Ancestries Reported - Lithuanian (%)
Ancestries Reported - Norwegian (%)
Ancestries Reported - Polish (%)
Ancestries Reported - Portuguese (%)
Ancestries Reported - Russian (%)
Ancestries Reported - Scotch-Irish (%)
Ancestries Reported - Scottish (%)
Ancestries Reported - Slovak (%)
Ancestries Reported - Subsaharan African (%)
Ancestries Reported - Swedish (%)
Ancestries Reported - Swiss (%)
Ancestries Reported - Ukrainian (%)
Ancestries Reported - United States (%)
Ancestries Reported - Welsh (%)
Ancestries Reported - West Indian (%)
Ancestries Reported - Other (%)
Geographical mobility - Same house 1 year ago (%)
Geographical mobility - Same house 1 year ago (%) - White
Geographical mobility - Same house 1 year ago (%) - Black or African American
Geographical mobility - Same house 1 year ago (%) - Asian
Geographical mobility - Same house 1 year ago (%) - Hispanic or Latino
Geographical mobility - Same house 1 year ago (%) - American Indian and Alaska Native
Geographical mobility - Same house 1 year ago (%) - Multirace
Geographical mobility - Same house 1 year ago (%) - Other Race
Geographical mobility - Moved within same county (%)
Geographical mobility - Moved within same county (%) - White
Geographical mobility - Moved within same county (%) - Black or African American
Geographical mobility - Moved within same county (%) - Asian
Geographical mobility - Moved within same county (%) - Hispanic or Latino
Geographical mobility - Moved within same county (%) - American Indian and Alaska Native
Geographical mobility - Moved within same county (%) - Multirace
Geographical mobility - Moved within same county (%) - Other Race
Geographical mobility - Moved from different county within same state (%)
Geographical mobility - Moved from different county within same state (%) - White
Geographical mobility - Moved from different county within same state (%) - Black or African American
Geographical mobility - Moved from different county within same state (%) - Asian
Geographical mobility - Moved from different county within same state (%) - Hispanic or Latino
Geographical mobility - Moved from different county within same state (%) - American Indian and Alaska Native
Geographical mobility - Moved from different county within same state (%) - Multirace
Geographical mobility - Moved from different county within same state (%) - Other Race
Geographical mobility - Moved from different state (%)
Geographical mobility - Moved from different state (%) - White
Geographical mobility - Moved from different state (%) - Black or African American
Geographical mobility - Moved from different state (%) - Asian
Geographical mobility - Moved from different state (%) - Hispanic or Latino
Geographical mobility - Moved from different state (%) - American Indian and Alaska Native
Geographical mobility - Moved from different state (%) - Multirace
Geographical mobility - Moved from different state (%) - Other Race
Geographical mobility - Moved from abroad (%)
Geographical mobility - Moved from abroad (%) - White
Geographical mobility - Moved from abroad (%) - Black or African American
Geographical mobility - Moved from abroad (%) - Asian
Geographical mobility - Moved from abroad (%) - Hispanic or Latino
Geographical mobility - Moved from abroad (%) - American Indian and Alaska Native
Geographical mobility - Moved from abroad (%) - Multirace
Geographical mobility - Moved from abroad (%) - Other Race
Place of birth for the foreign-born population - Ireland (%)
Place of birth for the foreign-born population - Denmark (%)
Place of birth for the foreign-born population - Norway (%)
Place of birth for the foreign-born population - Sweden (%)
Place of birth for the foreign-born population - United Kingdom (%)
Place of birth for the foreign-born population - England (%)
Place of birth for the foreign-born population - Scotland (%)
Place of birth for the foreign-born population - Other Northern Europe (%)
Place of birth for the foreign-born population - Austria (%)
Place of birth for the foreign-born population - Belgium (%)
Place of birth for the foreign-born population - France (%)
Place of birth for the foreign-born population - Germany (%)
Place of birth for the foreign-born population - Netherlands (%)
Place of birth for the foreign-born population - Switzerland (%)
Place of birth for the foreign-born population - Other Western Europe (%)
Place of birth for the foreign-born population - Greece (%)
Place of birth for the foreign-born population - Italy (%)
Place of birth for the foreign-born population - Portugal (%)
Place of birth for the foreign-born population - Spain (%)
Place of birth for the foreign-born population - Other Southern Europe (%)
Place of birth for the foreign-born population - Albania (%)
Place of birth for the foreign-born population - Belarus (%)
Place of birth for the foreign-born population - Bosnia and Herzegovina (%)
Place of birth for the foreign-born population - Bulgaria (%)
Place of birth for the foreign-born population - Croatia (%)
Place of birth for the foreign-born population - Czechoslovakia (%)
Place of birth for the foreign-born population - Hungary (%)
Place of birth for the foreign-born population - Latvia (%)
Place of birth for the foreign-born population - Lithuania (%)
Place of birth for the foreign-born population - North Macedonia (Macedonia) (%)
Place of birth for the foreign-born population - Moldova (%)
Place of birth for the foreign-born population - Poland (%)
Place of birth for the foreign-born population - Romania (%)
Place of birth for the foreign-born population - Russia (%)
Place of birth for the foreign-born population - Serbia (%)
Place of birth for the foreign-born population - Ukraine (%)
Place of birth for the foreign-born population - Other Eastern Europe (%)
Place of birth for the foreign-born population - China (%)
Place of birth for the foreign-born population - Hong Kong (%)
Place of birth for the foreign-born population - Taiwan (%)
Place of birth for the foreign-born population - Japan (%)
Place of birth for the foreign-born population - Korea (%)
Place of birth for the foreign-born population - Other Eastern Asia (%)
Place of birth for the foreign-born population - Afghanistan (%)
Place of birth for the foreign-born population - Bangladesh (%)
Place of birth for the foreign-born population - India (%)
Place of birth for the foreign-born population - Iran (%)
Place of birth for the foreign-born population - Kazakhstan (%)
Place of birth for the foreign-born population - Nepal (%)
Place of birth for the foreign-born population - Pakistan (%)
Place of birth for the foreign-born population - Sri Lanka (%)
Place of birth for the foreign-born population - Uzbekistan (%)
Place of birth for the foreign-born population - Other South Central Asia (%)
Place of birth for the foreign-born population - Burma (%)
Place of birth for the foreign-born population - Cambodia (%)
Place of birth for the foreign-born population - Indonesia (%)
Place of birth for the foreign-born population - Laos (%)
Place of birth for the foreign-born population - Malaysia (%)
Place of birth for the foreign-born population - Philippines (%)
Place of birth for the foreign-born population - Singapore (%)
Place of birth for the foreign-born population - Thailand (%)
Place of birth for the foreign-born population - Vietnam (%)
Place of birth for the foreign-born population - Other South Eastern Asia (%)
Place of birth for the foreign-born population - Armenia (%)
Place of birth for the foreign-born population - Iraq (%)
Place of birth for the foreign-born population - Israel (%)
Place of birth for the foreign-born population - Jordan (%)
Place of birth for the foreign-born population - Kuwait (%)
Place of birth for the foreign-born population - Lebanon (%)
Place of birth for the foreign-born population - Saudi Arabia (%)
Place of birth for the foreign-born population - Syria (%)
Place of birth for the foreign-born population - Turkey (%)
Place of birth for the foreign-born population - Yemen (%)
Place of birth for the foreign-born population - Other Western Asia (%)
Place of birth for the foreign-born population - Eritrea (%)
Place of birth for the foreign-born population - Ethiopia (%)
Place of birth for the foreign-born population - Kenya (%)
Place of birth for the foreign-born population - Somalia (%)
Place of birth for the foreign-born population - Uganda (%)
Place of birth for the foreign-born population - Zimbabwe (%)
Place of birth for the foreign-born population - Other Eastern Africa (%)
Place of birth for the foreign-born population - Cameroon (%)
Place of birth for the foreign-born population - Congo (%)
Place of birth for the foreign-born population - Democratic Republic of Congo (Zaire) (%)
Place of birth for the foreign-born population - Other Middle Africa (%)
Place of birth for the foreign-born population - Egypt (%)
Place of birth for the foreign-born population - Morocco (%)
Place of birth for the foreign-born population - Sudan (%)
Place of birth for the foreign-born population - Other Northern Africa (%)
Place of birth for the foreign-born population - South Africa (%)
Place of birth for the foreign-born population - Other Southern Africa (%)
Place of birth for the foreign-born population - Cabo Verde (%)
Place of birth for the foreign-born population - Ghana (%)
Place of birth for the foreign-born population - Liberia (%)
Place of birth for the foreign-born population - Nigeria (%)
Place of birth for the foreign-born population - Senegal (%)
Place of birth for the foreign-born population - Sierra Leone (%)
Place of birth for the foreign-born population - Other Western Africa (%)
Place of birth for the foreign-born population - Australia (%)
Place of birth for the foreign-born population - New Zealand (%)
Place of birth for the foreign-born population - Fiji (%)
Place of birth for the foreign-born population - Micronesia (%)
Place of birth for the foreign-born population - Bahamas (%)
Place of birth for the foreign-born population - Barbados (%)
Place of birth for the foreign-born population - Cuba (%)
Place of birth for the foreign-born population - Dominica (%)
Place of birth for the foreign-born population - Dominican Republic (%)
Place of birth for the foreign-born population - Grenada (%)
Place of birth for the foreign-born population - Haiti (%)
Place of birth for the foreign-born population - Jamaica (%)
Place of birth for the foreign-born population - St. Vincent and the Grenadines (%)
Place of birth for the foreign-born population - Trinidad and Tobago (%)
Place of birth for the foreign-born population - West Indies (%)
Place of birth for the foreign-born population - Other Caribbean (%)
Place of birth for the foreign-born population - Belize (%)
Place of birth for the foreign-born population - Costa Rica (%)
Place of birth for the foreign-born population - El Salvador (%)
Place of birth for the foreign-born population - Guatemala (%)
Place of birth for the foreign-born population - Honduras (%)
Place of birth for the foreign-born population - Mexico (%)
Place of birth for the foreign-born population - Nicaragua (%)
Place of birth for the foreign-born population - Panama (%)
Place of birth for the foreign-born population - Other Central America (%)
Place of birth for the foreign-born population - Argentina (%)
Place of birth for the foreign-born population - Bolivia (%)
Place of birth for the foreign-born population - Brazil (%)
Place of birth for the foreign-born population - Chile (%)
Place of birth for the foreign-born population - Colombia (%)
Place of birth for the foreign-born population - Ecuador (%)
Place of birth for the foreign-born population - Guyana (%)
Place of birth for the foreign-born population - Peru (%)
Place of birth for the foreign-born population - Uruguay (%)
Place of birth for the foreign-born population - Venezuela (%)
Place of birth for the foreign-born population - Other South America (%)
Place of birth for the foreign-born population - Canada (%)
Place of birth for the foreign-born population - Other Northern America (%)
Place of birth for the foreign-born population - Other (%)
Latest news about races in Orono, ME collected exclusively by city-data.com from local newspapers, TV, and radio stations
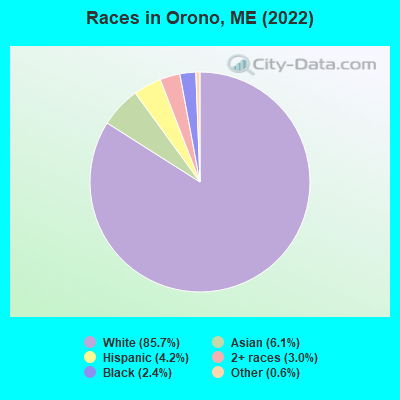
According to 2022 data, the most numerous races in Orono, ME are White alone (8,732 residents), Two or more races (306 residents), and Hispanic (428 residents). 90.0% of Orono residents speak English at home. 7.1% of Orono, ME residents are foreign-born (4.3% born in Asia, 1.7% born in North America), which is 57.6% greater than the foreign-born rate of 3.0% across the entire state of Maine.
Race distribution in Orono
2000 2022
1,230,297 96.5% White alone 11,731 0.9% Two or more races 9,360 0.7% Hispanic 9,014 0.7% Asian alone 6,440 0.5% Black alone 6,911 0.5% American Indian alone 836 0.07% Other race alone 334 0.03% Native Hawaiian and Other
1,249,233 90.2% White alone 58,357 4.2% Two or more races 28,717 2.1% Hispanic 21,583 1.6% Black alone 16,151 1.2% Asian alone 5,873 0.4% Other race alone 5,205 0.4% American Indian alone 221 0.02% Native Hawaiian and Other
Income and house value in Orono Median household income in 2022 $59,235 White non-Hispanic householders$45,021 Asian householdersMedian 2022 house value $240,676 White Non-Hispanic householders $266,242 Asian householders
Median age by race in Orono
21.7 Median age for White residents21.7 21.8 22.4 Median age for Black or African American residents27.7 13.2 -598,240,468.6 Median age for American Indian / Alaska Native residents-561,307,901.3 -595,800,524.3 23.8 Median age for Asian residents40.8 17.2 -661,818,181.2 Median age for Native Hawaiian / Pacific Islander residents-666,666,666.0 -453,900,708.8 21.3 Median age for Other race residents-723,104,055.7 19.7 40.3 Median age for Two or more races residents41.9 40.8 21.7 Median age for White alone residents21.7 21.7 24.5 Median age for Hispanic or Latino residents25.9 22.2
Owner/renter occupied households by race in Orono
House owners and renters - White residents 1,202 45.8% Owner occupied1,423 54.2% Renter occupiedHouse owners and renters - Black or African American residents 7 100.0% Renter occupiedHouse owners and renters - American Indian / Alaska Native residents 31 100.0% Renter occupiedHouse owners and renters - Asian residents 23 14.0% Owner occupied140 86.0% Renter occupiedHouse owners and renters - Two or more races residents 10 3.7% Owner occupied246 96.3% Renter occupiedHouse owners and renters - White alone residents 1,198 45.9% Owner occupied1,413 54.1% Renter occupiedHouse owners and renters - Hispanic or Latino residents 30 100.0% Renter occupied
Language usage in Orono
English speakers - Total 90.0% of residents of Orono speak English at home.
2.1% of residents speak Spanish at home 205 98.6% Speak English very well3 1.4% Speak English less than very well8.7% of residents speak other language at home 620 71.0% Speak English very well253 29.0% Speak English less than very well
English speakers - Born in the United States 95.4% of residents of Orono speak English at home.
3.1% of residents speak Spanish at home 144 98.0% Speak English very well3 2.0% Speak English less than very well2.2% of residents speak other language at home 102 100.0% Speak English very well
English speakers - Native, born elsewhere 62.6% of residents of Orono speak English at home.
5.6% of residents speak Spanish at home 6 100.0% Speak English very well29.9% of residents speak other language at home 32 100.0% Speak English very well
English speakers - Foreign-born 11.2% of residents of Orono speak English at home.
2.2% of residents speak Spanish at home 16 100.0% Speak English very well104.4% of residents speak other language at home 480 62.7% Speak English very well286 37.3% Speak English less than very well
White (Caucasian) - Speak only English Native:
97.8% (8,323)Foreign-born:
30.5% (51)
White (Caucasian) - Speak another language Native:
2.2% (185)Foreign-born:
76.8% (127)
Black or African American - Speak only English Native:
100.0% (182)Foreign-born:
99.9% (49)
Asian - Speak another language Native:
19.6% (38)Foreign-born:
100.0% (298)
Other race - Speak only English Native:
90.5% (99)Foreign-born:
90.6% (14)
Other race - Speak another language Native:
10.1% (11)Foreign-born:
32.9% (5)
Two or more races - Speak another language Native:
22.1% (69)Foreign-born:
94.2% (242)
White alone - Speak only English Native:
97.9% (8,198)Foreign-born:
30.3% (52)
White alone - Speak another language Native:
2.0% (171)Foreign-born:
78.0% (133)
Hispanic or Latino - Speak only English Native:
76.6% (305)Foreign-born:
45.0% (10)
Hispanic or Latino - Speak another language Native:
19.9% (79)Foreign-born:
58.4% (14)
Foreign-born residents in Orono 721 residents are foreign born (4.3% Asia , 1.7% North America ).
Marital status for residents in Orono Marital status - White (Caucasian) population 15 years and over
Males 71.8% Never married20.3% Now married0.0% Separated2.9% Widowed5.0% DivorcedFemales 68.9% Never married18.7% Now married0.0% Separated6.7% Widowed5.7% DivorcedWomen who gave birth in the past 12 months Now married:
100.0% (54)Unmarried:
0.0% (0)
Women who did not give birth in the past 12 months Now married:
8.4% (261)Unmarried:
91.6% (2,838)
Marital status - Black or African American population 15 years and over
Males 100.0% Never married0.0% Now married0.0% Separated0.0% Widowed0.0% DivorcedFemales 100.0% Never married0.0% Now married0.0% Separated0.0% Widowed0.0% DivorcedWomen who did not give birth in the past 12 months Now married:
0.0% (0)Unmarried:
100.0% (70)
Marital status - Asian population 15 years and over
Males 57.8% Never married36.3% Now married0.0% Separated0.0% Widowed5.9% DivorcedFemales 83.2% Never married16.8% Now married0.0% Separated0.0% Widowed0.0% DivorcedWomen who did not give birth in the past 12 months Now married:
17.5% (23)Unmarried:
82.5% (111)
Marital status - Other race population 15 years and over
Males 100.0% Never married0.0% Now married0.0% Separated0.0% Widowed0.0% DivorcedFemales 83.9% Never married16.1% Now married0.0% Separated0.0% Widowed0.0% DivorcedWomen who did not give birth in the past 12 months Now married:
0.0% (0)Unmarried:
100.0% (62)
Marital status - Two or more races population 15 years and over
Males 45.7% Never married47.1% Now married0.0% Separated0.0% Widowed7.1% DivorcedFemales 54.1% Never married24.8% Now married0.0% Separated21.1% Widowed0.0% DivorcedWomen who did not give birth in the past 12 months Now married:
31.4% (85)Unmarried:
68.6% (186)
Marital status - White alone, not Hispanic / Latino population 15 years and over
Males 71.3% Never married20.6% Now married0.0% Separated3.0% Widowed5.1% DivorcedFemales 68.4% Never married19.0% Now married0.0% Separated6.8% Widowed5.8% DivorcedWomen who gave birth in the past 12 months Now married:
100.0% (54)Unmarried:
0.0% (0)
Women who did not give birth in the past 12 months Now married:
8.6% (262)Unmarried:
91.4% (2,792)
Marital status - Hispanic or Latino population 15 years and over
Males 100.0% Never married0.0% Now married0.0% Separated0.0% Widowed0.0% DivorcedFemales 95.1% Never married4.9% Now married0.0% Separated0.0% Widowed0.0% DivorcedWomen who did not give birth in the past 12 months Now married:
0.0% (0)Unmarried:
100.0% (181)
Ancestries in Orono
634 15.1% English460 11.0% Irish313 7.5% American298 7.1% German297 7.1% French213 5.1% Italian197 4.7% French Canadian170 4.1% European140 3.3% Iranian126 3.0% Scottish93 2.2% Polish64 1.5% Serbian55 1.3% Finnish47 1.1% Eastern European39 0.9% African34 0.8% Greek32 0.8% Scandinavian29 0.7% Dutch19 0.5% Swedish16 0.4% Lebanese12 0.3% Turkish11 0.3% British11 0.3% Somali9 0.2% Hungarian8 0.2% Welsh7 0.2% Norwegian5 0.1% Russian4 0.10% Canadian3 0.07% Portuguese
Children Nativity (place of birth) in Orono
Children under 6 years - Living with two parents Both parents native 140 100.0% NativeOne native, one foreign-born parent 48 100.0% NativeChildren under 6 years - Living with one parent Native parent 19 100.0% Native
Children 6 to 17 years - Living with two parents Both parents native 247 100.0% NativeBoth parents foreign-born 5 100.0% NativeChildren 6 to 17 years - Living with one parent Native parent 173 100.0% Native