Races in Orting, Washington (WA) Detailed Stats
Data:
Races - White alone (%)
Races - White alone (% change since 2000)
Races - Black alone (%)
Races - Black alone (% change since 2000)
Races - American Indian alone (%)
Races - American Indian alone (% change since 2000)
Races - Asian alone (%)
Races - Asian alone (% change since 2000)
Races - Hispanic (%)
Races - Hispanic (% change since 2000)
Races - Native Hawaiian and Other Pacific Islander alone (%)
Races - Native Hawaiian and Other Pacific Islander alone (% change since 2000)
Races - Two or more races(%)
Races - Two or more races(% change since 2000)
Races - Other race alone (%)
Races - Other race alone (% change since 2000)
Racial diversity
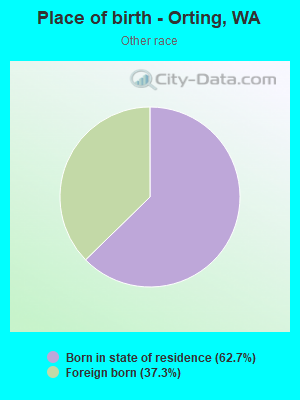
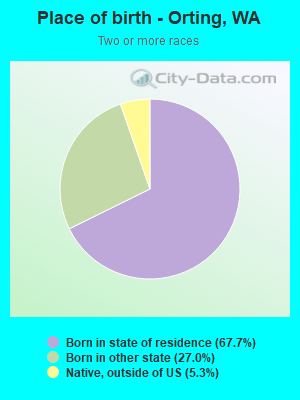
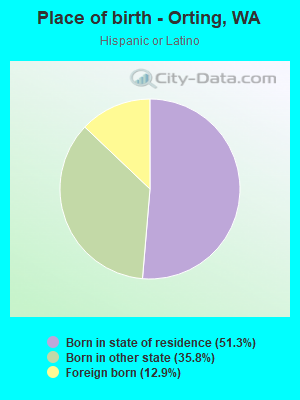
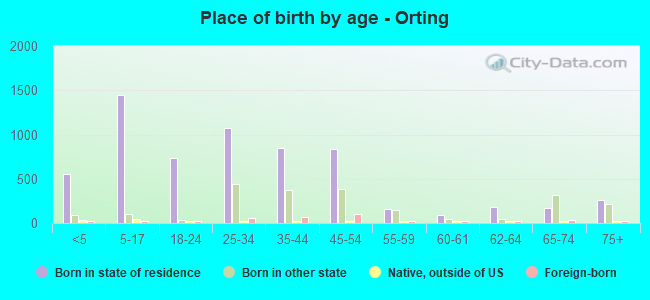
Place of birth - Born in state of residence (%)
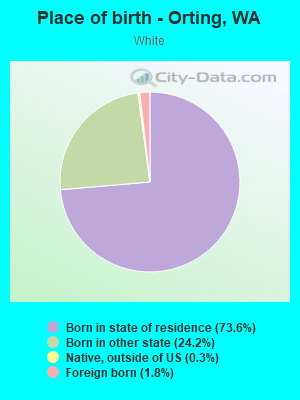
Place of birth - Born in state of residence (%) - White
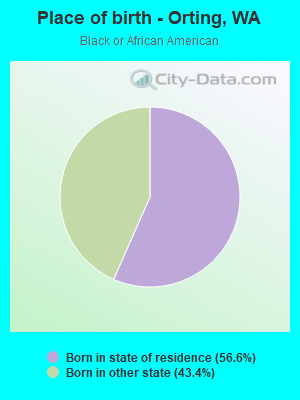
Place of birth - Born in state of residence (%) - Black or African American
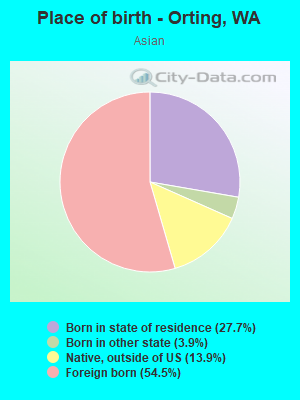
Place of birth - Born in state of residence (%) - Asian
Place of birth - Born in state of residence (%) - Hispanic or Latino
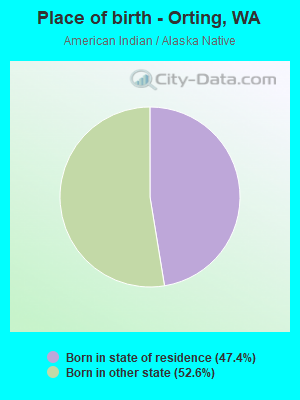
Place of birth - Born in state of residence (%) - American Indian and Alaska Native
Place of birth - Born in state of residence (%) - Multirace
Place of birth - Born in state of residence (%) - Other Race
Place of birth - Born in other state (%)
Place of birth - Born in other state (%) - White
Place of birth - Born in other state (%) - Black or African American
Place of birth - Born in other state (%) - Asian
Place of birth - Born in other state (%) - Hispanic or Latino
Place of birth - Born in other state (%) - American Indian and Alaska Native
Place of birth - Born in other state (%) - Multirace
Place of birth - Born in other state (%) - Other Race
Place of birth - Native, outside of US (%)
Place of birth - Native, outside of US (%) - White
Place of birth - Native, outside of US (%) - Black or African American
Place of birth - Native, outside of US (%) - Asian
Place of birth - Native, outside of US (%) - Hispanic or Latino
Place of birth - Native, outside of US (%) - American Indian and Alaska Native
Place of birth - Native, outside of US (%) - Multirace
Place of birth - Native, outside of US (%) - Other Race
Place of birth - Foreign born (%)
Place of birth - Foreign born (%) - White
Place of birth - Foreign born (%) - Black or African American
Place of birth - Foreign born (%) - Asian
Place of birth - Foreign born (%) - Hispanic or Latino
Place of birth - Foreign born (%) - American Indian and Alaska Native
Place of birth - Foreign born (%) - Multirace
Place of birth - Foreign born (%) - Other Race
Residents speaking English at home (%)
Residents speaking English at home - Born in the United States (%)
Residents speaking English at home - Native, born elsewhere (%)
Residents speaking English at home - Foreign born (%)
Residents speaking Spanish at home (%)
Residents speaking Spanish at home - Born in the United States (%)
Residents speaking Spanish at home - Native, born elsewhere (%)
Residents speaking Spanish at home - Foreign born (%)
Residents speaking other language at home (%)
Residents speaking other language at home - Born in the United States (%)
Residents speaking other language at home - Native, born elsewhere (%)
Residents speaking other language at home - Foreign born (%)
Marital status - Never married (%)
Marital status - Now married (%)
Marital status - Separated (%)
Marital status - Widowed (%)
Marital status - Divorced (%)
Ancestries Reported - Arab (%)
Ancestries Reported - Czech (%)
Ancestries Reported - Danish (%)
Ancestries Reported - Dutch (%)
Ancestries Reported - English (%)
Ancestries Reported - French (%)
Ancestries Reported - French Canadian (%)
Ancestries Reported - German (%)
Ancestries Reported - Greek (%)
Ancestries Reported - Hungarian (%)
Ancestries Reported - Irish (%)
Ancestries Reported - Italian (%)
Ancestries Reported - Lithuanian (%)
Ancestries Reported - Norwegian (%)
Ancestries Reported - Polish (%)
Ancestries Reported - Portuguese (%)
Ancestries Reported - Russian (%)
Ancestries Reported - Scotch-Irish (%)
Ancestries Reported - Scottish (%)
Ancestries Reported - Slovak (%)
Ancestries Reported - Subsaharan African (%)
Ancestries Reported - Swedish (%)
Ancestries Reported - Swiss (%)
Ancestries Reported - Ukrainian (%)
Ancestries Reported - United States (%)
Ancestries Reported - Welsh (%)
Ancestries Reported - West Indian (%)
Ancestries Reported - Other (%)
Geographical mobility - Same house 1 year ago (%)
Geographical mobility - Same house 1 year ago (%) - White
Geographical mobility - Same house 1 year ago (%) - Black or African American
Geographical mobility - Same house 1 year ago (%) - Asian
Geographical mobility - Same house 1 year ago (%) - Hispanic or Latino
Geographical mobility - Same house 1 year ago (%) - American Indian and Alaska Native
Geographical mobility - Same house 1 year ago (%) - Multirace
Geographical mobility - Same house 1 year ago (%) - Other Race
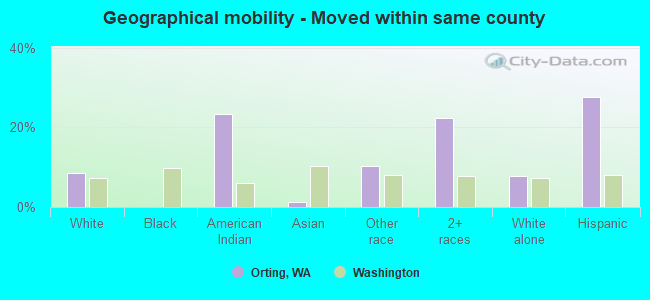
Geographical mobility - Moved within same county (%)
Geographical mobility - Moved within same county (%) - White
Geographical mobility - Moved within same county (%) - Black or African American
Geographical mobility - Moved within same county (%) - Asian
Geographical mobility - Moved within same county (%) - Hispanic or Latino
Geographical mobility - Moved within same county (%) - American Indian and Alaska Native
Geographical mobility - Moved within same county (%) - Multirace
Geographical mobility - Moved within same county (%) - Other Race
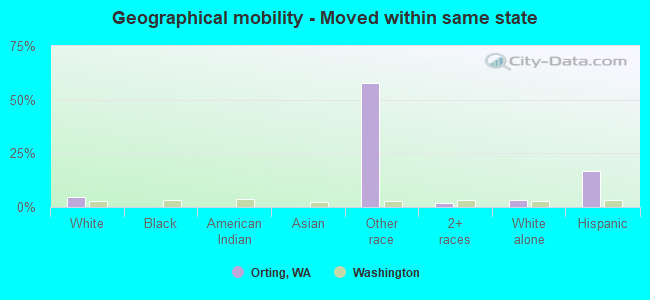
Geographical mobility - Moved from different county within same state (%)
Geographical mobility - Moved from different county within same state (%) - White
Geographical mobility - Moved from different county within same state (%) - Black or African American
Geographical mobility - Moved from different county within same state (%) - Asian
Geographical mobility - Moved from different county within same state (%) - Hispanic or Latino
Geographical mobility - Moved from different county within same state (%) - American Indian and Alaska Native
Geographical mobility - Moved from different county within same state (%) - Multirace
Geographical mobility - Moved from different county within same state (%) - Other Race
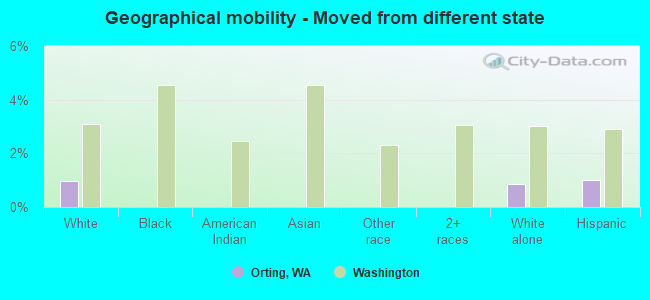
Geographical mobility - Moved from different state (%)
Geographical mobility - Moved from different state (%) - White
Geographical mobility - Moved from different state (%) - Black or African American
Geographical mobility - Moved from different state (%) - Asian
Geographical mobility - Moved from different state (%) - Hispanic or Latino
Geographical mobility - Moved from different state (%) - American Indian and Alaska Native
Geographical mobility - Moved from different state (%) - Multirace
Geographical mobility - Moved from different state (%) - Other Race
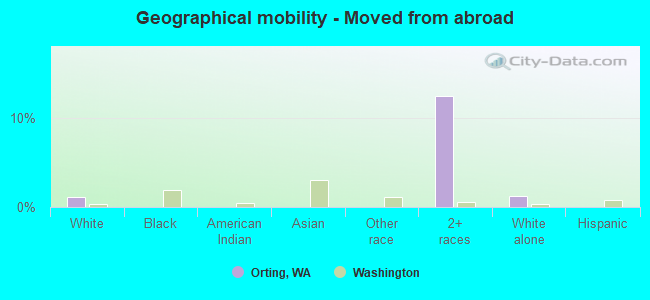
Geographical mobility - Moved from abroad (%)
Geographical mobility - Moved from abroad (%) - White
Geographical mobility - Moved from abroad (%) - Black or African American
Geographical mobility - Moved from abroad (%) - Asian
Geographical mobility - Moved from abroad (%) - Hispanic or Latino
Geographical mobility - Moved from abroad (%) - American Indian and Alaska Native
Geographical mobility - Moved from abroad (%) - Multirace
Geographical mobility - Moved from abroad (%) - Other Race
Place of birth for the foreign-born population - Ireland (%)
Place of birth for the foreign-born population - Denmark (%)
Place of birth for the foreign-born population - Norway (%)
Place of birth for the foreign-born population - Sweden (%)
Place of birth for the foreign-born population - United Kingdom (%)
Place of birth for the foreign-born population - England (%)
Place of birth for the foreign-born population - Scotland (%)
Place of birth for the foreign-born population - Other Northern Europe (%)
Place of birth for the foreign-born population - Austria (%)
Place of birth for the foreign-born population - Belgium (%)
Place of birth for the foreign-born population - France (%)
Place of birth for the foreign-born population - Germany (%)
Place of birth for the foreign-born population - Netherlands (%)
Place of birth for the foreign-born population - Switzerland (%)
Place of birth for the foreign-born population - Other Western Europe (%)
Place of birth for the foreign-born population - Greece (%)
Place of birth for the foreign-born population - Italy (%)
Place of birth for the foreign-born population - Portugal (%)
Place of birth for the foreign-born population - Spain (%)
Place of birth for the foreign-born population - Other Southern Europe (%)
Place of birth for the foreign-born population - Albania (%)
Place of birth for the foreign-born population - Belarus (%)
Place of birth for the foreign-born population - Bosnia and Herzegovina (%)
Place of birth for the foreign-born population - Bulgaria (%)
Place of birth for the foreign-born population - Croatia (%)
Place of birth for the foreign-born population - Czechoslovakia (%)
Place of birth for the foreign-born population - Hungary (%)
Place of birth for the foreign-born population - Latvia (%)
Place of birth for the foreign-born population - Lithuania (%)
Place of birth for the foreign-born population - North Macedonia (Macedonia) (%)
Place of birth for the foreign-born population - Moldova (%)
Place of birth for the foreign-born population - Poland (%)
Place of birth for the foreign-born population - Romania (%)
Place of birth for the foreign-born population - Russia (%)
Place of birth for the foreign-born population - Serbia (%)
Place of birth for the foreign-born population - Ukraine (%)
Place of birth for the foreign-born population - Other Eastern Europe (%)
Place of birth for the foreign-born population - China (%)
Place of birth for the foreign-born population - Hong Kong (%)
Place of birth for the foreign-born population - Taiwan (%)
Place of birth for the foreign-born population - Japan (%)
Place of birth for the foreign-born population - Korea (%)
Place of birth for the foreign-born population - Other Eastern Asia (%)
Place of birth for the foreign-born population - Afghanistan (%)
Place of birth for the foreign-born population - Bangladesh (%)
Place of birth for the foreign-born population - India (%)
Place of birth for the foreign-born population - Iran (%)
Place of birth for the foreign-born population - Kazakhstan (%)
Place of birth for the foreign-born population - Nepal (%)
Place of birth for the foreign-born population - Pakistan (%)
Place of birth for the foreign-born population - Sri Lanka (%)
Place of birth for the foreign-born population - Uzbekistan (%)
Place of birth for the foreign-born population - Other South Central Asia (%)
Place of birth for the foreign-born population - Burma (%)
Place of birth for the foreign-born population - Cambodia (%)
Place of birth for the foreign-born population - Indonesia (%)
Place of birth for the foreign-born population - Laos (%)
Place of birth for the foreign-born population - Malaysia (%)
Place of birth for the foreign-born population - Philippines (%)
Place of birth for the foreign-born population - Singapore (%)
Place of birth for the foreign-born population - Thailand (%)
Place of birth for the foreign-born population - Vietnam (%)
Place of birth for the foreign-born population - Other South Eastern Asia (%)
Place of birth for the foreign-born population - Armenia (%)
Place of birth for the foreign-born population - Iraq (%)
Place of birth for the foreign-born population - Israel (%)
Place of birth for the foreign-born population - Jordan (%)
Place of birth for the foreign-born population - Kuwait (%)
Place of birth for the foreign-born population - Lebanon (%)
Place of birth for the foreign-born population - Saudi Arabia (%)
Place of birth for the foreign-born population - Syria (%)
Place of birth for the foreign-born population - Turkey (%)
Place of birth for the foreign-born population - Yemen (%)
Place of birth for the foreign-born population - Other Western Asia (%)
Place of birth for the foreign-born population - Eritrea (%)
Place of birth for the foreign-born population - Ethiopia (%)
Place of birth for the foreign-born population - Kenya (%)
Place of birth for the foreign-born population - Somalia (%)
Place of birth for the foreign-born population - Uganda (%)
Place of birth for the foreign-born population - Zimbabwe (%)
Place of birth for the foreign-born population - Other Eastern Africa (%)
Place of birth for the foreign-born population - Cameroon (%)
Place of birth for the foreign-born population - Congo (%)
Place of birth for the foreign-born population - Democratic Republic of Congo (Zaire) (%)
Place of birth for the foreign-born population - Other Middle Africa (%)
Place of birth for the foreign-born population - Egypt (%)
Place of birth for the foreign-born population - Morocco (%)
Place of birth for the foreign-born population - Sudan (%)
Place of birth for the foreign-born population - Other Northern Africa (%)
Place of birth for the foreign-born population - South Africa (%)
Place of birth for the foreign-born population - Other Southern Africa (%)
Place of birth for the foreign-born population - Cabo Verde (%)
Place of birth for the foreign-born population - Ghana (%)
Place of birth for the foreign-born population - Liberia (%)
Place of birth for the foreign-born population - Nigeria (%)
Place of birth for the foreign-born population - Senegal (%)
Place of birth for the foreign-born population - Sierra Leone (%)
Place of birth for the foreign-born population - Other Western Africa (%)
Place of birth for the foreign-born population - Australia (%)
Place of birth for the foreign-born population - New Zealand (%)
Place of birth for the foreign-born population - Fiji (%)
Place of birth for the foreign-born population - Micronesia (%)
Place of birth for the foreign-born population - Bahamas (%)
Place of birth for the foreign-born population - Barbados (%)
Place of birth for the foreign-born population - Cuba (%)
Place of birth for the foreign-born population - Dominica (%)
Place of birth for the foreign-born population - Dominican Republic (%)
Place of birth for the foreign-born population - Grenada (%)
Place of birth for the foreign-born population - Haiti (%)
Place of birth for the foreign-born population - Jamaica (%)
Place of birth for the foreign-born population - St. Vincent and the Grenadines (%)
Place of birth for the foreign-born population - Trinidad and Tobago (%)
Place of birth for the foreign-born population - West Indies (%)
Place of birth for the foreign-born population - Other Caribbean (%)
Place of birth for the foreign-born population - Belize (%)
Place of birth for the foreign-born population - Costa Rica (%)
Place of birth for the foreign-born population - El Salvador (%)
Place of birth for the foreign-born population - Guatemala (%)
Place of birth for the foreign-born population - Honduras (%)
Place of birth for the foreign-born population - Mexico (%)
Place of birth for the foreign-born population - Nicaragua (%)
Place of birth for the foreign-born population - Panama (%)
Place of birth for the foreign-born population - Other Central America (%)
Place of birth for the foreign-born population - Argentina (%)
Place of birth for the foreign-born population - Bolivia (%)
Place of birth for the foreign-born population - Brazil (%)
Place of birth for the foreign-born population - Chile (%)
Place of birth for the foreign-born population - Colombia (%)
Place of birth for the foreign-born population - Ecuador (%)
Place of birth for the foreign-born population - Guyana (%)
Place of birth for the foreign-born population - Peru (%)
Place of birth for the foreign-born population - Uruguay (%)
Place of birth for the foreign-born population - Venezuela (%)
Place of birth for the foreign-born population - Other South America (%)
Place of birth for the foreign-born population - Canada (%)
Place of birth for the foreign-born population - Other Northern America (%)
Place of birth for the foreign-born population - Other (%)
Latest news about races in Orting, WA collected exclusively by city-data.com from local newspapers, TV, and radio stations
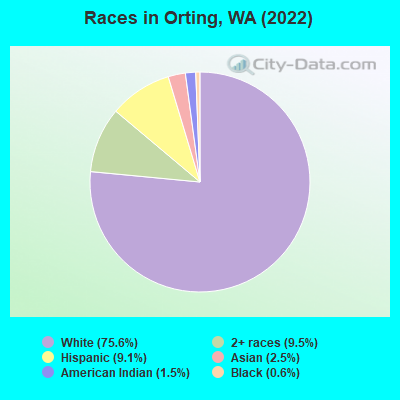
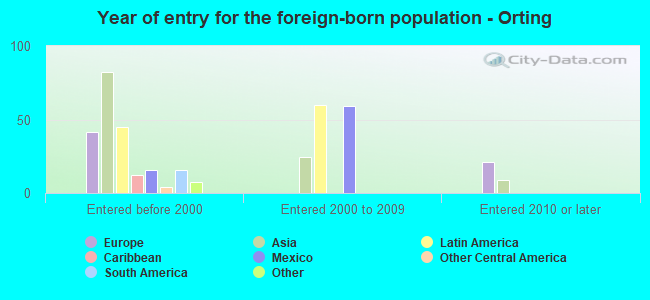
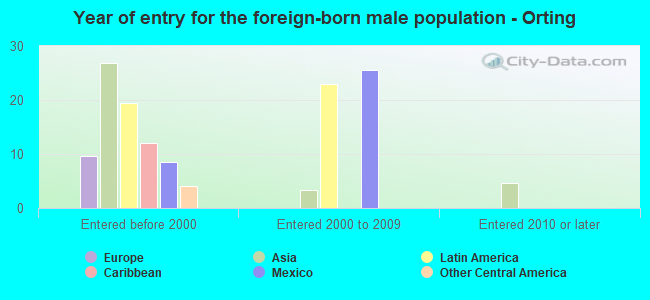
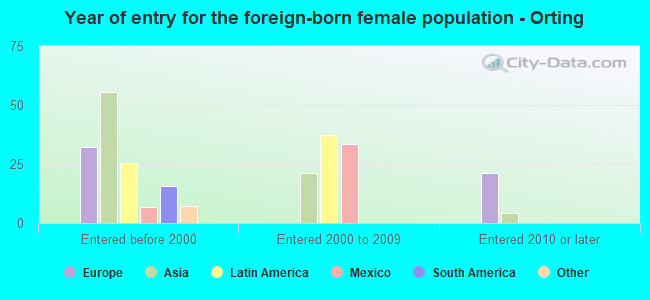
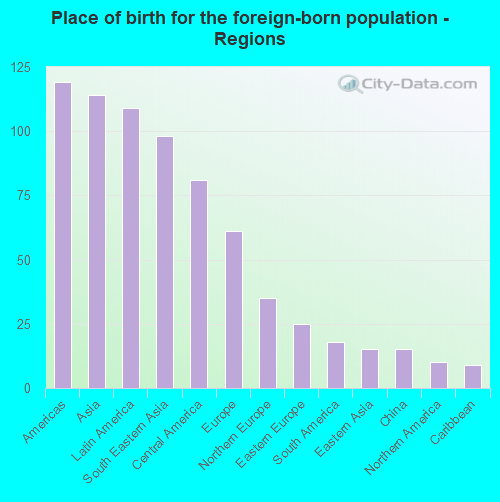
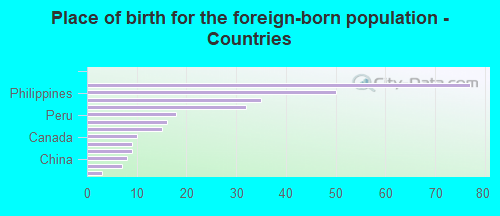
According to 2022 data, the most numerous races in Orting, WA are White alone (6,788 residents), Hispanic (818 residents), and Asian alone (227 residents). 92.3% of Orting residents speak English at home. 3.3% of Orting, WA residents are foreign-born (1.2% born in Asia, 1.2% born in Latin America, 0.7% born in Europe), which is 356.6% less than the foreign-born rate of 15.0% across the entire state of Washington.
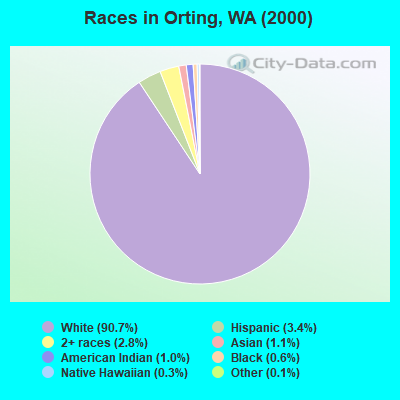
Race distribution in Orting
2000 2022
4,652,490 78.9% White alone 441,509 7.5% Hispanic 319,401 5.4% Asian alone 184,631 3.1% Black alone 175,926 3.0% Two or more races 85,396 1.4% American Indian alone 22,779 0.4% Native Hawaiian and Other 11,989 0.2% Other race alone
4,941,456 63.5% White alone 1,093,313 14.0% Hispanic 755,832 9.7% Asian alone 523,448 6.7% Two or more races 299,537 3.8% Black alone 69,024 0.9% American Indian alone 52,231 0.7% Native Hawaiian and Other 50,945 0.7% Other race alone
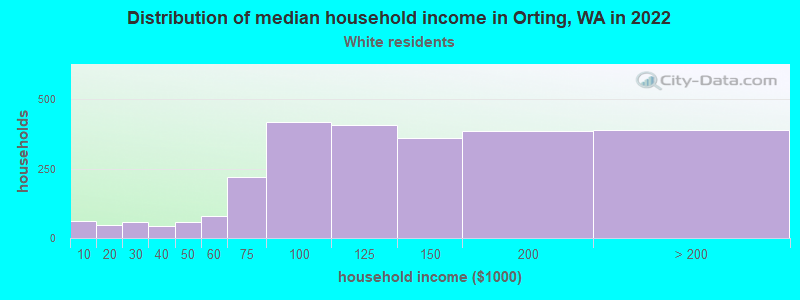
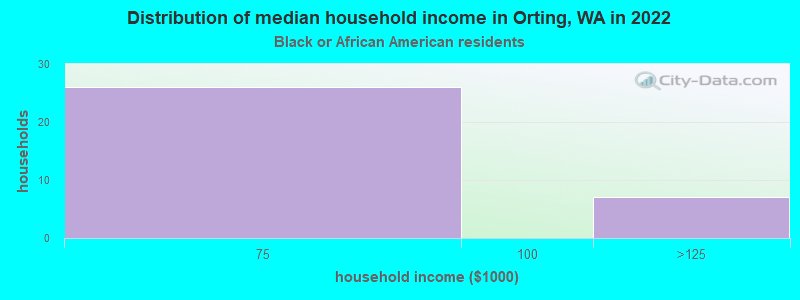
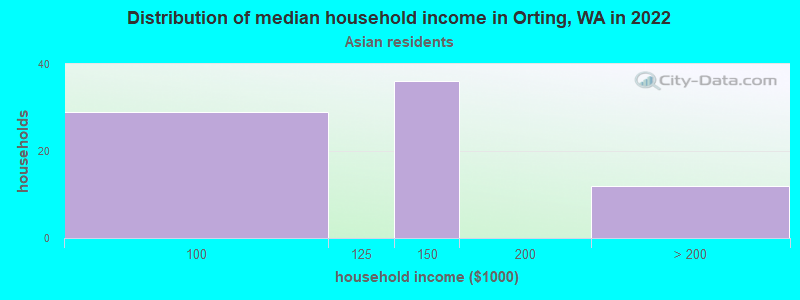
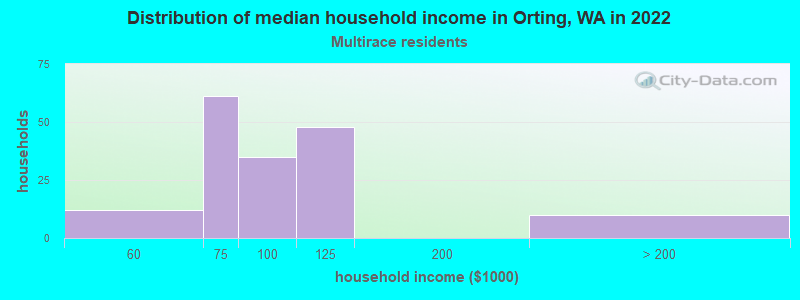
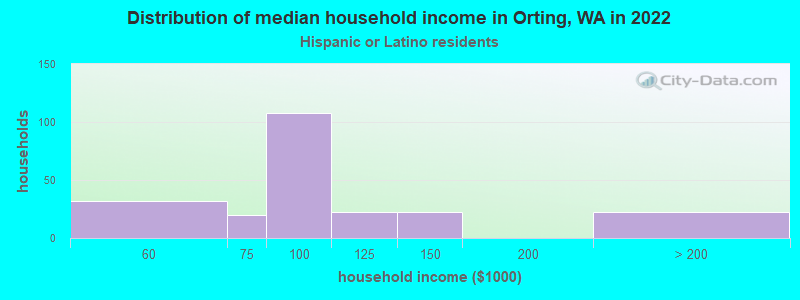
Income and house value in Orting Median household income in 2022 $125,795 White non-Hispanic householders$133,018 Asian householders$91,901 Two or more races householders$89,052 Hispanic or Latino race householdersMedian 2022 house value $518,525 White Non-Hispanic householders$322,183 Black or African American householders$521,178 American Indian or Alaska Native householders $296,787 Asian householders$428,693 Two or more races householders$521,178 Hispanic or Latino householders
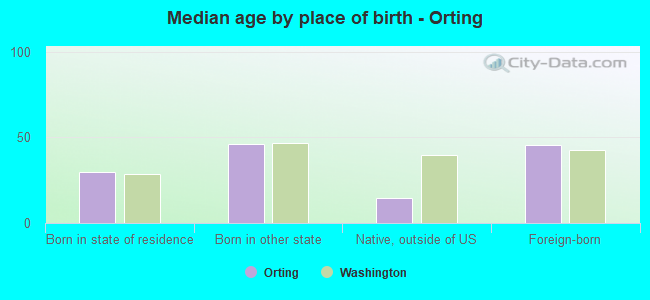
Median age by race in Orting
36.1 Median age for White residents36.8 35.9 35.2 Median age for Black or African American residents34.1 -716,122,650.1 21.5 Median age for American Indian / Alaska Native residents24.4 33.8 46.8 Median age for Asian residents36.1 50.7 -683,229,813.0 Median age for Native Hawaiian / Pacific Islander residents-736,612,021.1 -634,538,152.0 25.5 Median age for Other race residents23.8 42.0 17.5 Median age for Two or more races residents13.7 19.3 36.4 Median age for White alone residents35.8 37.3 25.0 Median age for Hispanic or Latino residents26.6 18.1
Owner/renter occupied households by race in Orting
House owners and renters - White residents 1,969 77.8% Owner occupied561 22.2% Renter occupiedHouse owners and renters - Black or African American residents 30 100.0% Owner occupiedHouse owners and renters - American Indian / Alaska Native residents 29 100.0% Owner occupiedHouse owners and renters - Asian residents 75 100.0% Owner occupiedHouse owners and renters - Other race residents 13 100.0% Owner occupiedHouse owners and renters - Two or more races residents 145 79.0% Owner occupied39 21.0% Renter occupiedHouse owners and renters - White alone residents 1,863 79.0% Owner occupied494 21.0% Renter occupiedHouse owners and renters - Hispanic or Latino residents 175 68.7% Owner occupied80 31.3% Renter occupied
Language usage in Orting
English speakers - Total 92.3% of residents of Orting speak English at home.
4.6% of residents speak Spanish at home 275 72.4% Speak English very well105 27.6% Speak English less than very well2.5% of residents speak other language at home 172 83.1% Speak English very well35 16.9% Speak English less than very well
English speakers - Born in the United States 92.8% of residents of Orting speak English at home.
6.2% of residents speak Spanish at home 130 100.0% Speak English very well0.9% of residents speak other language at home 18 100.0% Speak English very well
English speakers - Native, born elsewhere 73.3% of residents of Orting speak English at home.
31.7% of residents speak other language at home 19 100.0% Speak English very well
English speakers - Foreign-born 25.3% of residents of Orting speak English at home.
28.3% of residents speak Spanish at home 11 12.8% Speak English very well75 87.2% Speak English less than very well43.8% of residents speak other language at home 98 73.7% Speak English very well35 26.3% Speak English less than very well
White (Caucasian) - Speak only English Native:
97.8% (6,282)Foreign-born:
29.5% (37)
White (Caucasian) - Speak another language Native:
2.4% (152)Foreign-born:
70.5% (88)
Asian - Speak only English Native:
89.5% (99)Foreign-born:
19.0% (22)
Asian - Speak another language Native:
14.0% (15)Foreign-born:
80.5% (94)
Other race - Speak another language Native:
97.9% (51)Foreign-born:
56.6% (18)
White alone - Speak only English Native:
98.9% (6,162)Foreign-born:
49.2% (39)
White alone - Speak another language Native:
1.3% (83)Foreign-born:
43.7% (35)
Hispanic or Latino - Speak only English Native:
56.4% (324)Foreign-born:
14.5% (16)
Hispanic or Latino - Speak another language Native:
42.7% (246)Foreign-born:
83.9% (90)
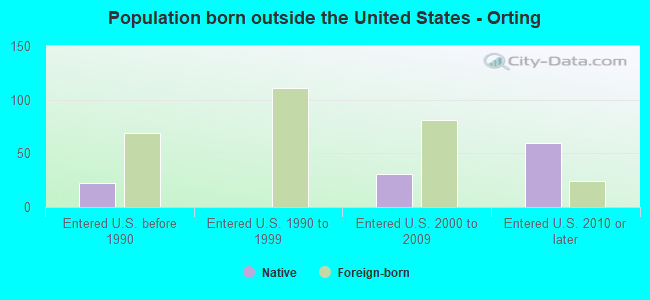
Foreign-born residents in Orting 295 residents are foreign born (1.2% Asia , 1.2% Latin America , 0.7% Europe ).
This city:
3.3%Washington:
14.9%
Marital status for residents in Orting Marital status - White (Caucasian) population 15 years and over
Males 33.6% Never married55.3% Now married1.5% Separated1.9% Widowed7.7% DivorcedFemales 31.6% Never married49.2% Now married0.8% Separated7.6% Widowed10.8% DivorcedWomen who gave birth in the past 12 months Now married:
100.0% (53)Unmarried:
0.0% (0)
Women who did not give birth in the past 12 months Now married:
44.1% (766)Unmarried:
55.9% (970)
Marital status - Black or African American population 15 years and over
Males 100.0% Never married0.0% Now married0.0% Separated0.0% Widowed0.0% DivorcedFemales 72.4% Never married27.6% Now married0.0% Separated0.0% Widowed0.0% DivorcedWomen who did not give birth in the past 12 months Now married:
100.0% (8)Unmarried:
0.0% (0)
Marital status - American Indian / Alaska Native population 15 years and over
Males 79.8% Never married17.3% Now married0.0% Separated0.0% Widowed2.9% DivorcedFemales 27.1% Never married28.6% Now married0.0% Separated0.0% Widowed44.3% DivorcedWomen who did not give birth in the past 12 months Now married:
0.0% (0)Unmarried:
100.0% (49)
Marital status - Asian population 15 years and over
Males 18.7% Never married81.3% Now married0.0% Separated0.0% Widowed0.0% DivorcedFemales 17.7% Never married72.9% Now married0.0% Separated9.4% Widowed0.0% DivorcedWomen who gave birth in the past 12 months Now married:
100.0% (3)Unmarried:
0.0% (0)
Women who did not give birth in the past 12 months Now married:
69.1% (40)Unmarried:
30.9% (18)
Marital status - Other race population 15 years and over
Males 0.0% Never married65.5% Now married34.5% Separated0.0% Widowed0.0% DivorcedFemales 25.6% Never married74.4% Now married0.0% Separated0.0% Widowed0.0% DivorcedWomen who did not give birth in the past 12 months Now married:
74.4% (35)Unmarried:
25.6% (12)
Marital status - Two or more races population 15 years and over
Males 68.1% Never married31.9% Now married0.0% Separated0.0% Widowed0.0% DivorcedFemales 29.6% Never married65.1% Now married0.0% Separated0.0% Widowed5.4% DivorcedWomen who gave birth in the past 12 months Now married:
100.0% (45)Unmarried:
0.0% (0)
Women who did not give birth in the past 12 months Now married:
58.1% (213)Unmarried:
41.9% (154)
Marital status - White alone, not Hispanic / Latino population 15 years and over
Males 33.6% Never married54.7% Now married1.6% Separated2.0% Widowed8.1% DivorcedFemales 29.6% Never married50.3% Now married0.9% Separated8.0% Widowed11.3% DivorcedWomen who gave birth in the past 12 months Now married:
100.0% (54)Unmarried:
0.0% (0)
Women who did not give birth in the past 12 months Now married:
46.0% (767)Unmarried:
54.0% (900)
Marital status - Hispanic or Latino population 15 years and over
Males 46.3% Never married50.3% Now married3.4% Separated0.0% Widowed0.0% DivorcedFemales 65.7% Never married34.3% Now married0.0% Separated0.0% Widowed0.0% DivorcedWomen who did not give birth in the past 12 months Now married:
29.0% (63)Unmarried:
71.0% (154)
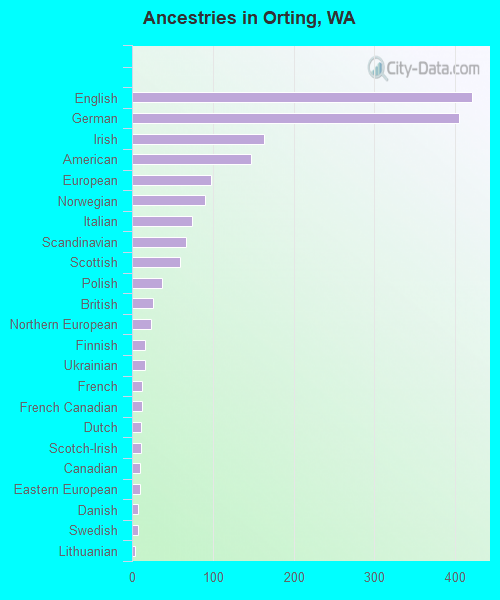
Ancestries in Orting
421 15.6% English405 15.0% German163 6.0% Irish147 5.4% American98 3.6% European90 3.3% Norwegian74 2.7% Italian67 2.5% Scandinavian59 2.2% Scottish37 1.4% Polish26 1.0% British23 0.9% Northern European16 0.6% Finnish16 0.6% Ukrainian13 0.5% French13 0.5% French Canadian11 0.4% Dutch11 0.4% Scotch-Irish10 0.4% Canadian10 0.4% Eastern European8 0.3% Danish7 0.3% Swedish4 0.1% Lithuanian
Children Nativity (place of birth) in Orting
Children under 6 years - Living with two parents Both parents native 387 100.0% NativeOne native, one foreign-born parent 16 100.0% NativeChildren under 6 years - Living with one parent Native parent 414 100.0% NativeForeign-born parent 28 100.0% NativeChildren 6 to 17 years - Living with two parents Both parents native 691 100.0% NativeBoth parents foreign-born 46 100.0% NativeOne native, one foreign-born parent 78 100.0% NativeChildren 6 to 17 years - Living with one parent Native parent 496 100.0% NativeForeign-born parent 26 49.7% Native26 50.3% Foreign-born
Grandparents responsible for own grandchildren in Orting
Grandparents (30 to 59 years) White / Caucasian 53 45.4% Responsible for grandchildren64 54.6% Not responsible for grandchildrenOther race 6 34.3% Responsible for grandchildren11 65.7% Not responsible for grandchildrenWhite alone, not Hispanic / Latino 47 41.4% Responsible for grandchildren66 58.6% Not responsible for grandchildrenHispanic or Latino 11 46.2% Responsible for grandchildren13 53.8% Not responsible for grandchildren
Grandparents (60 years and over) White / Caucasian 3 3.1% Responsible for grandchildren100 96.9% Not responsible for grandchildrenWhite alone, not Hispanic / Latino 3 3.2% Responsible for grandchildren101 96.8% Not responsible for grandchildren