Races in Owasso, Oklahoma (OK) Detailed Stats
Data:
Races - White alone (%)
Races - White alone (% change since 2000)
Races - Black alone (%)
Races - Black alone (% change since 2000)
Races - American Indian alone (%)
Races - American Indian alone (% change since 2000)
Races - Asian alone (%)
Races - Asian alone (% change since 2000)
Races - Hispanic (%)
Races - Hispanic (% change since 2000)
Races - Native Hawaiian and Other Pacific Islander alone (%)
Races - Native Hawaiian and Other Pacific Islander alone (% change since 2000)
Races - Two or more races(%)
Races - Two or more races(% change since 2000)
Races - Other race alone (%)
Races - Other race alone (% change since 2000)
Racial diversity
Place of birth - Born in state of residence (%)
Place of birth - Born in state of residence (%) - White
Place of birth - Born in state of residence (%) - Black or African American
Place of birth - Born in state of residence (%) - Asian
Place of birth - Born in state of residence (%) - Hispanic or Latino
Place of birth - Born in state of residence (%) - American Indian and Alaska Native
Place of birth - Born in state of residence (%) - Multirace
Place of birth - Born in state of residence (%) - Other Race
Place of birth - Born in other state (%)
Place of birth - Born in other state (%) - White
Place of birth - Born in other state (%) - Black or African American
Place of birth - Born in other state (%) - Asian
Place of birth - Born in other state (%) - Hispanic or Latino
Place of birth - Born in other state (%) - American Indian and Alaska Native
Place of birth - Born in other state (%) - Multirace
Place of birth - Born in other state (%) - Other Race
Place of birth - Native, outside of US (%)
Place of birth - Native, outside of US (%) - White
Place of birth - Native, outside of US (%) - Black or African American
Place of birth - Native, outside of US (%) - Asian
Place of birth - Native, outside of US (%) - Hispanic or Latino
Place of birth - Native, outside of US (%) - American Indian and Alaska Native
Place of birth - Native, outside of US (%) - Multirace
Place of birth - Native, outside of US (%) - Other Race
Place of birth - Foreign born (%)
Place of birth - Foreign born (%) - White
Place of birth - Foreign born (%) - Black or African American
Place of birth - Foreign born (%) - Asian
Place of birth - Foreign born (%) - Hispanic or Latino
Place of birth - Foreign born (%) - American Indian and Alaska Native
Place of birth - Foreign born (%) - Multirace
Place of birth - Foreign born (%) - Other Race
Residents speaking English at home (%)
Residents speaking English at home - Born in the United States (%)
Residents speaking English at home - Native, born elsewhere (%)
Residents speaking English at home - Foreign born (%)
Residents speaking Spanish at home (%)
Residents speaking Spanish at home - Born in the United States (%)
Residents speaking Spanish at home - Native, born elsewhere (%)
Residents speaking Spanish at home - Foreign born (%)
Residents speaking other language at home (%)
Residents speaking other language at home - Born in the United States (%)
Residents speaking other language at home - Native, born elsewhere (%)
Residents speaking other language at home - Foreign born (%)
Marital status - Never married (%)
Marital status - Now married (%)
Marital status - Separated (%)
Marital status - Widowed (%)
Marital status - Divorced (%)
Ancestries Reported - Arab (%)
Ancestries Reported - Czech (%)
Ancestries Reported - Danish (%)
Ancestries Reported - Dutch (%)
Ancestries Reported - English (%)
Ancestries Reported - French (%)
Ancestries Reported - French Canadian (%)
Ancestries Reported - German (%)
Ancestries Reported - Greek (%)
Ancestries Reported - Hungarian (%)
Ancestries Reported - Irish (%)
Ancestries Reported - Italian (%)
Ancestries Reported - Lithuanian (%)
Ancestries Reported - Norwegian (%)
Ancestries Reported - Polish (%)
Ancestries Reported - Portuguese (%)
Ancestries Reported - Russian (%)
Ancestries Reported - Scotch-Irish (%)
Ancestries Reported - Scottish (%)
Ancestries Reported - Slovak (%)
Ancestries Reported - Subsaharan African (%)
Ancestries Reported - Swedish (%)
Ancestries Reported - Swiss (%)
Ancestries Reported - Ukrainian (%)
Ancestries Reported - United States (%)
Ancestries Reported - Welsh (%)
Ancestries Reported - West Indian (%)
Ancestries Reported - Other (%)
Geographical mobility - Same house 1 year ago (%)
Geographical mobility - Same house 1 year ago (%) - White
Geographical mobility - Same house 1 year ago (%) - Black or African American
Geographical mobility - Same house 1 year ago (%) - Asian
Geographical mobility - Same house 1 year ago (%) - Hispanic or Latino
Geographical mobility - Same house 1 year ago (%) - American Indian and Alaska Native
Geographical mobility - Same house 1 year ago (%) - Multirace
Geographical mobility - Same house 1 year ago (%) - Other Race
Geographical mobility - Moved within same county (%)
Geographical mobility - Moved within same county (%) - White
Geographical mobility - Moved within same county (%) - Black or African American
Geographical mobility - Moved within same county (%) - Asian
Geographical mobility - Moved within same county (%) - Hispanic or Latino
Geographical mobility - Moved within same county (%) - American Indian and Alaska Native
Geographical mobility - Moved within same county (%) - Multirace
Geographical mobility - Moved within same county (%) - Other Race
Geographical mobility - Moved from different county within same state (%)
Geographical mobility - Moved from different county within same state (%) - White
Geographical mobility - Moved from different county within same state (%) - Black or African American
Geographical mobility - Moved from different county within same state (%) - Asian
Geographical mobility - Moved from different county within same state (%) - Hispanic or Latino
Geographical mobility - Moved from different county within same state (%) - American Indian and Alaska Native
Geographical mobility - Moved from different county within same state (%) - Multirace
Geographical mobility - Moved from different county within same state (%) - Other Race
Geographical mobility - Moved from different state (%)
Geographical mobility - Moved from different state (%) - White
Geographical mobility - Moved from different state (%) - Black or African American
Geographical mobility - Moved from different state (%) - Asian
Geographical mobility - Moved from different state (%) - Hispanic or Latino
Geographical mobility - Moved from different state (%) - American Indian and Alaska Native
Geographical mobility - Moved from different state (%) - Multirace
Geographical mobility - Moved from different state (%) - Other Race
Geographical mobility - Moved from abroad (%)
Geographical mobility - Moved from abroad (%) - White
Geographical mobility - Moved from abroad (%) - Black or African American
Geographical mobility - Moved from abroad (%) - Asian
Geographical mobility - Moved from abroad (%) - Hispanic or Latino
Geographical mobility - Moved from abroad (%) - American Indian and Alaska Native
Geographical mobility - Moved from abroad (%) - Multirace
Geographical mobility - Moved from abroad (%) - Other Race
Place of birth for the foreign-born population - Ireland (%)
Place of birth for the foreign-born population - Denmark (%)
Place of birth for the foreign-born population - Norway (%)
Place of birth for the foreign-born population - Sweden (%)
Place of birth for the foreign-born population - United Kingdom (%)
Place of birth for the foreign-born population - England (%)
Place of birth for the foreign-born population - Scotland (%)
Place of birth for the foreign-born population - Other Northern Europe (%)
Place of birth for the foreign-born population - Austria (%)
Place of birth for the foreign-born population - Belgium (%)
Place of birth for the foreign-born population - France (%)
Place of birth for the foreign-born population - Germany (%)
Place of birth for the foreign-born population - Netherlands (%)
Place of birth for the foreign-born population - Switzerland (%)
Place of birth for the foreign-born population - Other Western Europe (%)
Place of birth for the foreign-born population - Greece (%)
Place of birth for the foreign-born population - Italy (%)
Place of birth for the foreign-born population - Portugal (%)
Place of birth for the foreign-born population - Spain (%)
Place of birth for the foreign-born population - Other Southern Europe (%)
Place of birth for the foreign-born population - Albania (%)
Place of birth for the foreign-born population - Belarus (%)
Place of birth for the foreign-born population - Bosnia and Herzegovina (%)
Place of birth for the foreign-born population - Bulgaria (%)
Place of birth for the foreign-born population - Croatia (%)
Place of birth for the foreign-born population - Czechoslovakia (%)
Place of birth for the foreign-born population - Hungary (%)
Place of birth for the foreign-born population - Latvia (%)
Place of birth for the foreign-born population - Lithuania (%)
Place of birth for the foreign-born population - North Macedonia (Macedonia) (%)
Place of birth for the foreign-born population - Moldova (%)
Place of birth for the foreign-born population - Poland (%)
Place of birth for the foreign-born population - Romania (%)
Place of birth for the foreign-born population - Russia (%)
Place of birth for the foreign-born population - Serbia (%)
Place of birth for the foreign-born population - Ukraine (%)
Place of birth for the foreign-born population - Other Eastern Europe (%)
Place of birth for the foreign-born population - China (%)
Place of birth for the foreign-born population - Hong Kong (%)
Place of birth for the foreign-born population - Taiwan (%)
Place of birth for the foreign-born population - Japan (%)
Place of birth for the foreign-born population - Korea (%)
Place of birth for the foreign-born population - Other Eastern Asia (%)
Place of birth for the foreign-born population - Afghanistan (%)
Place of birth for the foreign-born population - Bangladesh (%)
Place of birth for the foreign-born population - India (%)
Place of birth for the foreign-born population - Iran (%)
Place of birth for the foreign-born population - Kazakhstan (%)
Place of birth for the foreign-born population - Nepal (%)
Place of birth for the foreign-born population - Pakistan (%)
Place of birth for the foreign-born population - Sri Lanka (%)
Place of birth for the foreign-born population - Uzbekistan (%)
Place of birth for the foreign-born population - Other South Central Asia (%)
Place of birth for the foreign-born population - Burma (%)
Place of birth for the foreign-born population - Cambodia (%)
Place of birth for the foreign-born population - Indonesia (%)
Place of birth for the foreign-born population - Laos (%)
Place of birth for the foreign-born population - Malaysia (%)
Place of birth for the foreign-born population - Philippines (%)
Place of birth for the foreign-born population - Singapore (%)
Place of birth for the foreign-born population - Thailand (%)
Place of birth for the foreign-born population - Vietnam (%)
Place of birth for the foreign-born population - Other South Eastern Asia (%)
Place of birth for the foreign-born population - Armenia (%)
Place of birth for the foreign-born population - Iraq (%)
Place of birth for the foreign-born population - Israel (%)
Place of birth for the foreign-born population - Jordan (%)
Place of birth for the foreign-born population - Kuwait (%)
Place of birth for the foreign-born population - Lebanon (%)
Place of birth for the foreign-born population - Saudi Arabia (%)
Place of birth for the foreign-born population - Syria (%)
Place of birth for the foreign-born population - Turkey (%)
Place of birth for the foreign-born population - Yemen (%)
Place of birth for the foreign-born population - Other Western Asia (%)
Place of birth for the foreign-born population - Eritrea (%)
Place of birth for the foreign-born population - Ethiopia (%)
Place of birth for the foreign-born population - Kenya (%)
Place of birth for the foreign-born population - Somalia (%)
Place of birth for the foreign-born population - Uganda (%)
Place of birth for the foreign-born population - Zimbabwe (%)
Place of birth for the foreign-born population - Other Eastern Africa (%)
Place of birth for the foreign-born population - Cameroon (%)
Place of birth for the foreign-born population - Congo (%)
Place of birth for the foreign-born population - Democratic Republic of Congo (Zaire) (%)
Place of birth for the foreign-born population - Other Middle Africa (%)
Place of birth for the foreign-born population - Egypt (%)
Place of birth for the foreign-born population - Morocco (%)
Place of birth for the foreign-born population - Sudan (%)
Place of birth for the foreign-born population - Other Northern Africa (%)
Place of birth for the foreign-born population - South Africa (%)
Place of birth for the foreign-born population - Other Southern Africa (%)
Place of birth for the foreign-born population - Cabo Verde (%)
Place of birth for the foreign-born population - Ghana (%)
Place of birth for the foreign-born population - Liberia (%)
Place of birth for the foreign-born population - Nigeria (%)
Place of birth for the foreign-born population - Senegal (%)
Place of birth for the foreign-born population - Sierra Leone (%)
Place of birth for the foreign-born population - Other Western Africa (%)
Place of birth for the foreign-born population - Australia (%)
Place of birth for the foreign-born population - New Zealand (%)
Place of birth for the foreign-born population - Fiji (%)
Place of birth for the foreign-born population - Micronesia (%)
Place of birth for the foreign-born population - Bahamas (%)
Place of birth for the foreign-born population - Barbados (%)
Place of birth for the foreign-born population - Cuba (%)
Place of birth for the foreign-born population - Dominica (%)
Place of birth for the foreign-born population - Dominican Republic (%)
Place of birth for the foreign-born population - Grenada (%)
Place of birth for the foreign-born population - Haiti (%)
Place of birth for the foreign-born population - Jamaica (%)
Place of birth for the foreign-born population - St. Vincent and the Grenadines (%)
Place of birth for the foreign-born population - Trinidad and Tobago (%)
Place of birth for the foreign-born population - West Indies (%)
Place of birth for the foreign-born population - Other Caribbean (%)
Place of birth for the foreign-born population - Belize (%)
Place of birth for the foreign-born population - Costa Rica (%)
Place of birth for the foreign-born population - El Salvador (%)
Place of birth for the foreign-born population - Guatemala (%)
Place of birth for the foreign-born population - Honduras (%)
Place of birth for the foreign-born population - Mexico (%)
Place of birth for the foreign-born population - Nicaragua (%)
Place of birth for the foreign-born population - Panama (%)
Place of birth for the foreign-born population - Other Central America (%)
Place of birth for the foreign-born population - Argentina (%)
Place of birth for the foreign-born population - Bolivia (%)
Place of birth for the foreign-born population - Brazil (%)
Place of birth for the foreign-born population - Chile (%)
Place of birth for the foreign-born population - Colombia (%)
Place of birth for the foreign-born population - Ecuador (%)
Place of birth for the foreign-born population - Guyana (%)
Place of birth for the foreign-born population - Peru (%)
Place of birth for the foreign-born population - Uruguay (%)
Place of birth for the foreign-born population - Venezuela (%)
Place of birth for the foreign-born population - Other South America (%)
Place of birth for the foreign-born population - Canada (%)
Place of birth for the foreign-born population - Other Northern America (%)
Place of birth for the foreign-born population - Other (%)
Latest news about races in Owasso, OK collected exclusively by city-data.com from local newspapers, TV, and radio stations
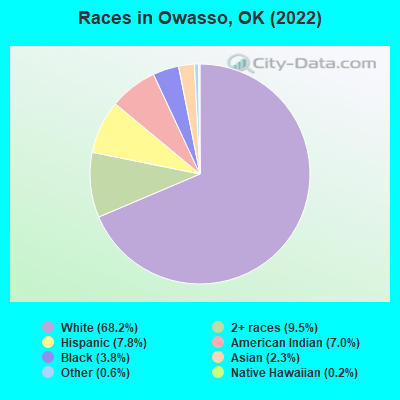
According to 2022 data, the most numerous races in Owasso, OK are White alone (26,336 residents), Hispanic (3,009 residents), and Two or more races (3,672 residents). 92.4% of Owasso residents speak English at home. 3.9% of Owasso, OK residents are foreign-born (2.0% born in Latin America, 1.2% born in Asia, 0.4% born in Europe), which is 52.2% less than the foreign-born rate of 6.0% across the entire state of Oklahoma.
Race distribution in Owasso
2000 2022
2,556,368 74.1% White alone 266,158 7.7% American Indian alone 257,981 7.5% Black alone 179,304 5.2% Hispanic 140,249 4.1% Two or more races 46,172 1.3% Asian alone 2,322 0.07% Other race alone 2,100 0.06% Native Hawaiian and Other
2,517,403 62.6% White alone 486,692 12.1% Hispanic 364,453 9.1% Two or more races 273,650 6.8% American Indian alone 268,543 6.7% Black alone 92,672 2.3% Asian alone 10,786 0.3% Other race alone 5,601 0.1% Native Hawaiian and Other
Income and house value in Owasso Median household income in 2022 $73,103 White non-Hispanic householders$99,376 Black householders$82,378 American Indian and Alaska Native householders$61,335 Asian householders$90,870 Some other race householders$83,240 Two or more races householders$81,444 Hispanic or Latino race householdersMedian 2022 house value $251,350 White Non-Hispanic householders$269,978 Black or African American householders$222,770 American Indian or Alaska Native householders $191,383 Asian householders$259,771 Some other race householders$229,660 Two or more races householders$291,669 Hispanic or Latino householders
Median age by race in Owasso
37.8 Median age for White residents34.5 41.8 30.3 Median age for Black or African American residents19.9 38.9 27.5 Median age for American Indian / Alaska Native residents26.6 32.1 29.1 Median age for Asian residents28.3 29.8 33.6 Median age for Native Hawaiian / Pacific Islander residents33.6 -442,328,041.9 26.1 Median age for Other race residents27.7 22.8 21.8 Median age for Two or more races residents20.7 22.4 37.2 Median age for White alone residents34.1 41.9 23.5 Median age for Hispanic or Latino residents24.1 22.2
Owner/renter occupied households by race in Owasso
House owners and renters - White residents 7,124 65.5% Owner occupied3,750 34.5% Renter occupiedHouse owners and renters - Black or African American residents 271 48.9% Owner occupied283 51.1% Renter occupiedHouse owners and renters - American Indian / Alaska Native residents 731 72.3% Owner occupied279 27.7% Renter occupiedHouse owners and renters - Asian residents 140 40.5% Owner occupied206 59.5% Renter occupiedHouse owners and renters - Native Hawaiian / Pacific Islander residents 11 100.0% Renter occupiedHouse owners and renters - Other race residents 200 50.4% Owner occupied197 49.6% Renter occupiedHouse owners and renters - Two or more races residents 1,013 75.6% Owner occupied326 24.4% Renter occupiedHouse owners and renters - White alone residents 7,141 64.9% Owner occupied3,861 35.1% Renter occupiedHouse owners and renters - Hispanic or Latino residents 414 60.2% Owner occupied274 39.8% Renter occupied
Language usage in Owasso
English speakers - Total 92.4% of residents of Owasso speak English at home.
4.5% of residents speak Spanish at home 1,113 69.1% Speak English very well497 30.9% Speak English less than very well2.9% of residents speak other language at home 694 66.1% Speak English very well356 33.9% Speak English less than very well
English speakers - Born in the United States 94.1% of residents of Owasso speak English at home.
3.5% of residents speak Spanish at home 386 83.0% Speak English very well79 17.0% Speak English less than very well2.4% of residents speak other language at home 271 84.7% Speak English very well49 15.3% Speak English less than very well
English speakers - Native, born elsewhere 68.3% of residents of Owasso speak English at home.
18.0% of residents speak Spanish at home 73 91.2% Speak English very well7 8.8% Speak English less than very well15.3% of residents speak other language at home 68 100.0% Speak English very well
English speakers - Foreign-born 22.6% of residents of Owasso speak English at home.
42.2% of residents speak Spanish at home 263 39.4% Speak English very well404 60.6% Speak English less than very well34.3% of residents speak other language at home 271 49.9% Speak English very well272 50.1% Speak English less than very well
White (Caucasian) - Speak only English Native:
99.8% (24,361)Foreign-born:
65.8% (191)
White (Caucasian) - Speak another language Native:
1.3% (315)Foreign-born:
50.1% (145)
Black or African American - Speak only English Native:
97.0% (1,320)Foreign-born:
73.5% (43)
Asian - Speak only English Native:
48.5% (222)Foreign-born:
20.4% (82)
Asian - Speak another language Native:
51.4% (235)Foreign-born:
80.1% (324)
Other race - Speak only English Native:
46.9% (609)Foreign-born:
5.1% (26)
Other race - Speak another language Native:
51.1% (664)Foreign-born:
94.8% (476)
Two or more races - Speak only English Native:
93.1% (3,759)Foreign-born:
3.4% (8)
Two or more races - Speak another language Native:
5.3% (212)Foreign-born:
97.1% (238)
White alone - Speak only English Native:
98.8% (24,112)Foreign-born:
64.5% (195)
White alone - Speak another language Native:
1.2% (299)Foreign-born:
39.5% (119)
Hispanic or Latino - Speak only English Native:
63.9% (1,315)Foreign-born:
3.8% (27)
Hispanic or Latino - Speak another language Native:
37.1% (763)Foreign-born:
96.3% (688)
Foreign-born residents in Owasso 1,522 residents are foreign born (2.0% Latin America , 1.2% Asia , 0.4% Europe ).
This city:
3.9%Oklahoma:
6.1%
Marital status for residents in Owasso Marital status - White (Caucasian) population 15 years and over
Males 31.2% Never married55.1% Now married1.2% Separated2.4% Widowed10.0% DivorcedFemales 19.4% Never married51.1% Now married1.1% Separated12.3% Widowed16.1% DivorcedWomen who gave birth in the past 12 months Now married:
79.1% (294)Unmarried:
20.9% (78)
Women who did not give birth in the past 12 months Now married:
54.4% (3,111)Unmarried:
45.6% (2,603)
Marital status - Black or African American population 15 years and over
Males 44.4% Never married45.6% Now married0.0% Separated0.0% Widowed10.1% DivorcedFemales 30.3% Never married34.6% Now married0.0% Separated4.6% Widowed30.5% DivorcedWomen who gave birth in the past 12 months Now married:
61.3% (20)Unmarried:
38.7% (13)
Women who did not give birth in the past 12 months Now married:
27.6% (131)Unmarried:
72.4% (344)
Marital status - American Indian / Alaska Native population 15 years and over
Males 43.9% Never married38.4% Now married0.0% Separated0.0% Widowed17.6% DivorcedFemales 35.4% Never married42.8% Now married3.1% Separated2.1% Widowed16.7% DivorcedWomen who gave birth in the past 12 months Now married:
76.4% (40)Unmarried:
23.6% (12)
Women who did not give birth in the past 12 months Now married:
44.1% (316)Unmarried:
55.9% (401)
Marital status - Asian population 15 years and over
Males 34.0% Never married59.5% Now married6.6% Separated0.0% Widowed0.0% DivorcedFemales 32.9% Never married54.9% Now married0.0% Separated3.0% Widowed9.2% DivorcedWomen who gave birth in the past 12 months Now married:
0.0% (0)Unmarried:
100.0% (16)
Women who did not give birth in the past 12 months Now married:
52.9% (145)Unmarried:
47.1% (129)
Marital status - Native Hawaiian / Pacific Islander population 15 years and over
Males 100.0% Never married0.0% Now married0.0% Separated0.0% Widowed0.0% DivorcedFemales 100.0% Never married0.0% Now married0.0% Separated0.0% Widowed0.0% DivorcedWomen who did not give birth in the past 12 months Now married:
0.0% (0)Unmarried:
100.0% (18)
Marital status - Other race population 15 years and over
Males 49.2% Never married42.5% Now married5.1% Separated0.0% Widowed3.2% DivorcedFemales 32.8% Never married54.3% Now married0.0% Separated0.8% Widowed12.3% DivorcedWomen who did not give birth in the past 12 months Now married:
47.9% (180)Unmarried:
52.1% (196)
Marital status - Two or more races population 15 years and over
Males 43.2% Never married50.5% Now married0.9% Separated1.1% Widowed4.3% DivorcedFemales 32.9% Never married54.2% Now married1.9% Separated1.2% Widowed9.8% DivorcedWomen who gave birth in the past 12 months Now married:
100.0% (35)Unmarried:
0.0% (0)
Women who did not give birth in the past 12 months Now married:
53.0% (638)Unmarried:
47.0% (565)
Marital status - White alone, not Hispanic / Latino population 15 years and over
Males 30.8% Never married55.5% Now married1.2% Separated2.3% Widowed10.0% DivorcedFemales 18.4% Never married51.3% Now married1.1% Separated12.7% Widowed16.5% DivorcedWomen who gave birth in the past 12 months Now married:
79.1% (309)Unmarried:
20.9% (82)
Women who did not give birth in the past 12 months Now married:
55.6% (3,215)Unmarried:
44.4% (2,572)
Marital status - Hispanic or Latino population 15 years and over
Males 42.2% Never married47.9% Now married3.0% Separated1.1% Widowed5.7% DivorcedFemales 42.6% Never married52.8% Now married0.9% Separated0.4% Widowed3.4% DivorcedWomen who did not give birth in the past 12 months Now married:
44.4% (304)Unmarried:
55.6% (381)
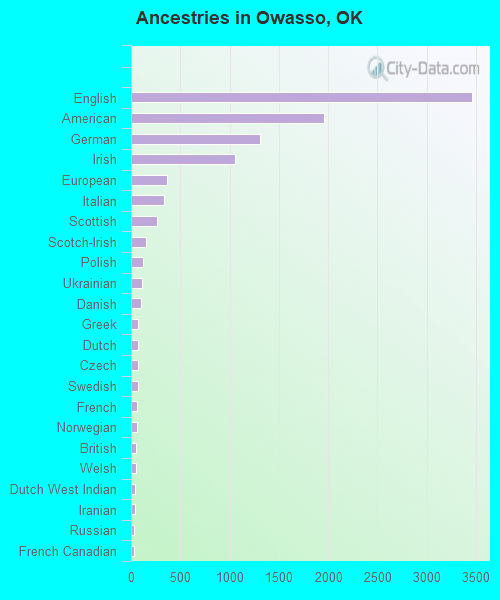
Ancestries in Owasso
3,458 19.5% English1,955 11.0% American1,311 7.4% German1,056 5.9% Irish368 2.1% European335 1.9% Italian264 1.5% Scottish154 0.9% Scotch-Irish119 0.7% Polish114 0.6% Ukrainian104 0.6% Danish74 0.4% Greek73 0.4% Dutch69 0.4% Czech69 0.4% Swedish59 0.3% French56 0.3% Norwegian54 0.3% British46 0.3% Welsh44 0.2% Dutch West Indian37 0.2% Iranian35 0.2% Russian33 0.2% French Canadian30 0.2% Portuguese25 0.1% Syrian23 0.1% Romanian21 0.1% Hungarian21 0.1% Belizean16 0.09% Northern European15 0.08% Slavic14 0.08% Lebanese14 0.08% Finnish12 0.07% Eastern European10 0.06% Brazilian5 0.03% Slovak4 0.02% Swiss
Geographical mobility in Owasso Same house 1 year ago 21,822 85.2% White (Caucasian)1,425 97.6% Black or African American2,099 74.4% American Indian / Alaska Native524 59.7% Asian56 100.0% Native Hawaiian / Pacific Islander1,539 81.0% Other race4,073 81.5% Two or more races22,010 84.8% White alone, not Hispanic / Latino2,484 83.3% Hispanic or LatinoMoved within same county 1,550 6.0% White / Caucasian36 2.5% Black or African American341 12.1% American Indian / Alaska Native138 15.7% Asian146 7.7% Other race477 9.5% Two or more races1,590 6.1% White alone, not Hispanic / Latino222 7.5% Hispanic or LatinoMoved within same state 1,457 5.7% White / Caucasian56 3.8% Black or African American111 3.9% American Indian / Alaska Native134 15.3% Asian98 5.1% Other race169 3.4% Two or more races1,500 5.8% White alone, not Hispanic / Latino66 2.2% Hispanic or LatinoMoved from different state 896 3.5% White / Caucasian11 0.8% Black or African American119 4.2% American Indian / Alaska Native102 5.4% Other race211 4.2% Two or more races961 3.7% White alone, not Hispanic / Latino154 5.2% Hispanic or LatinoMoved from abroad 10 0.0% White25 2.8% Asian19 0.7% Hispanic or Latino
Children Nativity (place of birth) in Owasso
Children under 6 years - Living with two parents Both parents native 2,097 100.0% NativeBoth parents foreign-born 64 100.0% NativeOne native, one foreign-born parent 180 100.0% NativeChildren under 6 years - Living with one parent Native parent 597 100.0% NativeForeign-born parent 13 100.0% NativeChildren 6 to 17 years - Living with two parents Both parents native 4,376 100.0% NativeBoth parents foreign-born 108 69.6% Native47 30.4% Foreign-bornOne native, one foreign-born parent 180 100.0% NativeChildren 6 to 17 years - Living with one parent Native parent 2,276 100.0% NativeForeign-born parent 78 50.3% Native77 49.7% Foreign-born
Grandparents responsible for own grandchildren in Owasso
Grandparents (30 to 59 years) White / Caucasian 65 53.8% Responsible for grandchildren56 46.2% Not responsible for grandchildrenAmerican Indian / Alaska Native 6 100.0% Responsible for grandchildrenOther race 64 73.5% Responsible for grandchildren23 26.5% Not responsible for grandchildrenWhite alone, not Hispanic / Latino 68 52.5% Responsible for grandchildren61 47.5% Not responsible for grandchildrenHispanic or Latino 41 81.4% Responsible for grandchildren9 18.6% Not responsible for grandchildrenGrandparents (60 years and over) White / Caucasian 30 14.9% Responsible for grandchildren173 85.1% Not responsible for grandchildrenAmerican Indian / Alaska Native 13 100.0% Not responsible for grandchildrenOther race 33 94.8% Responsible for grandchildren2 5.2% Not responsible for grandchildrenWhite alone, not Hispanic / Latino 31 15.1% Responsible for grandchildren176 84.9% Not responsible for grandchildrenHispanic or Latino 65 90.3% Responsible for grandchildren7 9.7% Not responsible for grandchildren