Races in Owings Mills, Maryland (MD) Detailed Stats
Data:
Races - White alone (%)
Races - White alone (% change since 2000)
Races - Black alone (%)
Races - Black alone (% change since 2000)
Races - American Indian alone (%)
Races - American Indian alone (% change since 2000)
Races - Asian alone (%)
Races - Asian alone (% change since 2000)
Races - Hispanic (%)
Races - Hispanic (% change since 2000)
Races - Native Hawaiian and Other Pacific Islander alone (%)
Races - Native Hawaiian and Other Pacific Islander alone (% change since 2000)
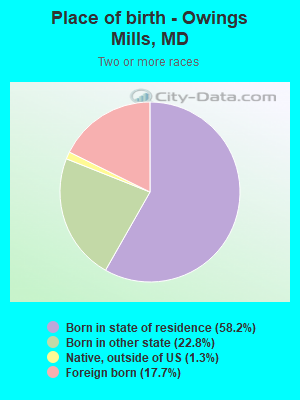
Races - Two or more races(%)
Races - Two or more races(% change since 2000)
Races - Other race alone (%)
Races - Other race alone (% change since 2000)
Racial diversity
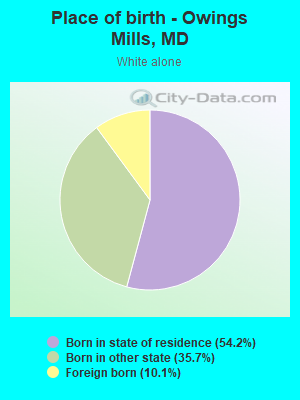
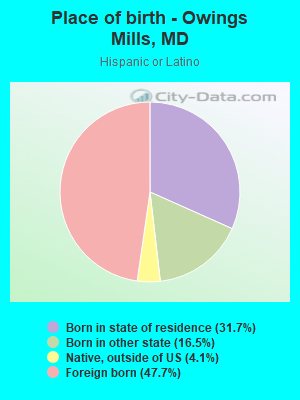
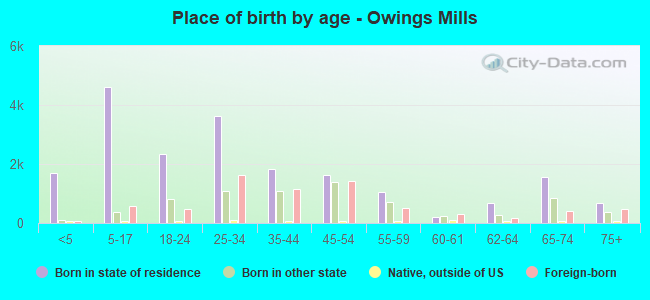
Place of birth - Born in state of residence (%)
Place of birth - Born in state of residence (%) - White
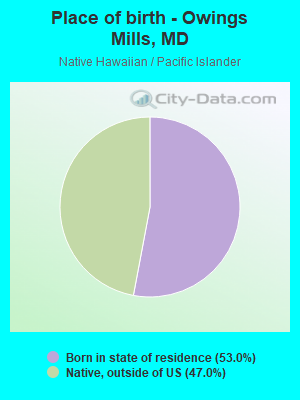
Place of birth - Born in state of residence (%) - Black or African American
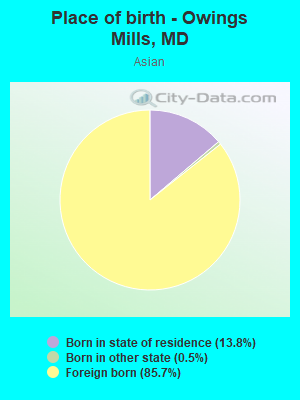
Place of birth - Born in state of residence (%) - Asian
Place of birth - Born in state of residence (%) - Hispanic or Latino
Place of birth - Born in state of residence (%) - American Indian and Alaska Native
Place of birth - Born in state of residence (%) - Multirace
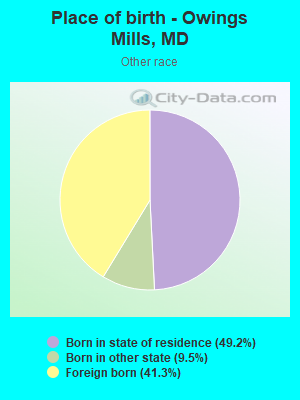
Place of birth - Born in state of residence (%) - Other Race
Place of birth - Born in other state (%)
Place of birth - Born in other state (%) - White
Place of birth - Born in other state (%) - Black or African American
Place of birth - Born in other state (%) - Asian
Place of birth - Born in other state (%) - Hispanic or Latino
Place of birth - Born in other state (%) - American Indian and Alaska Native
Place of birth - Born in other state (%) - Multirace
Place of birth - Born in other state (%) - Other Race
Place of birth - Native, outside of US (%)
Place of birth - Native, outside of US (%) - White
Place of birth - Native, outside of US (%) - Black or African American
Place of birth - Native, outside of US (%) - Asian
Place of birth - Native, outside of US (%) - Hispanic or Latino
Place of birth - Native, outside of US (%) - American Indian and Alaska Native
Place of birth - Native, outside of US (%) - Multirace
Place of birth - Native, outside of US (%) - Other Race
Place of birth - Foreign born (%)
Place of birth - Foreign born (%) - White
Place of birth - Foreign born (%) - Black or African American
Place of birth - Foreign born (%) - Asian
Place of birth - Foreign born (%) - Hispanic or Latino
Place of birth - Foreign born (%) - American Indian and Alaska Native
Place of birth - Foreign born (%) - Multirace
Place of birth - Foreign born (%) - Other Race
Residents speaking English at home (%)
Residents speaking English at home - Born in the United States (%)
Residents speaking English at home - Native, born elsewhere (%)
Residents speaking English at home - Foreign born (%)
Residents speaking Spanish at home (%)
Residents speaking Spanish at home - Born in the United States (%)
Residents speaking Spanish at home - Native, born elsewhere (%)
Residents speaking Spanish at home - Foreign born (%)
Residents speaking other language at home (%)
Residents speaking other language at home - Born in the United States (%)
Residents speaking other language at home - Native, born elsewhere (%)
Residents speaking other language at home - Foreign born (%)
Marital status - Never married (%)
Marital status - Now married (%)
Marital status - Separated (%)
Marital status - Widowed (%)
Marital status - Divorced (%)
Ancestries Reported - Arab (%)
Ancestries Reported - Czech (%)
Ancestries Reported - Danish (%)
Ancestries Reported - Dutch (%)
Ancestries Reported - English (%)
Ancestries Reported - French (%)
Ancestries Reported - French Canadian (%)
Ancestries Reported - German (%)
Ancestries Reported - Greek (%)
Ancestries Reported - Hungarian (%)
Ancestries Reported - Irish (%)
Ancestries Reported - Italian (%)
Ancestries Reported - Lithuanian (%)
Ancestries Reported - Norwegian (%)
Ancestries Reported - Polish (%)
Ancestries Reported - Portuguese (%)
Ancestries Reported - Russian (%)
Ancestries Reported - Scotch-Irish (%)
Ancestries Reported - Scottish (%)
Ancestries Reported - Slovak (%)
Ancestries Reported - Subsaharan African (%)
Ancestries Reported - Swedish (%)
Ancestries Reported - Swiss (%)
Ancestries Reported - Ukrainian (%)
Ancestries Reported - United States (%)
Ancestries Reported - Welsh (%)
Ancestries Reported - West Indian (%)
Ancestries Reported - Other (%)
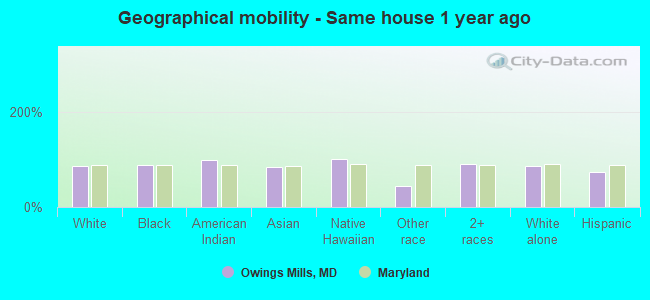
Geographical mobility - Same house 1 year ago (%)
Geographical mobility - Same house 1 year ago (%) - White
Geographical mobility - Same house 1 year ago (%) - Black or African American
Geographical mobility - Same house 1 year ago (%) - Asian
Geographical mobility - Same house 1 year ago (%) - Hispanic or Latino
Geographical mobility - Same house 1 year ago (%) - American Indian and Alaska Native
Geographical mobility - Same house 1 year ago (%) - Multirace
Geographical mobility - Same house 1 year ago (%) - Other Race
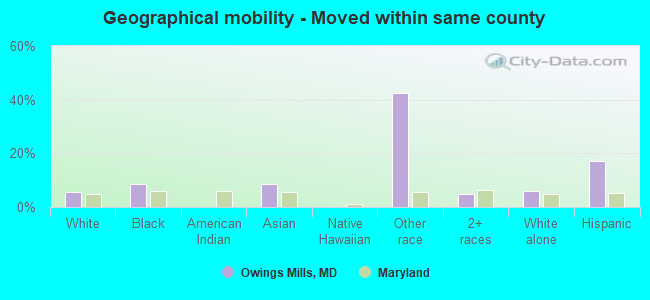
Geographical mobility - Moved within same county (%)
Geographical mobility - Moved within same county (%) - White
Geographical mobility - Moved within same county (%) - Black or African American
Geographical mobility - Moved within same county (%) - Asian
Geographical mobility - Moved within same county (%) - Hispanic or Latino
Geographical mobility - Moved within same county (%) - American Indian and Alaska Native
Geographical mobility - Moved within same county (%) - Multirace
Geographical mobility - Moved within same county (%) - Other Race
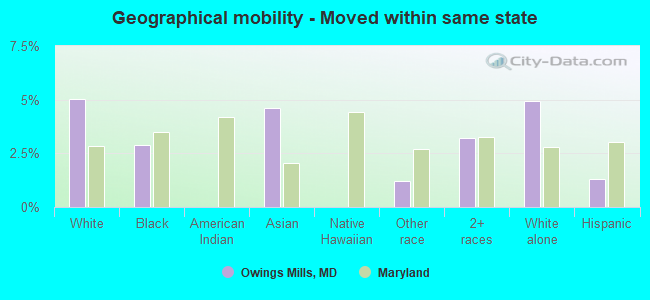
Geographical mobility - Moved from different county within same state (%)
Geographical mobility - Moved from different county within same state (%) - White
Geographical mobility - Moved from different county within same state (%) - Black or African American
Geographical mobility - Moved from different county within same state (%) - Asian
Geographical mobility - Moved from different county within same state (%) - Hispanic or Latino
Geographical mobility - Moved from different county within same state (%) - American Indian and Alaska Native
Geographical mobility - Moved from different county within same state (%) - Multirace
Geographical mobility - Moved from different county within same state (%) - Other Race
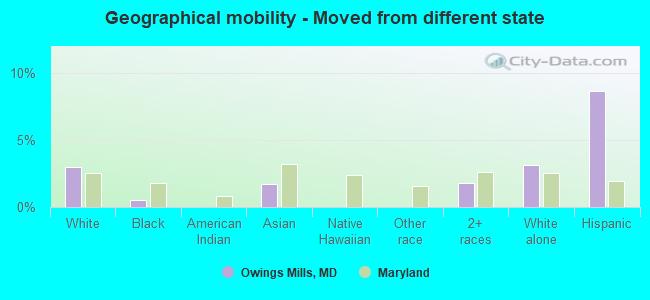
Geographical mobility - Moved from different state (%)
Geographical mobility - Moved from different state (%) - White
Geographical mobility - Moved from different state (%) - Black or African American
Geographical mobility - Moved from different state (%) - Asian
Geographical mobility - Moved from different state (%) - Hispanic or Latino
Geographical mobility - Moved from different state (%) - American Indian and Alaska Native
Geographical mobility - Moved from different state (%) - Multirace
Geographical mobility - Moved from different state (%) - Other Race
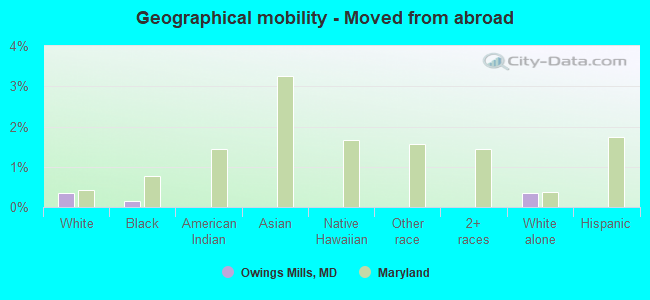
Geographical mobility - Moved from abroad (%)
Geographical mobility - Moved from abroad (%) - White
Geographical mobility - Moved from abroad (%) - Black or African American
Geographical mobility - Moved from abroad (%) - Asian
Geographical mobility - Moved from abroad (%) - Hispanic or Latino
Geographical mobility - Moved from abroad (%) - American Indian and Alaska Native
Geographical mobility - Moved from abroad (%) - Multirace
Geographical mobility - Moved from abroad (%) - Other Race
Place of birth for the foreign-born population - Ireland (%)
Place of birth for the foreign-born population - Denmark (%)
Place of birth for the foreign-born population - Norway (%)
Place of birth for the foreign-born population - Sweden (%)
Place of birth for the foreign-born population - United Kingdom (%)
Place of birth for the foreign-born population - England (%)
Place of birth for the foreign-born population - Scotland (%)
Place of birth for the foreign-born population - Other Northern Europe (%)
Place of birth for the foreign-born population - Austria (%)
Place of birth for the foreign-born population - Belgium (%)
Place of birth for the foreign-born population - France (%)
Place of birth for the foreign-born population - Germany (%)
Place of birth for the foreign-born population - Netherlands (%)
Place of birth for the foreign-born population - Switzerland (%)
Place of birth for the foreign-born population - Other Western Europe (%)
Place of birth for the foreign-born population - Greece (%)
Place of birth for the foreign-born population - Italy (%)
Place of birth for the foreign-born population - Portugal (%)
Place of birth for the foreign-born population - Spain (%)
Place of birth for the foreign-born population - Other Southern Europe (%)
Place of birth for the foreign-born population - Albania (%)
Place of birth for the foreign-born population - Belarus (%)
Place of birth for the foreign-born population - Bosnia and Herzegovina (%)
Place of birth for the foreign-born population - Bulgaria (%)
Place of birth for the foreign-born population - Croatia (%)
Place of birth for the foreign-born population - Czechoslovakia (%)
Place of birth for the foreign-born population - Hungary (%)
Place of birth for the foreign-born population - Latvia (%)
Place of birth for the foreign-born population - Lithuania (%)
Place of birth for the foreign-born population - North Macedonia (Macedonia) (%)
Place of birth for the foreign-born population - Moldova (%)
Place of birth for the foreign-born population - Poland (%)
Place of birth for the foreign-born population - Romania (%)
Place of birth for the foreign-born population - Russia (%)
Place of birth for the foreign-born population - Serbia (%)
Place of birth for the foreign-born population - Ukraine (%)
Place of birth for the foreign-born population - Other Eastern Europe (%)
Place of birth for the foreign-born population - China (%)
Place of birth for the foreign-born population - Hong Kong (%)
Place of birth for the foreign-born population - Taiwan (%)
Place of birth for the foreign-born population - Japan (%)
Place of birth for the foreign-born population - Korea (%)
Place of birth for the foreign-born population - Other Eastern Asia (%)
Place of birth for the foreign-born population - Afghanistan (%)
Place of birth for the foreign-born population - Bangladesh (%)
Place of birth for the foreign-born population - India (%)
Place of birth for the foreign-born population - Iran (%)
Place of birth for the foreign-born population - Kazakhstan (%)
Place of birth for the foreign-born population - Nepal (%)
Place of birth for the foreign-born population - Pakistan (%)
Place of birth for the foreign-born population - Sri Lanka (%)
Place of birth for the foreign-born population - Uzbekistan (%)
Place of birth for the foreign-born population - Other South Central Asia (%)
Place of birth for the foreign-born population - Burma (%)
Place of birth for the foreign-born population - Cambodia (%)
Place of birth for the foreign-born population - Indonesia (%)
Place of birth for the foreign-born population - Laos (%)
Place of birth for the foreign-born population - Malaysia (%)
Place of birth for the foreign-born population - Philippines (%)
Place of birth for the foreign-born population - Singapore (%)
Place of birth for the foreign-born population - Thailand (%)
Place of birth for the foreign-born population - Vietnam (%)
Place of birth for the foreign-born population - Other South Eastern Asia (%)
Place of birth for the foreign-born population - Armenia (%)
Place of birth for the foreign-born population - Iraq (%)
Place of birth for the foreign-born population - Israel (%)
Place of birth for the foreign-born population - Jordan (%)
Place of birth for the foreign-born population - Kuwait (%)
Place of birth for the foreign-born population - Lebanon (%)
Place of birth for the foreign-born population - Saudi Arabia (%)
Place of birth for the foreign-born population - Syria (%)
Place of birth for the foreign-born population - Turkey (%)
Place of birth for the foreign-born population - Yemen (%)
Place of birth for the foreign-born population - Other Western Asia (%)
Place of birth for the foreign-born population - Eritrea (%)
Place of birth for the foreign-born population - Ethiopia (%)
Place of birth for the foreign-born population - Kenya (%)
Place of birth for the foreign-born population - Somalia (%)
Place of birth for the foreign-born population - Uganda (%)
Place of birth for the foreign-born population - Zimbabwe (%)
Place of birth for the foreign-born population - Other Eastern Africa (%)
Place of birth for the foreign-born population - Cameroon (%)
Place of birth for the foreign-born population - Congo (%)
Place of birth for the foreign-born population - Democratic Republic of Congo (Zaire) (%)
Place of birth for the foreign-born population - Other Middle Africa (%)
Place of birth for the foreign-born population - Egypt (%)
Place of birth for the foreign-born population - Morocco (%)
Place of birth for the foreign-born population - Sudan (%)
Place of birth for the foreign-born population - Other Northern Africa (%)
Place of birth for the foreign-born population - South Africa (%)
Place of birth for the foreign-born population - Other Southern Africa (%)
Place of birth for the foreign-born population - Cabo Verde (%)
Place of birth for the foreign-born population - Ghana (%)
Place of birth for the foreign-born population - Liberia (%)
Place of birth for the foreign-born population - Nigeria (%)
Place of birth for the foreign-born population - Senegal (%)
Place of birth for the foreign-born population - Sierra Leone (%)
Place of birth for the foreign-born population - Other Western Africa (%)
Place of birth for the foreign-born population - Australia (%)
Place of birth for the foreign-born population - New Zealand (%)
Place of birth for the foreign-born population - Fiji (%)
Place of birth for the foreign-born population - Micronesia (%)
Place of birth for the foreign-born population - Bahamas (%)
Place of birth for the foreign-born population - Barbados (%)
Place of birth for the foreign-born population - Cuba (%)
Place of birth for the foreign-born population - Dominica (%)
Place of birth for the foreign-born population - Dominican Republic (%)
Place of birth for the foreign-born population - Grenada (%)
Place of birth for the foreign-born population - Haiti (%)
Place of birth for the foreign-born population - Jamaica (%)
Place of birth for the foreign-born population - St. Vincent and the Grenadines (%)
Place of birth for the foreign-born population - Trinidad and Tobago (%)
Place of birth for the foreign-born population - West Indies (%)
Place of birth for the foreign-born population - Other Caribbean (%)
Place of birth for the foreign-born population - Belize (%)
Place of birth for the foreign-born population - Costa Rica (%)
Place of birth for the foreign-born population - El Salvador (%)
Place of birth for the foreign-born population - Guatemala (%)
Place of birth for the foreign-born population - Honduras (%)
Place of birth for the foreign-born population - Mexico (%)
Place of birth for the foreign-born population - Nicaragua (%)
Place of birth for the foreign-born population - Panama (%)
Place of birth for the foreign-born population - Other Central America (%)
Place of birth for the foreign-born population - Argentina (%)
Place of birth for the foreign-born population - Bolivia (%)
Place of birth for the foreign-born population - Brazil (%)
Place of birth for the foreign-born population - Chile (%)
Place of birth for the foreign-born population - Colombia (%)
Place of birth for the foreign-born population - Ecuador (%)
Place of birth for the foreign-born population - Guyana (%)
Place of birth for the foreign-born population - Peru (%)
Place of birth for the foreign-born population - Uruguay (%)
Place of birth for the foreign-born population - Venezuela (%)
Place of birth for the foreign-born population - Other South America (%)
Place of birth for the foreign-born population - Canada (%)
Place of birth for the foreign-born population - Other Northern America (%)
Place of birth for the foreign-born population - Other (%)
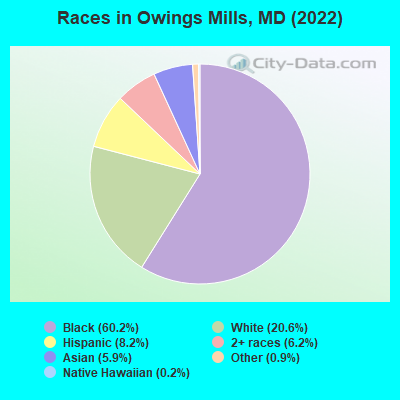
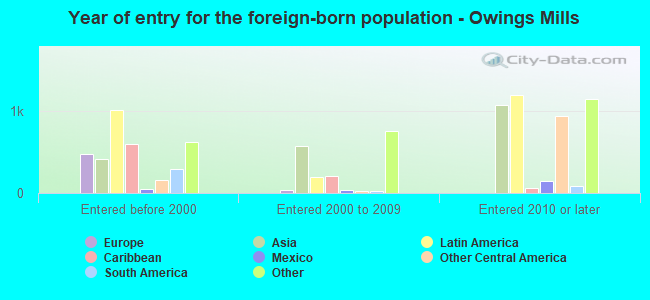
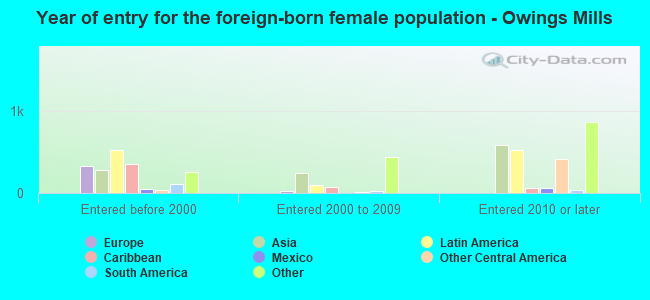
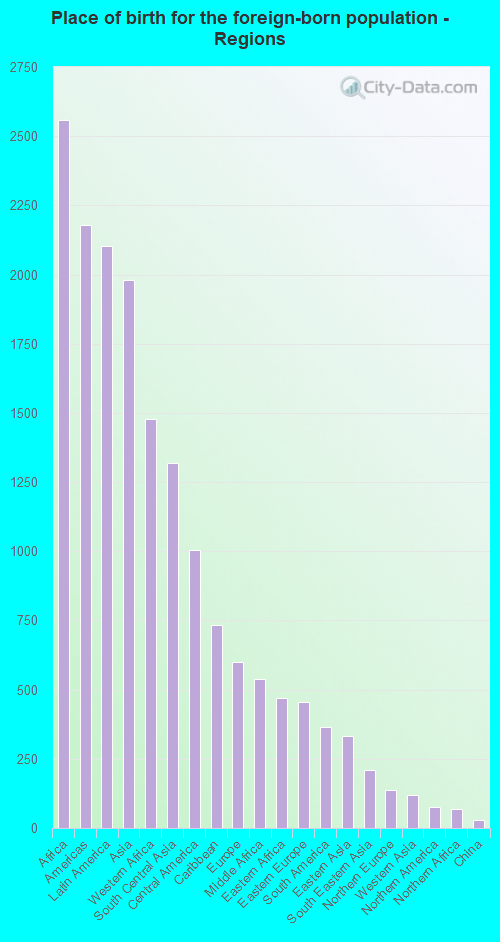
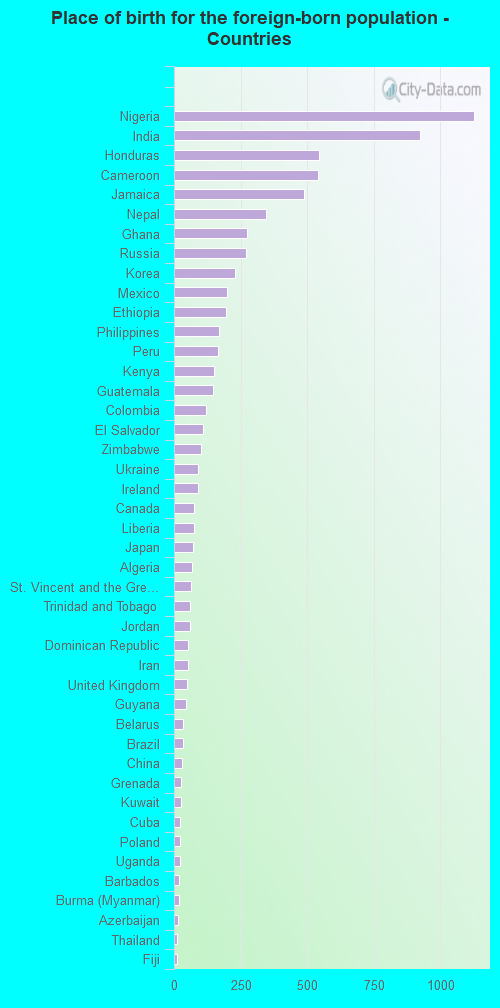
According to 2022 data, the most numerous races in Owings Mills, MD are White alone (7,159 residents), Black alone (20,961 residents), and Hispanic (2,870 residents). 78.8% of Owings Mills residents speak English at home. 21.1% of Owings Mills, MD residents are foreign-born (6.9% born in Africa, 5.6% born in Latin America, 5.3% born in Asia), which is 24.0% greater than the foreign-born rate of 16.0% across the entire state of Maryland.
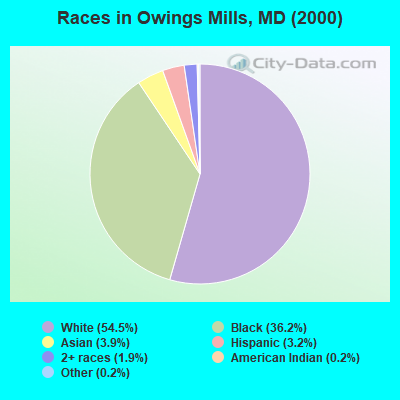
Race distribution in Owings Mills
2000 2022
3,286,547 62.1% White alone 1,464,735 27.7% Black alone 227,916 4.3% Hispanic 209,738 4.0% Asian alone 82,946 1.6% Two or more races 13,312 0.3% American Indian alone 9,379 0.2% Other race alone 1,913 0.04% Native Hawaiian and Other
2,906,492 47.1% White alone 1,800,914 29.2% Black alone 705,842 11.4% Hispanic 401,818 6.5% Asian alone 291,317 4.7% Two or more races 46,930 0.8% Other race alone 8,930 0.1% American Indian alone 2,417 0.04% Native Hawaiian and Other
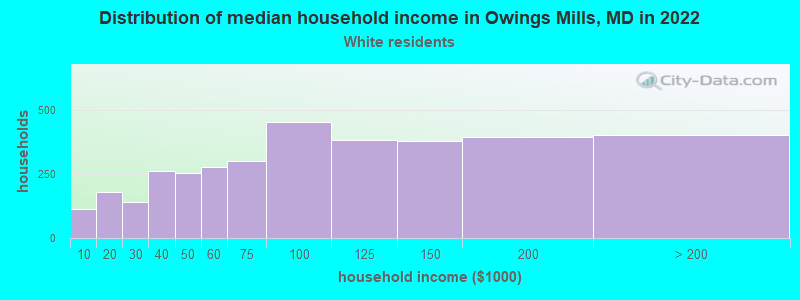
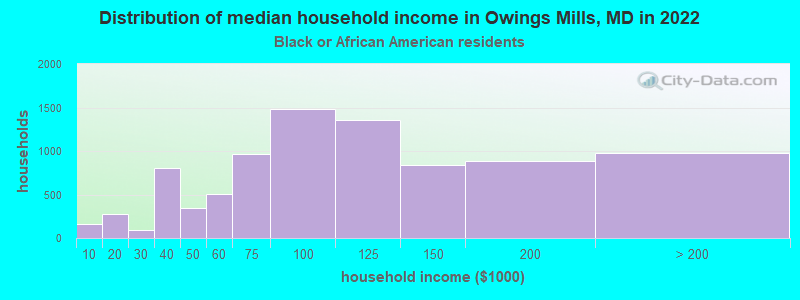
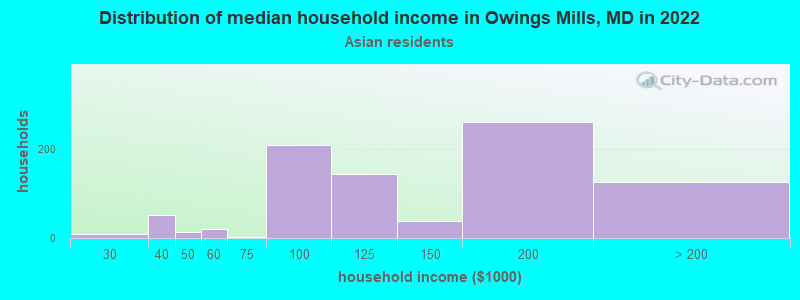
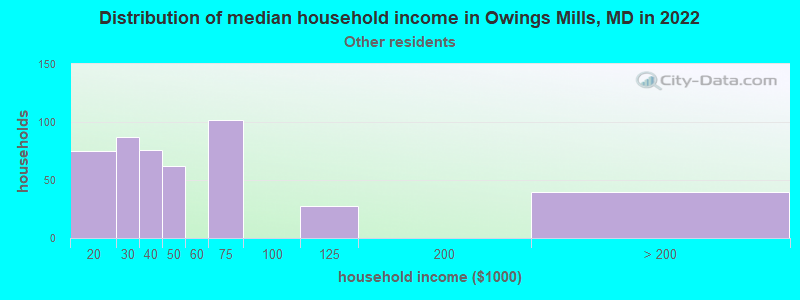
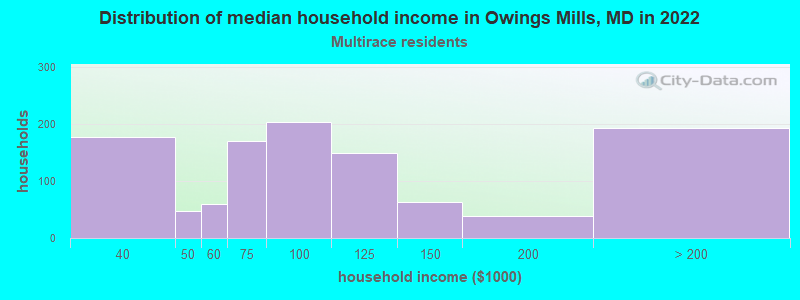
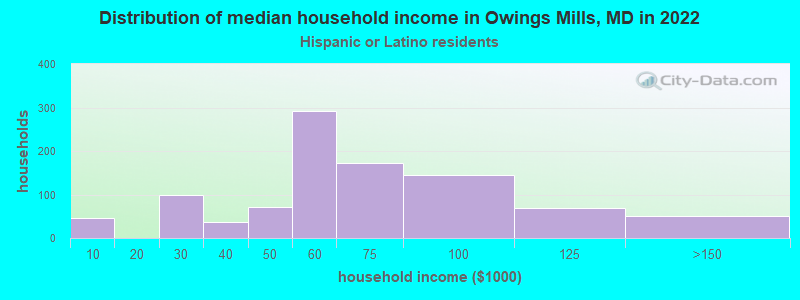
Income and house value in Owings Mills Median household income in 2022 $91,748 White non-Hispanic householders$92,748 Black householders$146,282 Asian householders$104,248 Two or more races householders$57,552 Hispanic or Latino race householdersMedian 2022 house value $322,653 White Non-Hispanic householders$443,808 Black or African American householders$478,242 American Indian or Alaska Native householders $392,796 Asian householders$242,309 Some other race householders$328,520 Two or more races householders$303,014 Hispanic or Latino householders
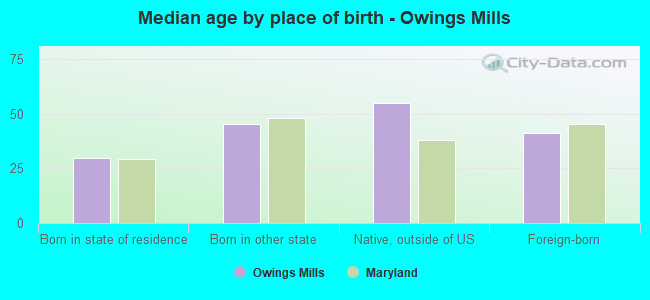
Median age by race in Owings Mills
36.9 Median age for White residents34.2 42.1 35.1 Median age for Black or African American residents33.1 36.3 -768,041,236.3 Median age for American Indian / Alaska Native residents-867,632,849.4 -677,419,354.2 34.6 Median age for Asian residents34.5 35.7 -1,541,125,539.6 Median age for Native Hawaiian / Pacific Islander residents-790,901,136.6 -760,942,760.2 22.6 Median age for Other race residents20.2 38.7 32.8 Median age for Two or more races residents27.5 31.1 37.2 Median age for White alone residents33.4 42.6 25.7 Median age for Hispanic or Latino residents19.0 34.3
Owner/renter occupied households by race in Owings Mills
House owners and renters - White residents 2,209 63.0% Owner occupied1,296 37.0% Renter occupiedHouse owners and renters - Black or African American residents 4,235 48.0% Owner occupied4,584 52.0% Renter occupiedHouse owners and renters - Asian residents 474 52.1% Owner occupied436 47.9% Renter occupiedHouse owners and renters - Native Hawaiian / Pacific Islander residents 50 100.0% Owner occupiedHouse owners and renters - Other race residents 108 23.2% Owner occupied357 76.8% Renter occupiedHouse owners and renters - Two or more races residents 423 37.5% Owner occupied704 62.5% Renter occupiedHouse owners and renters - White alone residents 2,188 64.3% Owner occupied1,214 35.7% Renter occupiedHouse owners and renters - Hispanic or Latino residents 256 29.1% Owner occupied623 70.9% Renter occupied
Language usage in Owings Mills
English speakers - Total 78.8% of residents of Owings Mills speak English at home.
6.5% of residents speak Spanish at home 992 46.3% Speak English very well1,152 53.7% Speak English less than very well14.1% of residents speak other language at home 3,534 76.2% Speak English very well1,105 23.8% Speak English less than very well
English speakers - Born in the United States 93.8% of residents of Owings Mills speak English at home.
3.3% of residents speak Spanish at home 178 75.7% Speak English very well57 24.3% Speak English less than very well3.0% of residents speak other language at home 213 98.2% Speak English very well4 1.8% Speak English less than very well
English speakers - Native, born elsewhere 41.2% of residents of Owings Mills speak English at home.
30.1% of residents speak Spanish at home 123 100.0% Speak English very well14.0% of residents speak other language at home 57 100.0% Speak English very well
English speakers - Foreign-born 30.7% of residents of Owings Mills speak English at home.
18.4% of residents speak Spanish at home 194 14.6% Speak English very well1,133 85.4% Speak English less than very well51.6% of residents speak other language at home 2,690 72.3% Speak English very well1,033 27.7% Speak English less than very well
White (Caucasian) - Speak only English Native:
92.0% (5,825)Foreign-born:
20.0% (156)
White (Caucasian) - Speak another language Native:
6.6% (417)Foreign-born:
79.4% (620)
Black or African American - Speak only English Native:
95.1% (16,204)Foreign-born:
53.0% (1,865)
Black or African American - Speak another language Native:
4.4% (745)Foreign-born:
49.2% (1,732)
Asian - Speak only English Native:
83.5% (143)Foreign-born:
10.7% (187)
Asian - Speak another language Native:
17.2% (29)Foreign-born:
89.0% (1,564)
Other race - Speak another language Native:
61.7% (544)Foreign-born:
100.0% (658)
Two or more races - Speak only English Native:
93.3% (2,158)Foreign-born:
17.5% (88)
Two or more races - Speak another language Native:
7.4% (170)Foreign-born:
72.0% (361)
White alone - Speak only English Native:
92.1% (5,750)Foreign-born:
21.3% (155)
White alone - Speak another language Native:
6.8% (423)Foreign-born:
79.1% (575)
Hispanic or Latino - Speak only English Native:
45.2% (639)Foreign-born:
3.8% (51)
Hispanic or Latino - Speak another language Native:
51.4% (727)Foreign-born:
96.3% (1,310)
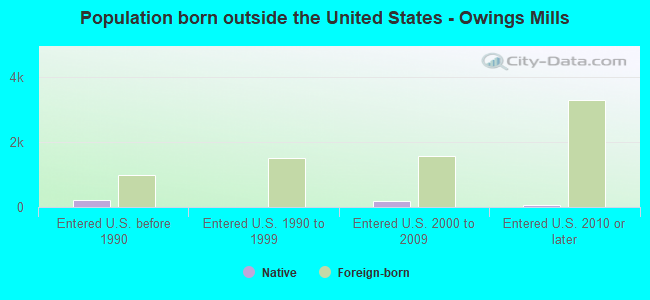
Foreign-born residents in Owings Mills 7,332 residents are foreign born (6.9% Africa , 5.6% Latin America , 5.3% Asia ).
This city:
21.1%Maryland:
15.7%
Marital status for residents in Owings Mills Marital status - White (Caucasian) population 15 years and over
Males 46.1% Never married43.4% Now married0.0% Separated3.1% Widowed7.4% DivorcedFemales 40.4% Never married32.3% Now married1.0% Separated12.0% Widowed14.2% DivorcedWomen who gave birth in the past 12 months Now married:
78.4% (27)Unmarried:
21.6% (7)
Women who did not give birth in the past 12 months Now married:
28.2% (545)Unmarried:
71.8% (1,388)
Marital status - Black or African American population 15 years and over
Males 39.7% Never married46.2% Now married1.8% Separated0.7% Widowed11.6% DivorcedFemales 42.9% Never married30.0% Now married4.7% Separated7.3% Widowed15.1% DivorcedWomen who gave birth in the past 12 months Now married:
73.6% (206)Unmarried:
26.4% (74)
Women who did not give birth in the past 12 months Now married:
31.7% (2,060)Unmarried:
68.3% (4,437)
Marital status - Asian population 15 years and over
Males 20.6% Never married72.4% Now married0.0% Separated1.8% Widowed5.3% DivorcedFemales 5.4% Never married86.4% Now married0.0% Separated1.7% Widowed6.5% DivorcedWomen who gave birth in the past 12 months Now married:
100.0% (58)Unmarried:
0.0% (0)
Women who did not give birth in the past 12 months Now married:
83.5% (548)Unmarried:
16.5% (108)
Marital status - Native Hawaiian / Pacific Islander population 15 years and over
Males 100.0% Never married0.0% Now married0.0% Separated0.0% Widowed0.0% DivorcedFemales 0.0% Never married100.0% Now married0.0% Separated0.0% Widowed0.0% DivorcedMarital status - Other race population 15 years and over
Males 63.4% Never married24.9% Now married0.0% Separated0.0% Widowed11.6% DivorcedFemales 19.6% Never married37.5% Now married14.9% Separated7.2% Widowed20.8% DivorcedWomen who gave birth in the past 12 months Now married:
0.0% (0)Unmarried:
100.0% (32)
Women who did not give birth in the past 12 months Now married:
37.9% (117)Unmarried:
62.1% (192)
Marital status - Two or more races population 15 years and over
Males 42.4% Never married38.3% Now married0.0% Separated0.0% Widowed19.3% DivorcedFemales 40.0% Never married19.2% Now married9.5% Separated14.2% Widowed17.1% DivorcedWomen who did not give birth in the past 12 months Now married:
38.8% (329)Unmarried:
61.2% (520)
Marital status - White alone, not Hispanic / Latino population 15 years and over
Males 45.3% Never married43.7% Now married0.0% Separated3.2% Widowed7.8% DivorcedFemales 40.2% Never married32.3% Now married1.0% Separated12.4% Widowed14.0% DivorcedWomen who gave birth in the past 12 months Now married:
78.4% (27)Unmarried:
21.6% (8)
Women who did not give birth in the past 12 months Now married:
27.5% (508)Unmarried:
72.5% (1,343)
Marital status - Hispanic or Latino population 15 years and over
Males 60.3% Never married37.3% Now married0.0% Separated0.0% Widowed2.4% DivorcedFemales 45.6% Never married23.3% Now married7.8% Separated2.7% Widowed20.6% DivorcedWomen who gave birth in the past 12 months Now married:
0.0% (0)Unmarried:
100.0% (24)
Women who did not give birth in the past 12 months Now married:
27.5% (221)Unmarried:
72.5% (582)
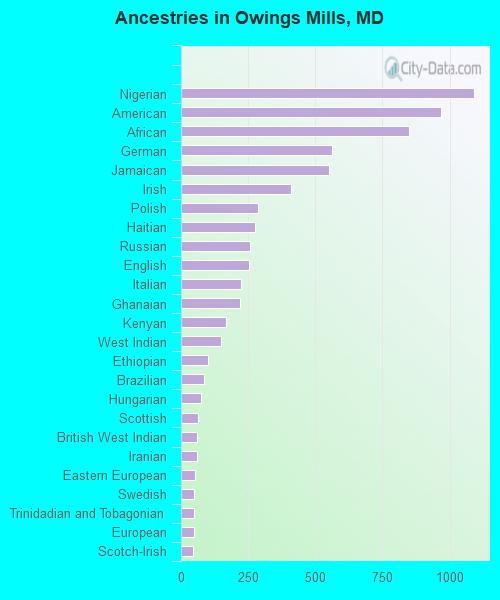
Ancestries in Owings Mills
1,092 5.1% Nigerian967 4.5% American847 3.9% African561 2.6% German551 2.6% Jamaican411 1.9% Irish288 1.3% Polish275 1.3% Haitian257 1.2% Russian254 1.2% English223 1.0% Italian219 1.0% Ghanaian169 0.8% Kenyan150 0.7% West Indian99 0.5% Ethiopian86 0.4% Brazilian74 0.3% Hungarian62 0.3% Scottish61 0.3% British West Indian60 0.3% Iranian53 0.2% Eastern European49 0.2% Swedish49 0.2% Trinidadian and Tobagonian48 0.2% European44 0.2% Scotch-Irish41 0.2% Danish39 0.2% Turkish32 0.1% Sierra Leonean32 0.1% Guyanese28 0.1% Scandinavian25 0.1% Norwegian23 0.1% Ukrainian20 0.09% Jordanian20 0.09% Barbadian19 0.09% French17 0.08% Canadian13 0.06% Israeli3 0.01% Lithuanian2 0.01% Liberian2 0.01% Austrian
Geographical mobility in Owings Mills Same house 1 year ago 6,302 86.0% White (Caucasian)19,224 88.4% Black or African American7 98.9% American Indian / Alaska Native1,661 82.8% Asian92 100.0% Native Hawaiian / Pacific Islander572 42.7% Other race2,651 90.6% Two or more races6,104 85.7% White alone, not Hispanic / Latino2,065 74.4% Hispanic or LatinoMoved within same county 415 5.7% White / Caucasian1,828 8.4% Black or African American171 8.5% Asian569 42.4% Other race139 4.7% Two or more races424 6.0% White alone, not Hispanic / Latino473 17.1% Hispanic or LatinoMoved within same state 368 5.0% White / Caucasian629 2.9% Black or African American93 4.6% Asian16 1.2% Other race94 3.2% Two or more races351 4.9% White alone, not Hispanic / Latino36 1.3% Hispanic or LatinoMoved from different state 220 3.0% White / Caucasian115 0.5% Black or African American35 1.7% Asian52 1.8% Two or more races221 3.1% White alone, not Hispanic / Latino241 8.7% Hispanic or LatinoMoved from abroad 26 0.4% White34 0.2% Black or African American26 0.4% White alone, not Hispanic / Latino
Children Nativity (place of birth) in Owings Mills
Children under 6 years - Living with two parents Both parents native 795 97.2% Native23 2.8% Foreign-bornBoth parents foreign-born 450 80.4% Native110 19.6% Foreign-bornOne native, one foreign-born parent 264 100.0% NativeChildren under 6 years - Living with one parent Native parent 551 100.0% NativeForeign-born parent 126 45.4% Native151 54.6% Foreign-bornChildren 6 to 17 years - Living with two parents Both parents native 1,229 100.0% NativeBoth parents foreign-born 380 97.4% Native10 2.6% Foreign-bornOne native, one foreign-born parent 276 83.6% Native54 16.4% Foreign-bornChildren 6 to 17 years - Living with one parent Native parent 1,742 100.0% NativeForeign-born parent 580 63.0% Native341 37.0% Foreign-born
Grandparents responsible for own grandchildren in Owings Mills
Grandparents (30 to 59 years) White / Caucasian 44 100.0% Not responsible for grandchildrenBlack or African American 16 22.7% Responsible for grandchildren53 77.3% Not responsible for grandchildrenAsian 19 100.0% Not responsible for grandchildrenTwo or more races 96 100.0% Not responsible for grandchildrenWhite alone, not Hispanic / Latino 43 100.0% Not responsible for grandchildrenGrandparents (60 years and over) White / Caucasian 28 100.0% Not responsible for grandchildrenBlack or African American 84 23.7% Responsible for grandchildren271 76.3% Not responsible for grandchildrenAsian 59 100.0% Not responsible for grandchildrenWhite alone, not Hispanic / Latino 30 100.0% Not responsible for grandchildren