Races in Pahrump, Nevada (NV) Detailed Stats
Data:
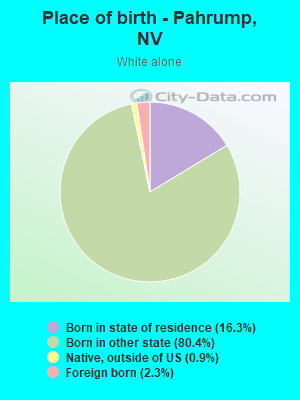
Races - White alone (%)
Races - White alone (% change since 2000)
Races - Black alone (%)
Races - Black alone (% change since 2000)
Races - American Indian alone (%)
Races - American Indian alone (% change since 2000)
Races - Asian alone (%)
Races - Asian alone (% change since 2000)
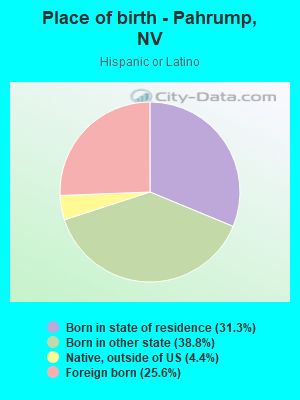
Races - Hispanic (%)
Races - Hispanic (% change since 2000)
Races - Native Hawaiian and Other Pacific Islander alone (%)
Races - Native Hawaiian and Other Pacific Islander alone (% change since 2000)
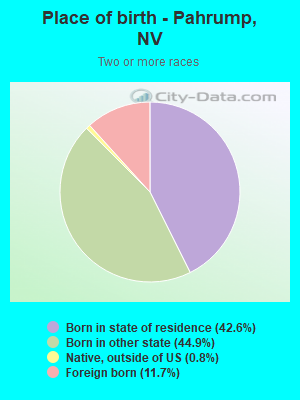
Races - Two or more races(%)
Races - Two or more races(% change since 2000)
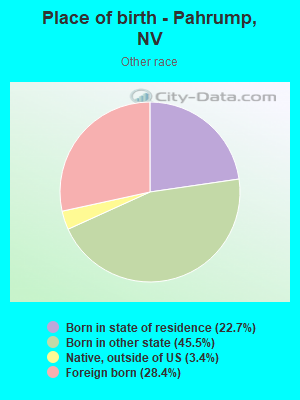
Races - Other race alone (%)
Races - Other race alone (% change since 2000)
Racial diversity
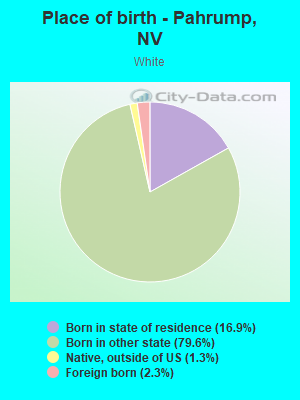
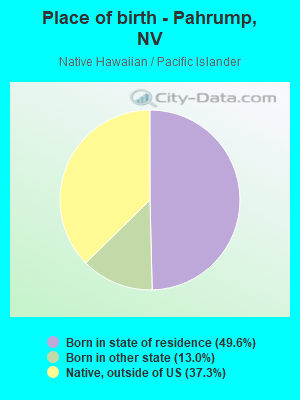
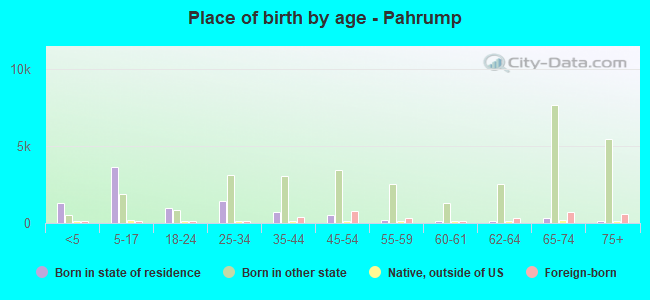
Place of birth - Born in state of residence (%)
Place of birth - Born in state of residence (%) - White
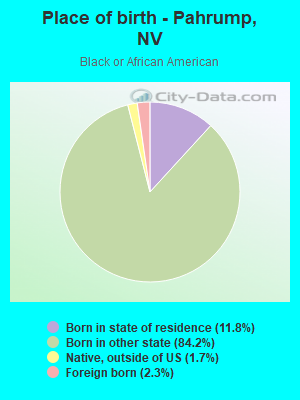
Place of birth - Born in state of residence (%) - Black or African American
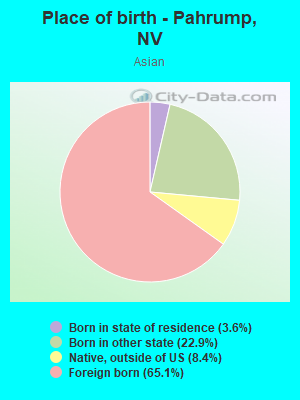
Place of birth - Born in state of residence (%) - Asian
Place of birth - Born in state of residence (%) - Hispanic or Latino
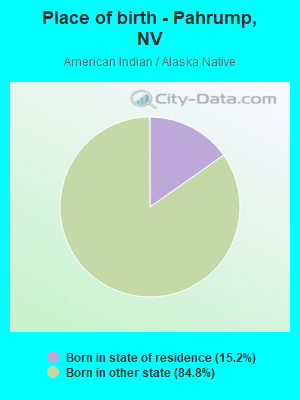
Place of birth - Born in state of residence (%) - American Indian and Alaska Native
Place of birth - Born in state of residence (%) - Multirace
Place of birth - Born in state of residence (%) - Other Race
Place of birth - Born in other state (%)
Place of birth - Born in other state (%) - White
Place of birth - Born in other state (%) - Black or African American
Place of birth - Born in other state (%) - Asian
Place of birth - Born in other state (%) - Hispanic or Latino
Place of birth - Born in other state (%) - American Indian and Alaska Native
Place of birth - Born in other state (%) - Multirace
Place of birth - Born in other state (%) - Other Race
Place of birth - Native, outside of US (%)
Place of birth - Native, outside of US (%) - White
Place of birth - Native, outside of US (%) - Black or African American
Place of birth - Native, outside of US (%) - Asian
Place of birth - Native, outside of US (%) - Hispanic or Latino
Place of birth - Native, outside of US (%) - American Indian and Alaska Native
Place of birth - Native, outside of US (%) - Multirace
Place of birth - Native, outside of US (%) - Other Race
Place of birth - Foreign born (%)
Place of birth - Foreign born (%) - White
Place of birth - Foreign born (%) - Black or African American
Place of birth - Foreign born (%) - Asian
Place of birth - Foreign born (%) - Hispanic or Latino
Place of birth - Foreign born (%) - American Indian and Alaska Native
Place of birth - Foreign born (%) - Multirace
Place of birth - Foreign born (%) - Other Race
Residents speaking English at home (%)
Residents speaking English at home - Born in the United States (%)
Residents speaking English at home - Native, born elsewhere (%)
Residents speaking English at home - Foreign born (%)
Residents speaking Spanish at home (%)
Residents speaking Spanish at home - Born in the United States (%)
Residents speaking Spanish at home - Native, born elsewhere (%)
Residents speaking Spanish at home - Foreign born (%)
Residents speaking other language at home (%)
Residents speaking other language at home - Born in the United States (%)
Residents speaking other language at home - Native, born elsewhere (%)
Residents speaking other language at home - Foreign born (%)
Marital status - Never married (%)
Marital status - Now married (%)
Marital status - Separated (%)
Marital status - Widowed (%)
Marital status - Divorced (%)
Ancestries Reported - Arab (%)
Ancestries Reported - Czech (%)
Ancestries Reported - Danish (%)
Ancestries Reported - Dutch (%)
Ancestries Reported - English (%)
Ancestries Reported - French (%)
Ancestries Reported - French Canadian (%)
Ancestries Reported - German (%)
Ancestries Reported - Greek (%)
Ancestries Reported - Hungarian (%)
Ancestries Reported - Irish (%)
Ancestries Reported - Italian (%)
Ancestries Reported - Lithuanian (%)
Ancestries Reported - Norwegian (%)
Ancestries Reported - Polish (%)
Ancestries Reported - Portuguese (%)
Ancestries Reported - Russian (%)
Ancestries Reported - Scotch-Irish (%)
Ancestries Reported - Scottish (%)
Ancestries Reported - Slovak (%)
Ancestries Reported - Subsaharan African (%)
Ancestries Reported - Swedish (%)
Ancestries Reported - Swiss (%)
Ancestries Reported - Ukrainian (%)
Ancestries Reported - United States (%)
Ancestries Reported - Welsh (%)
Ancestries Reported - West Indian (%)
Ancestries Reported - Other (%)
Geographical mobility - Same house 1 year ago (%)
Geographical mobility - Same house 1 year ago (%) - White
Geographical mobility - Same house 1 year ago (%) - Black or African American
Geographical mobility - Same house 1 year ago (%) - Asian
Geographical mobility - Same house 1 year ago (%) - Hispanic or Latino
Geographical mobility - Same house 1 year ago (%) - American Indian and Alaska Native
Geographical mobility - Same house 1 year ago (%) - Multirace
Geographical mobility - Same house 1 year ago (%) - Other Race
Geographical mobility - Moved within same county (%)
Geographical mobility - Moved within same county (%) - White
Geographical mobility - Moved within same county (%) - Black or African American
Geographical mobility - Moved within same county (%) - Asian
Geographical mobility - Moved within same county (%) - Hispanic or Latino
Geographical mobility - Moved within same county (%) - American Indian and Alaska Native
Geographical mobility - Moved within same county (%) - Multirace
Geographical mobility - Moved within same county (%) - Other Race
Geographical mobility - Moved from different county within same state (%)
Geographical mobility - Moved from different county within same state (%) - White
Geographical mobility - Moved from different county within same state (%) - Black or African American
Geographical mobility - Moved from different county within same state (%) - Asian
Geographical mobility - Moved from different county within same state (%) - Hispanic or Latino
Geographical mobility - Moved from different county within same state (%) - American Indian and Alaska Native
Geographical mobility - Moved from different county within same state (%) - Multirace
Geographical mobility - Moved from different county within same state (%) - Other Race
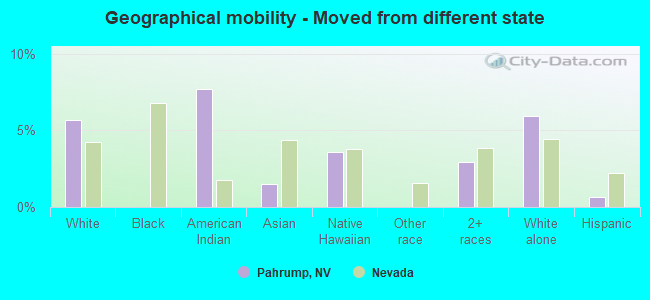
Geographical mobility - Moved from different state (%)
Geographical mobility - Moved from different state (%) - White
Geographical mobility - Moved from different state (%) - Black or African American
Geographical mobility - Moved from different state (%) - Asian
Geographical mobility - Moved from different state (%) - Hispanic or Latino
Geographical mobility - Moved from different state (%) - American Indian and Alaska Native
Geographical mobility - Moved from different state (%) - Multirace
Geographical mobility - Moved from different state (%) - Other Race
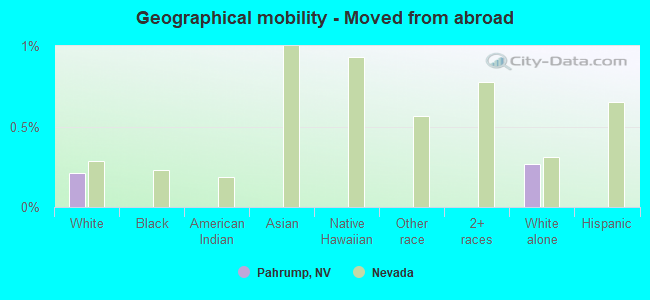
Geographical mobility - Moved from abroad (%)
Geographical mobility - Moved from abroad (%) - White
Geographical mobility - Moved from abroad (%) - Black or African American
Geographical mobility - Moved from abroad (%) - Asian
Geographical mobility - Moved from abroad (%) - Hispanic or Latino
Geographical mobility - Moved from abroad (%) - American Indian and Alaska Native
Geographical mobility - Moved from abroad (%) - Multirace
Geographical mobility - Moved from abroad (%) - Other Race
Place of birth for the foreign-born population - Ireland (%)
Place of birth for the foreign-born population - Denmark (%)
Place of birth for the foreign-born population - Norway (%)
Place of birth for the foreign-born population - Sweden (%)
Place of birth for the foreign-born population - United Kingdom (%)
Place of birth for the foreign-born population - England (%)
Place of birth for the foreign-born population - Scotland (%)
Place of birth for the foreign-born population - Other Northern Europe (%)
Place of birth for the foreign-born population - Austria (%)
Place of birth for the foreign-born population - Belgium (%)
Place of birth for the foreign-born population - France (%)
Place of birth for the foreign-born population - Germany (%)
Place of birth for the foreign-born population - Netherlands (%)
Place of birth for the foreign-born population - Switzerland (%)
Place of birth for the foreign-born population - Other Western Europe (%)
Place of birth for the foreign-born population - Greece (%)
Place of birth for the foreign-born population - Italy (%)
Place of birth for the foreign-born population - Portugal (%)
Place of birth for the foreign-born population - Spain (%)
Place of birth for the foreign-born population - Other Southern Europe (%)
Place of birth for the foreign-born population - Albania (%)
Place of birth for the foreign-born population - Belarus (%)
Place of birth for the foreign-born population - Bosnia and Herzegovina (%)
Place of birth for the foreign-born population - Bulgaria (%)
Place of birth for the foreign-born population - Croatia (%)
Place of birth for the foreign-born population - Czechoslovakia (%)
Place of birth for the foreign-born population - Hungary (%)
Place of birth for the foreign-born population - Latvia (%)
Place of birth for the foreign-born population - Lithuania (%)
Place of birth for the foreign-born population - North Macedonia (Macedonia) (%)
Place of birth for the foreign-born population - Moldova (%)
Place of birth for the foreign-born population - Poland (%)
Place of birth for the foreign-born population - Romania (%)
Place of birth for the foreign-born population - Russia (%)
Place of birth for the foreign-born population - Serbia (%)
Place of birth for the foreign-born population - Ukraine (%)
Place of birth for the foreign-born population - Other Eastern Europe (%)
Place of birth for the foreign-born population - China (%)
Place of birth for the foreign-born population - Hong Kong (%)
Place of birth for the foreign-born population - Taiwan (%)
Place of birth for the foreign-born population - Japan (%)
Place of birth for the foreign-born population - Korea (%)
Place of birth for the foreign-born population - Other Eastern Asia (%)
Place of birth for the foreign-born population - Afghanistan (%)
Place of birth for the foreign-born population - Bangladesh (%)
Place of birth for the foreign-born population - India (%)
Place of birth for the foreign-born population - Iran (%)
Place of birth for the foreign-born population - Kazakhstan (%)
Place of birth for the foreign-born population - Nepal (%)
Place of birth for the foreign-born population - Pakistan (%)
Place of birth for the foreign-born population - Sri Lanka (%)
Place of birth for the foreign-born population - Uzbekistan (%)
Place of birth for the foreign-born population - Other South Central Asia (%)
Place of birth for the foreign-born population - Burma (%)
Place of birth for the foreign-born population - Cambodia (%)
Place of birth for the foreign-born population - Indonesia (%)
Place of birth for the foreign-born population - Laos (%)
Place of birth for the foreign-born population - Malaysia (%)
Place of birth for the foreign-born population - Philippines (%)
Place of birth for the foreign-born population - Singapore (%)
Place of birth for the foreign-born population - Thailand (%)
Place of birth for the foreign-born population - Vietnam (%)
Place of birth for the foreign-born population - Other South Eastern Asia (%)
Place of birth for the foreign-born population - Armenia (%)
Place of birth for the foreign-born population - Iraq (%)
Place of birth for the foreign-born population - Israel (%)
Place of birth for the foreign-born population - Jordan (%)
Place of birth for the foreign-born population - Kuwait (%)
Place of birth for the foreign-born population - Lebanon (%)
Place of birth for the foreign-born population - Saudi Arabia (%)
Place of birth for the foreign-born population - Syria (%)
Place of birth for the foreign-born population - Turkey (%)
Place of birth for the foreign-born population - Yemen (%)
Place of birth for the foreign-born population - Other Western Asia (%)
Place of birth for the foreign-born population - Eritrea (%)
Place of birth for the foreign-born population - Ethiopia (%)
Place of birth for the foreign-born population - Kenya (%)
Place of birth for the foreign-born population - Somalia (%)
Place of birth for the foreign-born population - Uganda (%)
Place of birth for the foreign-born population - Zimbabwe (%)
Place of birth for the foreign-born population - Other Eastern Africa (%)
Place of birth for the foreign-born population - Cameroon (%)
Place of birth for the foreign-born population - Congo (%)
Place of birth for the foreign-born population - Democratic Republic of Congo (Zaire) (%)
Place of birth for the foreign-born population - Other Middle Africa (%)
Place of birth for the foreign-born population - Egypt (%)
Place of birth for the foreign-born population - Morocco (%)
Place of birth for the foreign-born population - Sudan (%)
Place of birth for the foreign-born population - Other Northern Africa (%)
Place of birth for the foreign-born population - South Africa (%)
Place of birth for the foreign-born population - Other Southern Africa (%)
Place of birth for the foreign-born population - Cabo Verde (%)
Place of birth for the foreign-born population - Ghana (%)
Place of birth for the foreign-born population - Liberia (%)
Place of birth for the foreign-born population - Nigeria (%)
Place of birth for the foreign-born population - Senegal (%)
Place of birth for the foreign-born population - Sierra Leone (%)
Place of birth for the foreign-born population - Other Western Africa (%)
Place of birth for the foreign-born population - Australia (%)
Place of birth for the foreign-born population - New Zealand (%)
Place of birth for the foreign-born population - Fiji (%)
Place of birth for the foreign-born population - Micronesia (%)
Place of birth for the foreign-born population - Bahamas (%)
Place of birth for the foreign-born population - Barbados (%)
Place of birth for the foreign-born population - Cuba (%)
Place of birth for the foreign-born population - Dominica (%)
Place of birth for the foreign-born population - Dominican Republic (%)
Place of birth for the foreign-born population - Grenada (%)
Place of birth for the foreign-born population - Haiti (%)
Place of birth for the foreign-born population - Jamaica (%)
Place of birth for the foreign-born population - St. Vincent and the Grenadines (%)
Place of birth for the foreign-born population - Trinidad and Tobago (%)
Place of birth for the foreign-born population - West Indies (%)
Place of birth for the foreign-born population - Other Caribbean (%)
Place of birth for the foreign-born population - Belize (%)
Place of birth for the foreign-born population - Costa Rica (%)
Place of birth for the foreign-born population - El Salvador (%)
Place of birth for the foreign-born population - Guatemala (%)
Place of birth for the foreign-born population - Honduras (%)
Place of birth for the foreign-born population - Mexico (%)
Place of birth for the foreign-born population - Nicaragua (%)
Place of birth for the foreign-born population - Panama (%)
Place of birth for the foreign-born population - Other Central America (%)
Place of birth for the foreign-born population - Argentina (%)
Place of birth for the foreign-born population - Bolivia (%)
Place of birth for the foreign-born population - Brazil (%)
Place of birth for the foreign-born population - Chile (%)
Place of birth for the foreign-born population - Colombia (%)
Place of birth for the foreign-born population - Ecuador (%)
Place of birth for the foreign-born population - Guyana (%)
Place of birth for the foreign-born population - Peru (%)
Place of birth for the foreign-born population - Uruguay (%)
Place of birth for the foreign-born population - Venezuela (%)
Place of birth for the foreign-born population - Other South America (%)
Place of birth for the foreign-born population - Canada (%)
Place of birth for the foreign-born population - Other Northern America (%)
Place of birth for the foreign-born population - Other (%)
Latest news about races in Pahrump, NV collected exclusively by city-data.com from local newspapers, TV, and radio stations
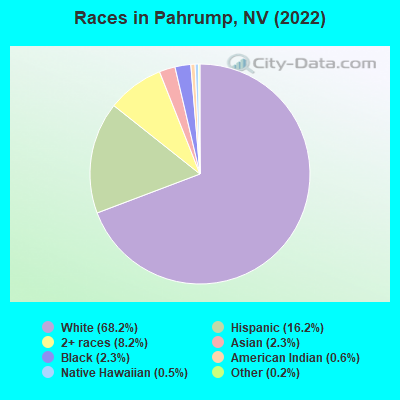
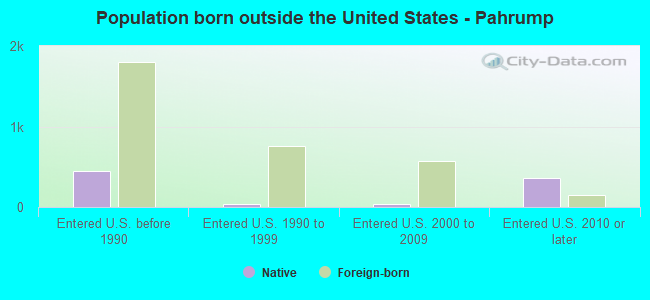
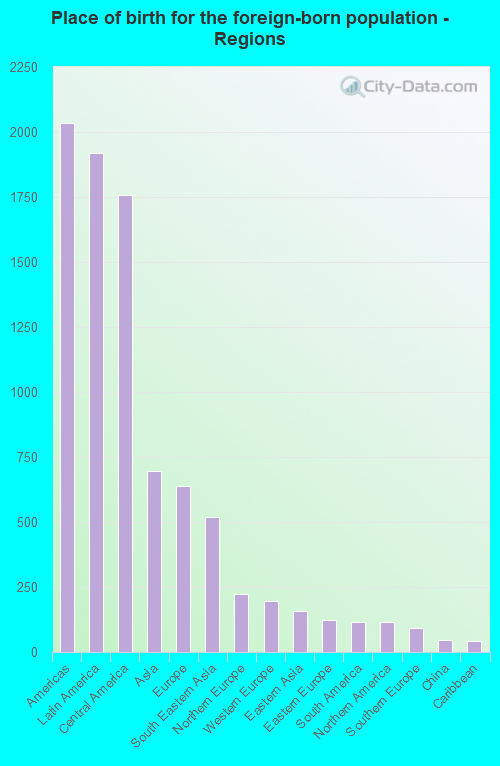
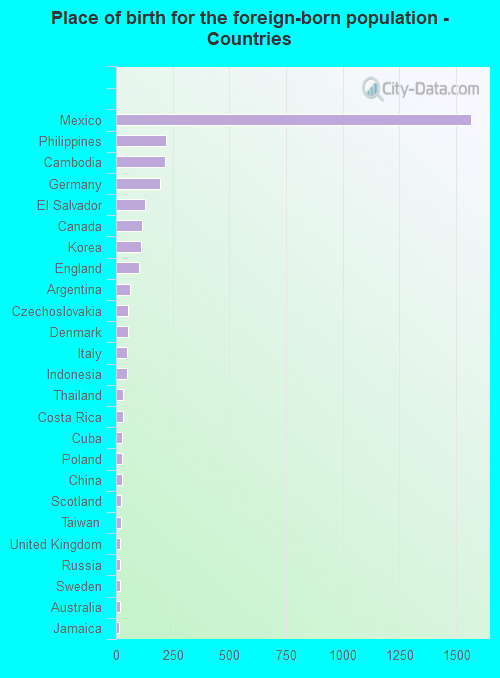
According to 2022 data, the most numerous races in Pahrump, NV are White alone (31,208 residents), Hispanic (7,407 residents), and Black alone (1,044 residents). 88.1% of Pahrump residents speak English at home. 7.4% of Pahrump, NV residents are foreign-born (4.2% born in Latin America, 1.5% born in Asia, 1.4% born in Europe), which is 143.2% less than the foreign-born rate of 18.0% across the entire state of Nevada.
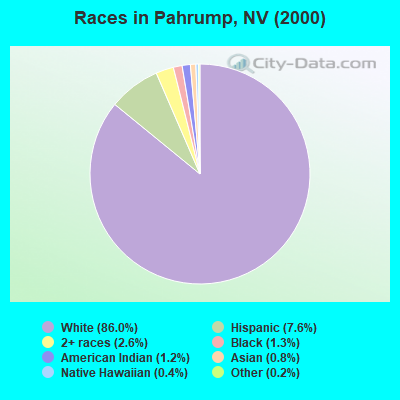
Race distribution in Pahrump
2000 2022
1,303,001 65.2% White alone 393,970 19.7% Hispanic 131,509 6.6% Black alone 88,593 4.4% Asian alone 49,231 2.5% Two or more races 21,397 1.1% American Indian alone 7,769 0.4% Native Hawaiian and Other 2,787 0.1% Other race alone
1,410,145 44.4% White alone 961,357 30.3% Hispanic 286,471 9.0% Black alone 281,149 8.8% Asian alone 182,151 5.7% Two or more races 20,102 0.6% Native Hawaiian and Other 18,781 0.6% Other race alone 17,616 0.6% American Indian alone
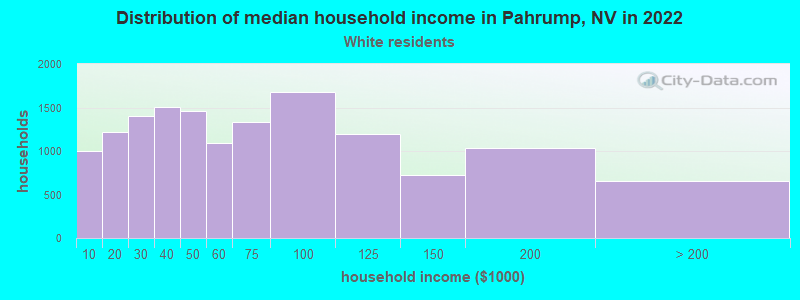
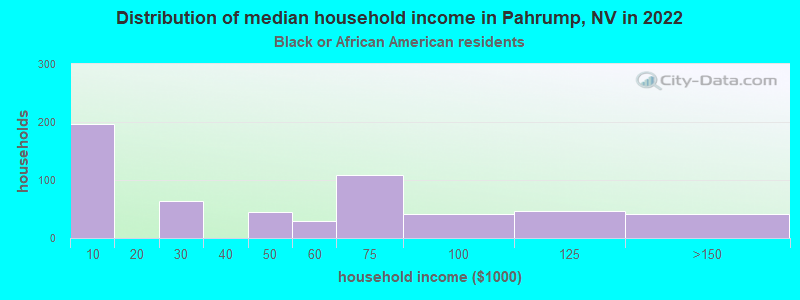
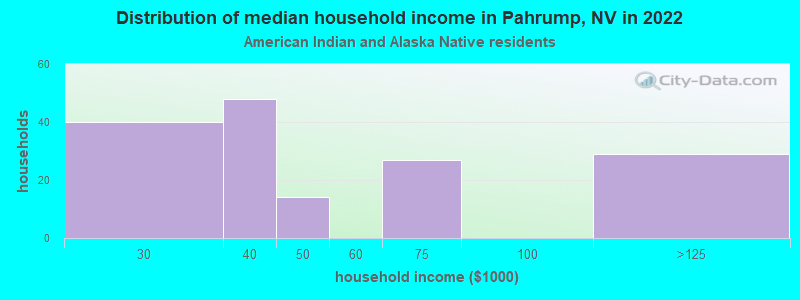
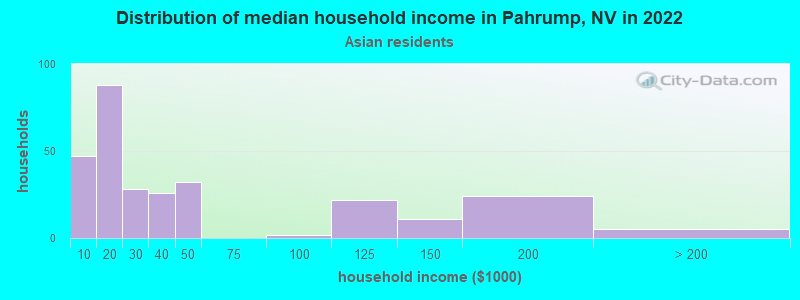
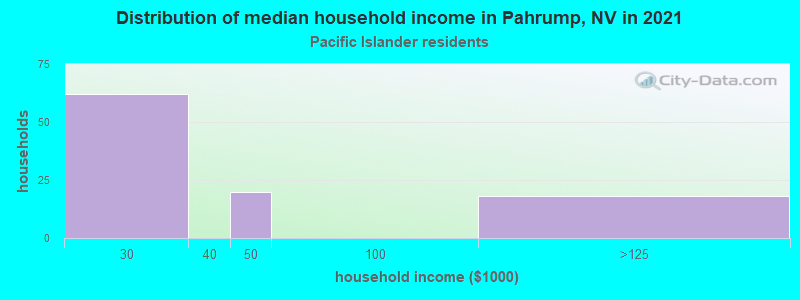
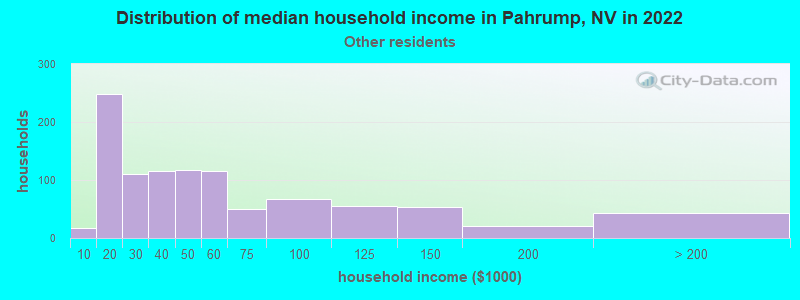
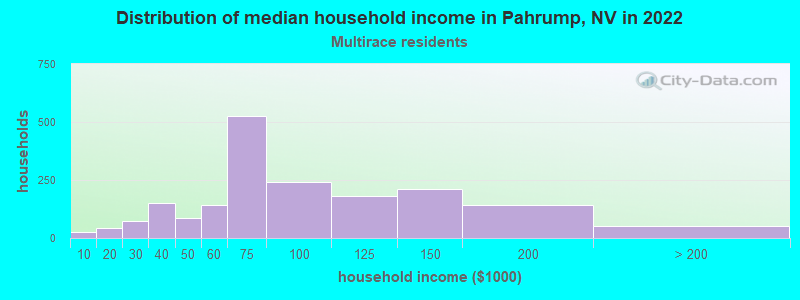
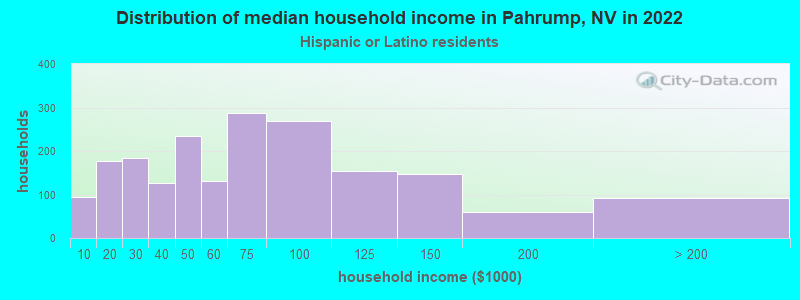
Income and house value in Pahrump Median household income in 2022 $53,687 White non-Hispanic householders$37,401 American Indian and Alaska Native householders$39,666 Some other race householders$69,737 Two or more races householders$57,279 Hispanic or Latino race householdersMedian 2022 house value $357,540 White Non-Hispanic householders$382,765 Black or African American householders$392,910 American Indian or Alaska Native householders $308,460 Asian householders$388,523 Some other race householders$358,637 Two or more races householders$393,184 Hispanic or Latino householders
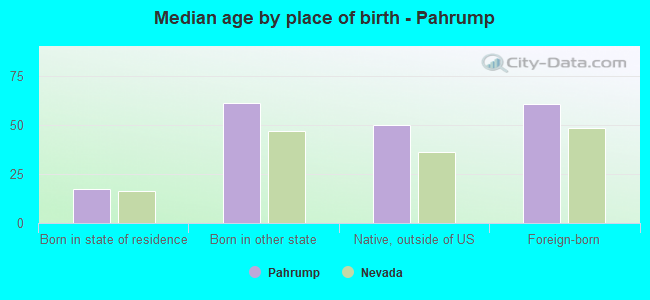
Median age by race in Pahrump
61.2 Median age for White residents60.6 61.9 46.4 Median age for Black or African American residents52.9 33.1 57.4 Median age for American Indian / Alaska Native residents39.0 65.3 55.4 Median age for Asian residents48.7 61.4 59.9 Median age for Native Hawaiian / Pacific Islander residents56.1 70.8 32.4 Median age for Other race residents32.0 38.5 33.3 Median age for Two or more races residents34.1 32.5 60.1 Median age for White alone residents59.0 61.0 31.8 Median age for Hispanic or Latino residents33.5 29.1
Owner/renter occupied households by race in Pahrump
House owners and renters - White residents 11,866 80.8% Owner occupied2,816 19.2% Renter occupiedHouse owners and renters - Black or African American residents 333 57.9% Owner occupied242 42.1% Renter occupiedHouse owners and renters - American Indian / Alaska Native residents 121 69.0% Owner occupied54 31.0% Renter occupiedHouse owners and renters - Asian residents 192 67.0% Owner occupied95 33.0% Renter occupiedHouse owners and renters - Native Hawaiian / Pacific Islander residents 48 100.0% Owner occupiedHouse owners and renters - Other race residents 836 75.8% Owner occupied267 24.2% Renter occupiedHouse owners and renters - Two or more races residents 1,704 86.1% Owner occupied275 13.9% Renter occupiedHouse owners and renters - White alone residents 11,807 80.0% Owner occupied2,954 20.0% Renter occupiedHouse owners and renters - Hispanic or Latino residents 1,674 80.4% Owner occupied409 19.6% Renter occupied
Language usage in Pahrump
English speakers - Total 88.1% of residents of Pahrump speak English at home.
8.7% of residents speak Spanish at home 2,543 66.4% Speak English very well1,288 33.6% Speak English less than very well3.1% of residents speak other language at home 998 73.7% Speak English very well356 26.3% Speak English less than very well
English speakers - Born in the United States 94.6% of residents of Pahrump speak English at home.
4.3% of residents speak Spanish at home 1,288 94.3% Speak English very well78 5.7% Speak English less than very well1.1% of residents speak other language at home 306 90.3% Speak English very well33 9.7% Speak English less than very well
English speakers - Native, born elsewhere 56.9% of residents of Pahrump speak English at home.
29.5% of residents speak Spanish at home 211 85.1% Speak English very well37 14.9% Speak English less than very well13.5% of residents speak other language at home 114 100.0% Speak English very well
English speakers - Foreign-born 26.0% of residents of Pahrump speak English at home.
47.3% of residents speak Spanish at home 455 28.4% Speak English very well1,147 71.6% Speak English less than very well26.3% of residents speak other language at home 569 63.9% Speak English very well322 36.1% Speak English less than very well
White (Caucasian) - Speak only English Native:
99.6% (29,606)Foreign-born:
59.6% (425)
White (Caucasian) - Speak another language Native:
2.2% (657)Foreign-born:
49.9% (355)
Black or African American - Speak only English Native:
99.3% (1,053)Foreign-born:
80.8% (20)
Black or African American - Speak another language Native:
1.2% (13)Foreign-born:
17.4% (4)
Asian - Speak only English Native:
61.1% (234)Foreign-born:
25.0% (172)
Asian - Speak another language Native:
37.6% (144)Foreign-born:
75.4% (519)
Other race - Speak only English Native:
47.5% (1,135)Foreign-born:
16.8% (186)
Other race - Speak another language Native:
52.0% (1,245)Foreign-born:
83.1% (919)
Two or more races - Speak only English Native:
87.4% (4,504)Foreign-born:
6.7% (50)
Two or more races - Speak another language Native:
8.5% (440)Foreign-born:
93.4% (694)
White alone - Speak only English Native:
98.7% (29,261)Foreign-born:
53.9% (394)
White alone - Speak another language Native:
1.3% (378)Foreign-born:
45.7% (334)
Hispanic or Latino - Speak only English Native:
57.7% (2,812)Foreign-born:
14.6% (279)
Hispanic or Latino - Speak another language Native:
42.6% (2,077)Foreign-born:
85.1% (1,624)
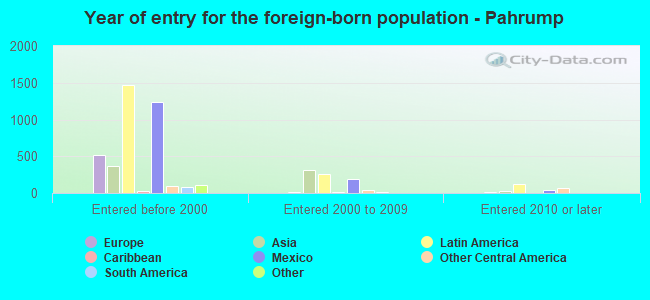
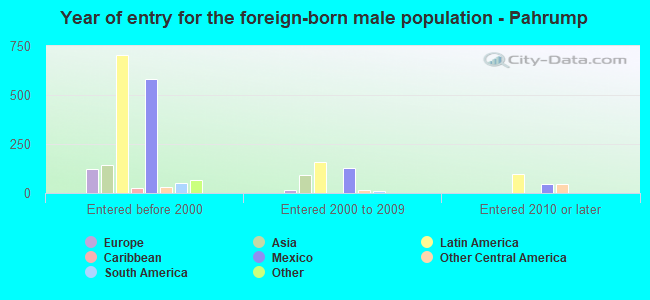
Foreign-born residents in Pahrump 3,387 residents are foreign born (4.2% Latin America , 1.5% Asia , 1.4% Europe ).
This city:
7.4%Nevada:
19.1%
Marital status for residents in Pahrump Marital status - White (Caucasian) population 15 years and over
Males 23.3% Never married54.6% Now married1.1% Separated7.0% Widowed13.9% DivorcedFemales 17.2% Never married50.8% Now married1.7% Separated13.7% Widowed16.6% DivorcedWomen who gave birth in the past 12 months Now married:
65.4% (162)Unmarried:
34.6% (86)
Women who did not give birth in the past 12 months Now married:
44.1% (1,728)Unmarried:
55.9% (2,191)
Marital status - Black or African American population 15 years and over
Males 56.5% Never married28.4% Now married0.0% Separated0.0% Widowed15.1% DivorcedFemales 36.2% Never married26.6% Now married0.0% Separated0.0% Widowed37.2% DivorcedWomen who gave birth in the past 12 months Now married:
100.0% (5)Unmarried:
0.0% (0)
Women who did not give birth in the past 12 months Now married:
8.1% (10)Unmarried:
91.9% (116)
Marital status - American Indian / Alaska Native population 15 years and over
Males 10.4% Never married48.1% Now married0.0% Separated4.1% Widowed37.3% DivorcedFemales 0.0% Never married74.7% Now married0.0% Separated12.3% Widowed13.0% DivorcedWomen who did not give birth in the past 12 months Now married:
100.0% (10)Unmarried:
0.0% (0)
Marital status - Asian population 15 years and over
Males 30.3% Never married62.8% Now married0.0% Separated5.4% Widowed1.6% DivorcedFemales 15.2% Never married59.9% Now married0.7% Separated14.9% Widowed9.3% DivorcedWomen who did not give birth in the past 12 months Now married:
51.1% (108)Unmarried:
48.9% (104)
Marital status - Native Hawaiian / Pacific Islander population 15 years and over
Males 0.0% Never married49.5% Now married0.0% Separated0.0% Widowed50.5% DivorcedFemales 0.0% Never married62.7% Now married0.0% Separated12.7% Widowed24.6% DivorcedWomen who did not give birth in the past 12 months Now married:
100.0% (59)Unmarried:
0.0% (0)
Marital status - Other race population 15 years and over
Males 40.2% Never married50.9% Now married0.0% Separated0.0% Widowed9.0% DivorcedFemales 19.2% Never married52.2% Now married6.8% Separated9.0% Widowed12.8% DivorcedWomen who gave birth in the past 12 months Now married:
100.0% (21)Unmarried:
0.0% (0)
Women who did not give birth in the past 12 months Now married:
63.8% (439)Unmarried:
36.2% (249)
Marital status - Two or more races population 15 years and over
Males 48.4% Never married43.2% Now married0.0% Separated2.7% Widowed5.7% DivorcedFemales 33.8% Never married47.7% Now married3.3% Separated4.3% Widowed10.9% DivorcedWomen who gave birth in the past 12 months Now married:
100.0% (52)Unmarried:
0.0% (0)
Women who did not give birth in the past 12 months Now married:
35.4% (486)Unmarried:
64.6% (886)
Marital status - White alone, not Hispanic / Latino population 15 years and over
Males 23.0% Never married54.9% Now married1.1% Separated7.3% Widowed13.8% DivorcedFemales 16.9% Never married50.1% Now married1.7% Separated14.1% Widowed17.0% DivorcedWomen who gave birth in the past 12 months Now married:
61.1% (149)Unmarried:
38.9% (95)
Women who did not give birth in the past 12 months Now married:
42.3% (1,661)Unmarried:
57.7% (2,262)
Marital status - Hispanic or Latino population 15 years and over
Males 39.7% Never married48.7% Now married0.6% Separated0.8% Widowed10.1% DivorcedFemales 24.2% Never married57.1% Now married3.5% Separated5.8% Widowed9.4% DivorcedWomen who gave birth in the past 12 months Now married:
100.0% (53)Unmarried:
0.0% (0)
Women who did not give birth in the past 12 months Now married:
55.5% (791)Unmarried:
44.5% (634)
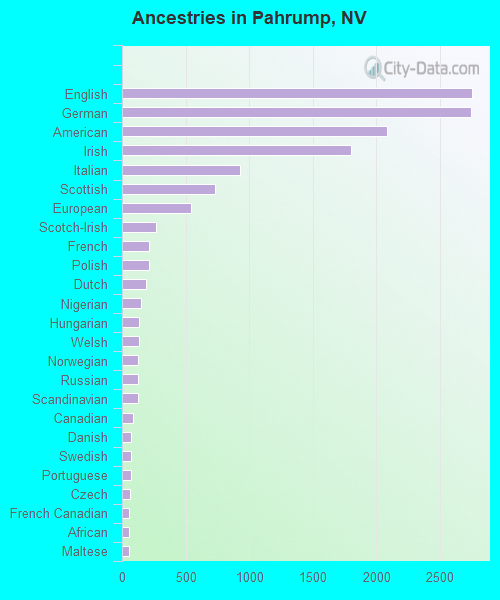
Ancestries in Pahrump
2,750 12.0% English2,747 12.0% German2,088 9.1% American1,798 7.8% Irish929 4.1% Italian730 3.2% Scottish540 2.4% European270 1.2% Scotch-Irish215 0.9% French209 0.9% Polish190 0.8% Dutch151 0.7% Nigerian132 0.6% Hungarian132 0.6% Welsh129 0.6% Norwegian128 0.6% Russian122 0.5% Scandinavian85 0.4% Canadian74 0.3% Danish73 0.3% Swedish68 0.3% Portuguese64 0.3% Czech57 0.2% French Canadian54 0.2% African53 0.2% Maltese43 0.2% Lebanese41 0.2% Greek40 0.2% Swiss37 0.2% Basque24 0.1% Northern European24 0.1% Ukrainian19 0.08% British14 0.06% Belgian11 0.05% Jamaican10 0.04% Slovak9 0.04% Austrian8 0.03% Romanian
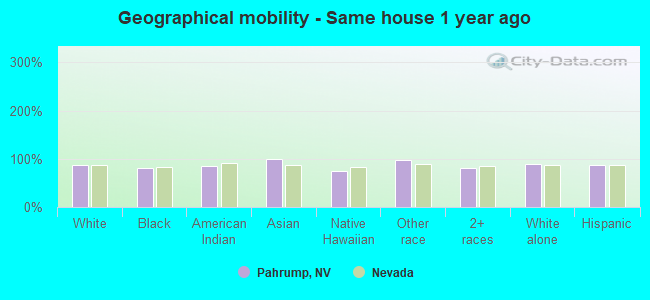
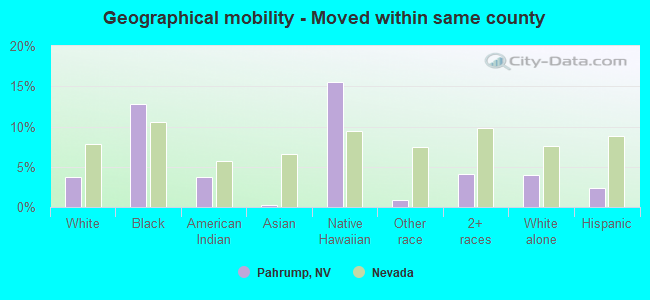
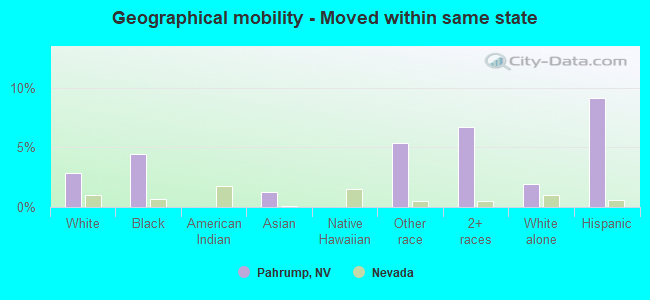
Geographical mobility in Pahrump Same house 1 year ago 26,911 88.3% White (Caucasian)859 80.8% Black or African American386 84.7% American Indian / Alaska Native1,071 99.6% Asian173 75.1% Native Hawaiian / Pacific Islander3,704 97.7% Other race5,174 80.1% Two or more races27,491 88.5% White alone, not Hispanic / Latino6,374 87.3% Hispanic or LatinoMoved within same county 1,150 3.8% White / Caucasian137 12.8% Black or African American17 3.8% American Indian / Alaska Native3 0.2% Asian36 15.5% Native Hawaiian / Pacific Islander32 0.8% Other race266 4.1% Two or more races1,220 3.9% White alone, not Hispanic / Latino177 2.4% Hispanic or LatinoMoved within same state 872 2.9% White / Caucasian47 4.4% Black or African American13 1.2% Asian202 5.3% Other race432 6.7% Two or more races596 1.9% White alone, not Hispanic / Latino668 9.1% Hispanic or LatinoMoved from different state 1,731 5.7% White / Caucasian35 7.7% American Indian / Alaska Native16 1.5% Asian8 3.6% Native Hawaiian / Pacific Islander192 3.0% Two or more races1,834 5.9% White alone, not Hispanic / Latino49 0.7% Hispanic or LatinoMoved from abroad 65 0.2% White83 0.3% White alone, not Hispanic / Latino
Children Nativity (place of birth) in Pahrump
Children under 6 years - Living with two parents Both parents native 1,349 100.0% NativeOne native, one foreign-born parent 181 100.0% NativeChildren under 6 years - Living with one parent Native parent 452 100.0% NativeChildren 6 to 17 years - Living with two parents Both parents native 2,080 100.0% Native1 0.0% Foreign-bornBoth parents foreign-born 314 100.0% NativeOne native, one foreign-born parent 337 98.5% Native5 1.5% Foreign-bornChildren 6 to 17 years - Living with one parent Native parent 1,794 100.0% NativeForeign-born parent 134 50.0% Native134 50.0% Foreign-born
Grandparents responsible for own grandchildren in Pahrump
Grandparents (30 to 59 years) White / Caucasian 101 46.8% Responsible for grandchildren114 53.2% Not responsible for grandchildrenAmerican Indian / Alaska Native 47 100.0% Not responsible for grandchildrenAsian 7 100.0% Not responsible for grandchildrenOther race 114 100.0% Not responsible for grandchildrenTwo or more races 35 100.0% Responsible for grandchildrenWhite alone, not Hispanic / Latino 138 52.0% Responsible for grandchildren127 48.0% Not responsible for grandchildrenHispanic or Latino 157 100.0% Not responsible for grandchildrenGrandparents (60 years and over) White / Caucasian 123 23.1% Responsible for grandchildren410 76.9% Not responsible for grandchildrenOther race 9 19.9% Responsible for grandchildren38 80.1% Not responsible for grandchildrenWhite alone, not Hispanic / Latino 98 17.9% Responsible for grandchildren449 82.1% Not responsible for grandchildrenHispanic or Latino 36 40.4% Responsible for grandchildren53 59.6% Not responsible for grandchildren