Races in Palmyra, New Jersey (NJ) Detailed Stats
Data:
Races - White alone (%)
Races - White alone (% change since 2000)
Races - Black alone (%)
Races - Black alone (% change since 2000)
Races - American Indian alone (%)
Races - American Indian alone (% change since 2000)
Races - Asian alone (%)
Races - Asian alone (% change since 2000)
Races - Hispanic (%)
Races - Hispanic (% change since 2000)
Races - Native Hawaiian and Other Pacific Islander alone (%)
Races - Native Hawaiian and Other Pacific Islander alone (% change since 2000)
Races - Two or more races(%)
Races - Two or more races(% change since 2000)
Races - Other race alone (%)
Races - Other race alone (% change since 2000)
Racial diversity
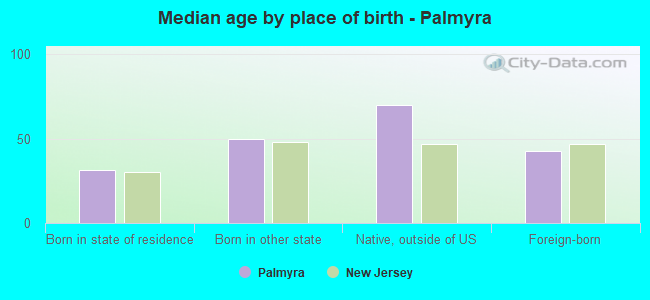
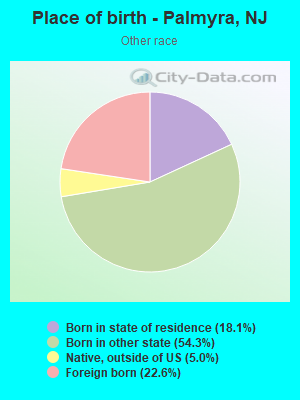
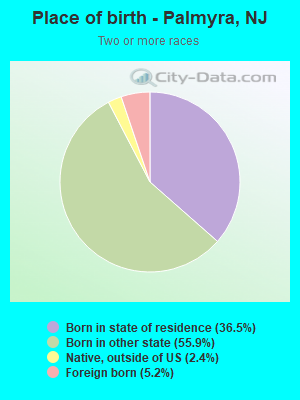
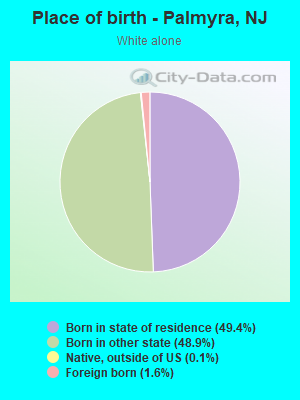
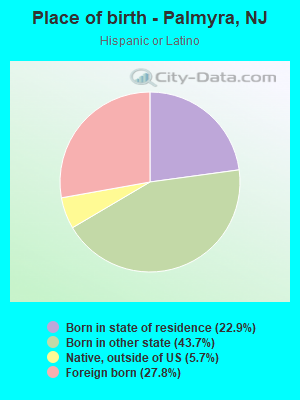
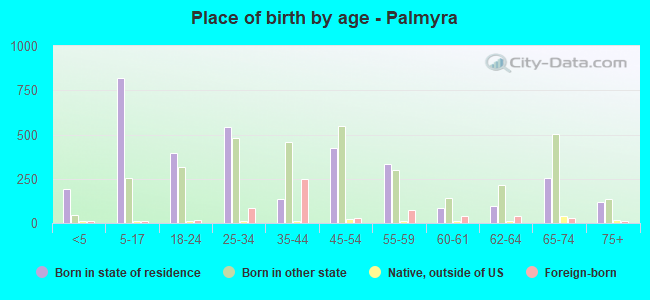
Place of birth - Born in state of residence (%)
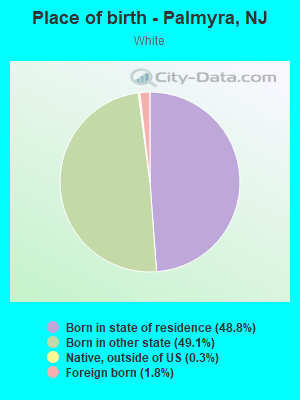
Place of birth - Born in state of residence (%) - White
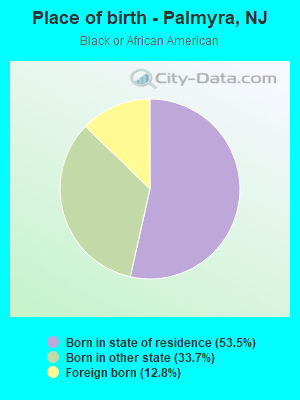
Place of birth - Born in state of residence (%) - Black or African American
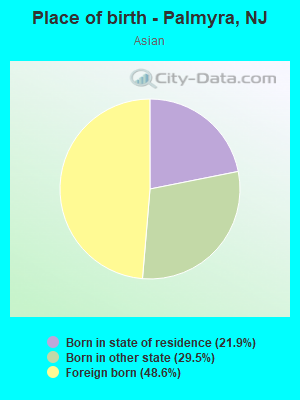
Place of birth - Born in state of residence (%) - Asian
Place of birth - Born in state of residence (%) - Hispanic or Latino
Place of birth - Born in state of residence (%) - American Indian and Alaska Native
Place of birth - Born in state of residence (%) - Multirace
Place of birth - Born in state of residence (%) - Other Race
Place of birth - Born in other state (%)
Place of birth - Born in other state (%) - White
Place of birth - Born in other state (%) - Black or African American
Place of birth - Born in other state (%) - Asian
Place of birth - Born in other state (%) - Hispanic or Latino
Place of birth - Born in other state (%) - American Indian and Alaska Native
Place of birth - Born in other state (%) - Multirace
Place of birth - Born in other state (%) - Other Race
Place of birth - Native, outside of US (%)
Place of birth - Native, outside of US (%) - White
Place of birth - Native, outside of US (%) - Black or African American
Place of birth - Native, outside of US (%) - Asian
Place of birth - Native, outside of US (%) - Hispanic or Latino
Place of birth - Native, outside of US (%) - American Indian and Alaska Native
Place of birth - Native, outside of US (%) - Multirace
Place of birth - Native, outside of US (%) - Other Race
Place of birth - Foreign born (%)
Place of birth - Foreign born (%) - White
Place of birth - Foreign born (%) - Black or African American
Place of birth - Foreign born (%) - Asian
Place of birth - Foreign born (%) - Hispanic or Latino
Place of birth - Foreign born (%) - American Indian and Alaska Native
Place of birth - Foreign born (%) - Multirace
Place of birth - Foreign born (%) - Other Race
Residents speaking English at home (%)
Residents speaking English at home - Born in the United States (%)
Residents speaking English at home - Native, born elsewhere (%)
Residents speaking English at home - Foreign born (%)
Residents speaking Spanish at home (%)
Residents speaking Spanish at home - Born in the United States (%)
Residents speaking Spanish at home - Native, born elsewhere (%)
Residents speaking Spanish at home - Foreign born (%)
Residents speaking other language at home (%)
Residents speaking other language at home - Born in the United States (%)
Residents speaking other language at home - Native, born elsewhere (%)
Residents speaking other language at home - Foreign born (%)
Marital status - Never married (%)
Marital status - Now married (%)
Marital status - Separated (%)
Marital status - Widowed (%)
Marital status - Divorced (%)
Ancestries Reported - Arab (%)
Ancestries Reported - Czech (%)
Ancestries Reported - Danish (%)
Ancestries Reported - Dutch (%)
Ancestries Reported - English (%)
Ancestries Reported - French (%)
Ancestries Reported - French Canadian (%)
Ancestries Reported - German (%)
Ancestries Reported - Greek (%)
Ancestries Reported - Hungarian (%)
Ancestries Reported - Irish (%)
Ancestries Reported - Italian (%)
Ancestries Reported - Lithuanian (%)
Ancestries Reported - Norwegian (%)
Ancestries Reported - Polish (%)
Ancestries Reported - Portuguese (%)
Ancestries Reported - Russian (%)
Ancestries Reported - Scotch-Irish (%)
Ancestries Reported - Scottish (%)
Ancestries Reported - Slovak (%)
Ancestries Reported - Subsaharan African (%)
Ancestries Reported - Swedish (%)
Ancestries Reported - Swiss (%)
Ancestries Reported - Ukrainian (%)
Ancestries Reported - United States (%)
Ancestries Reported - Welsh (%)
Ancestries Reported - West Indian (%)
Ancestries Reported - Other (%)
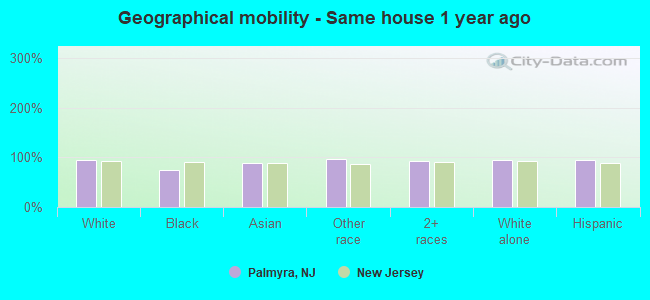
Geographical mobility - Same house 1 year ago (%)
Geographical mobility - Same house 1 year ago (%) - White
Geographical mobility - Same house 1 year ago (%) - Black or African American
Geographical mobility - Same house 1 year ago (%) - Asian
Geographical mobility - Same house 1 year ago (%) - Hispanic or Latino
Geographical mobility - Same house 1 year ago (%) - American Indian and Alaska Native
Geographical mobility - Same house 1 year ago (%) - Multirace
Geographical mobility - Same house 1 year ago (%) - Other Race
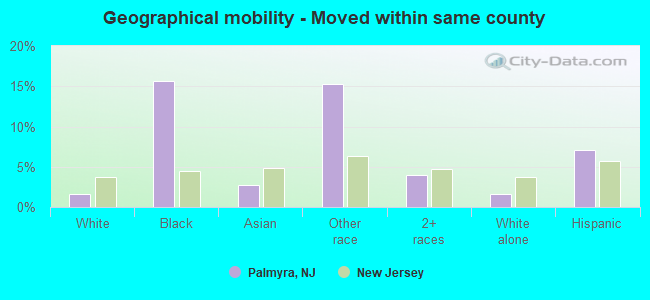
Geographical mobility - Moved within same county (%)
Geographical mobility - Moved within same county (%) - White
Geographical mobility - Moved within same county (%) - Black or African American
Geographical mobility - Moved within same county (%) - Asian
Geographical mobility - Moved within same county (%) - Hispanic or Latino
Geographical mobility - Moved within same county (%) - American Indian and Alaska Native
Geographical mobility - Moved within same county (%) - Multirace
Geographical mobility - Moved within same county (%) - Other Race
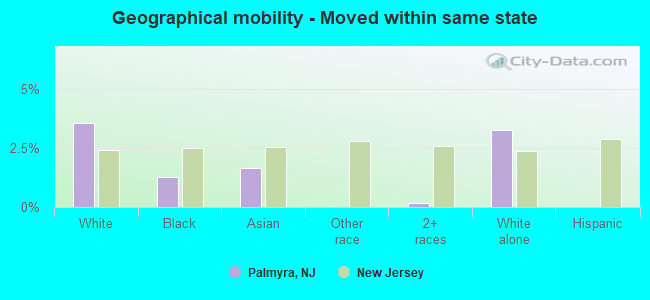
Geographical mobility - Moved from different county within same state (%)
Geographical mobility - Moved from different county within same state (%) - White
Geographical mobility - Moved from different county within same state (%) - Black or African American
Geographical mobility - Moved from different county within same state (%) - Asian
Geographical mobility - Moved from different county within same state (%) - Hispanic or Latino
Geographical mobility - Moved from different county within same state (%) - American Indian and Alaska Native
Geographical mobility - Moved from different county within same state (%) - Multirace
Geographical mobility - Moved from different county within same state (%) - Other Race
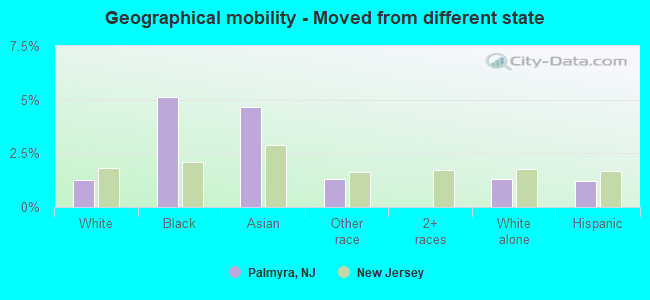
Geographical mobility - Moved from different state (%)
Geographical mobility - Moved from different state (%) - White
Geographical mobility - Moved from different state (%) - Black or African American
Geographical mobility - Moved from different state (%) - Asian
Geographical mobility - Moved from different state (%) - Hispanic or Latino
Geographical mobility - Moved from different state (%) - American Indian and Alaska Native
Geographical mobility - Moved from different state (%) - Multirace
Geographical mobility - Moved from different state (%) - Other Race
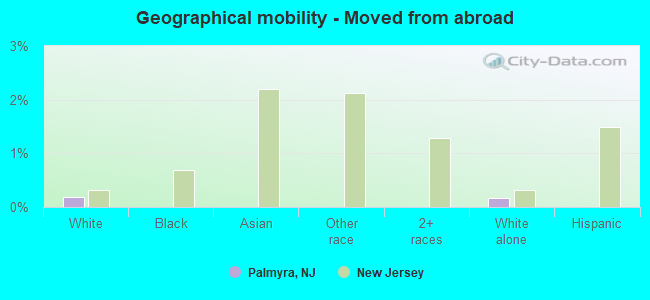
Geographical mobility - Moved from abroad (%)
Geographical mobility - Moved from abroad (%) - White
Geographical mobility - Moved from abroad (%) - Black or African American
Geographical mobility - Moved from abroad (%) - Asian
Geographical mobility - Moved from abroad (%) - Hispanic or Latino
Geographical mobility - Moved from abroad (%) - American Indian and Alaska Native
Geographical mobility - Moved from abroad (%) - Multirace
Geographical mobility - Moved from abroad (%) - Other Race
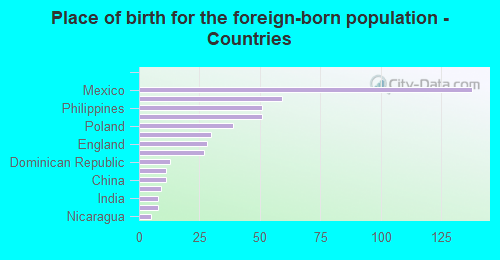
Place of birth for the foreign-born population - Ireland (%)
Place of birth for the foreign-born population - Denmark (%)
Place of birth for the foreign-born population - Norway (%)
Place of birth for the foreign-born population - Sweden (%)
Place of birth for the foreign-born population - United Kingdom (%)
Place of birth for the foreign-born population - England (%)
Place of birth for the foreign-born population - Scotland (%)
Place of birth for the foreign-born population - Other Northern Europe (%)
Place of birth for the foreign-born population - Austria (%)
Place of birth for the foreign-born population - Belgium (%)
Place of birth for the foreign-born population - France (%)
Place of birth for the foreign-born population - Germany (%)
Place of birth for the foreign-born population - Netherlands (%)
Place of birth for the foreign-born population - Switzerland (%)
Place of birth for the foreign-born population - Other Western Europe (%)
Place of birth for the foreign-born population - Greece (%)
Place of birth for the foreign-born population - Italy (%)
Place of birth for the foreign-born population - Portugal (%)
Place of birth for the foreign-born population - Spain (%)
Place of birth for the foreign-born population - Other Southern Europe (%)
Place of birth for the foreign-born population - Albania (%)
Place of birth for the foreign-born population - Belarus (%)
Place of birth for the foreign-born population - Bosnia and Herzegovina (%)
Place of birth for the foreign-born population - Bulgaria (%)
Place of birth for the foreign-born population - Croatia (%)
Place of birth for the foreign-born population - Czechoslovakia (%)
Place of birth for the foreign-born population - Hungary (%)
Place of birth for the foreign-born population - Latvia (%)
Place of birth for the foreign-born population - Lithuania (%)
Place of birth for the foreign-born population - North Macedonia (Macedonia) (%)
Place of birth for the foreign-born population - Moldova (%)
Place of birth for the foreign-born population - Poland (%)
Place of birth for the foreign-born population - Romania (%)
Place of birth for the foreign-born population - Russia (%)
Place of birth for the foreign-born population - Serbia (%)
Place of birth for the foreign-born population - Ukraine (%)
Place of birth for the foreign-born population - Other Eastern Europe (%)
Place of birth for the foreign-born population - China (%)
Place of birth for the foreign-born population - Hong Kong (%)
Place of birth for the foreign-born population - Taiwan (%)
Place of birth for the foreign-born population - Japan (%)
Place of birth for the foreign-born population - Korea (%)
Place of birth for the foreign-born population - Other Eastern Asia (%)
Place of birth for the foreign-born population - Afghanistan (%)
Place of birth for the foreign-born population - Bangladesh (%)
Place of birth for the foreign-born population - India (%)
Place of birth for the foreign-born population - Iran (%)
Place of birth for the foreign-born population - Kazakhstan (%)
Place of birth for the foreign-born population - Nepal (%)
Place of birth for the foreign-born population - Pakistan (%)
Place of birth for the foreign-born population - Sri Lanka (%)
Place of birth for the foreign-born population - Uzbekistan (%)
Place of birth for the foreign-born population - Other South Central Asia (%)
Place of birth for the foreign-born population - Burma (%)
Place of birth for the foreign-born population - Cambodia (%)
Place of birth for the foreign-born population - Indonesia (%)
Place of birth for the foreign-born population - Laos (%)
Place of birth for the foreign-born population - Malaysia (%)
Place of birth for the foreign-born population - Philippines (%)
Place of birth for the foreign-born population - Singapore (%)
Place of birth for the foreign-born population - Thailand (%)
Place of birth for the foreign-born population - Vietnam (%)
Place of birth for the foreign-born population - Other South Eastern Asia (%)
Place of birth for the foreign-born population - Armenia (%)
Place of birth for the foreign-born population - Iraq (%)
Place of birth for the foreign-born population - Israel (%)
Place of birth for the foreign-born population - Jordan (%)
Place of birth for the foreign-born population - Kuwait (%)
Place of birth for the foreign-born population - Lebanon (%)
Place of birth for the foreign-born population - Saudi Arabia (%)
Place of birth for the foreign-born population - Syria (%)
Place of birth for the foreign-born population - Turkey (%)
Place of birth for the foreign-born population - Yemen (%)
Place of birth for the foreign-born population - Other Western Asia (%)
Place of birth for the foreign-born population - Eritrea (%)
Place of birth for the foreign-born population - Ethiopia (%)
Place of birth for the foreign-born population - Kenya (%)
Place of birth for the foreign-born population - Somalia (%)
Place of birth for the foreign-born population - Uganda (%)
Place of birth for the foreign-born population - Zimbabwe (%)
Place of birth for the foreign-born population - Other Eastern Africa (%)
Place of birth for the foreign-born population - Cameroon (%)
Place of birth for the foreign-born population - Congo (%)
Place of birth for the foreign-born population - Democratic Republic of Congo (Zaire) (%)
Place of birth for the foreign-born population - Other Middle Africa (%)
Place of birth for the foreign-born population - Egypt (%)
Place of birth for the foreign-born population - Morocco (%)
Place of birth for the foreign-born population - Sudan (%)
Place of birth for the foreign-born population - Other Northern Africa (%)
Place of birth for the foreign-born population - South Africa (%)
Place of birth for the foreign-born population - Other Southern Africa (%)
Place of birth for the foreign-born population - Cabo Verde (%)
Place of birth for the foreign-born population - Ghana (%)
Place of birth for the foreign-born population - Liberia (%)
Place of birth for the foreign-born population - Nigeria (%)
Place of birth for the foreign-born population - Senegal (%)
Place of birth for the foreign-born population - Sierra Leone (%)
Place of birth for the foreign-born population - Other Western Africa (%)
Place of birth for the foreign-born population - Australia (%)
Place of birth for the foreign-born population - New Zealand (%)
Place of birth for the foreign-born population - Fiji (%)
Place of birth for the foreign-born population - Micronesia (%)
Place of birth for the foreign-born population - Bahamas (%)
Place of birth for the foreign-born population - Barbados (%)
Place of birth for the foreign-born population - Cuba (%)
Place of birth for the foreign-born population - Dominica (%)
Place of birth for the foreign-born population - Dominican Republic (%)
Place of birth for the foreign-born population - Grenada (%)
Place of birth for the foreign-born population - Haiti (%)
Place of birth for the foreign-born population - Jamaica (%)
Place of birth for the foreign-born population - St. Vincent and the Grenadines (%)
Place of birth for the foreign-born population - Trinidad and Tobago (%)
Place of birth for the foreign-born population - West Indies (%)
Place of birth for the foreign-born population - Other Caribbean (%)
Place of birth for the foreign-born population - Belize (%)
Place of birth for the foreign-born population - Costa Rica (%)
Place of birth for the foreign-born population - El Salvador (%)
Place of birth for the foreign-born population - Guatemala (%)
Place of birth for the foreign-born population - Honduras (%)
Place of birth for the foreign-born population - Mexico (%)
Place of birth for the foreign-born population - Nicaragua (%)
Place of birth for the foreign-born population - Panama (%)
Place of birth for the foreign-born population - Other Central America (%)
Place of birth for the foreign-born population - Argentina (%)
Place of birth for the foreign-born population - Bolivia (%)
Place of birth for the foreign-born population - Brazil (%)
Place of birth for the foreign-born population - Chile (%)
Place of birth for the foreign-born population - Colombia (%)
Place of birth for the foreign-born population - Ecuador (%)
Place of birth for the foreign-born population - Guyana (%)
Place of birth for the foreign-born population - Peru (%)
Place of birth for the foreign-born population - Uruguay (%)
Place of birth for the foreign-born population - Venezuela (%)
Place of birth for the foreign-born population - Other South America (%)
Place of birth for the foreign-born population - Canada (%)
Place of birth for the foreign-born population - Other Northern America (%)
Place of birth for the foreign-born population - Other (%)
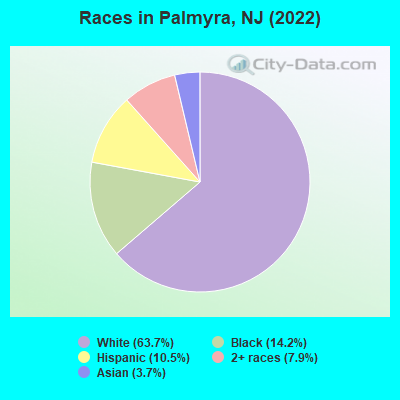
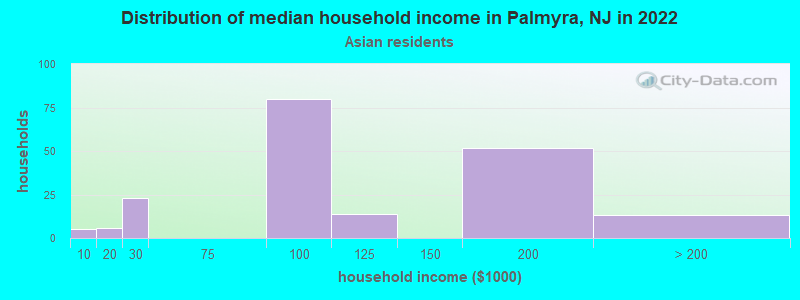
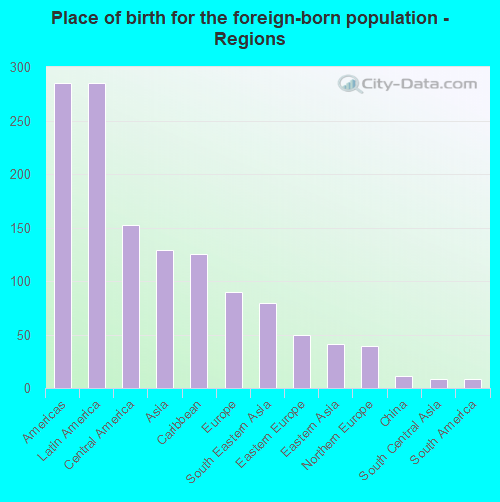
According to 2022 data, the most numerous races in Palmyra, NJ are White alone (4,782 residents), Hispanic (789 residents), and Black alone (1,067 residents). 88.5% of Palmyra residents speak English at home. 6.7% of Palmyra, NJ residents are foreign-born (3.8% born in Latin America, 1.7% born in Asia, 1.2% born in Europe), which is 241.8% less than the foreign-born rate of 23.0% across the entire state of New Jersey.
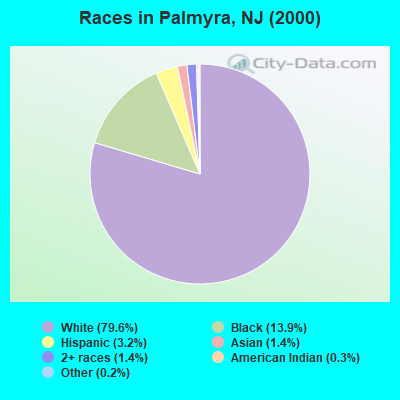
Race distribution in Palmyra
2000 2022
5,557,209 66.0% White alone 1,117,191 13.3% Hispanic 1,096,171 13.0% Black alone 477,012 5.7% Asian alone 133,689 1.6% Two or more races 19,565 0.2% Other race alone 11,338 0.1% American Indian alone 2,175 0.03% Native Hawaiian and Other
4,766,476 51.5% White alone 2,028,470 21.9% Hispanic 1,111,632 12.0% Black alone 923,546 10.0% Asian alone 332,237 3.6% Two or more races 89,847 1.0% Other race alone 8,557 0.09% American Indian alone 934 0.01% Native Hawaiian and Other
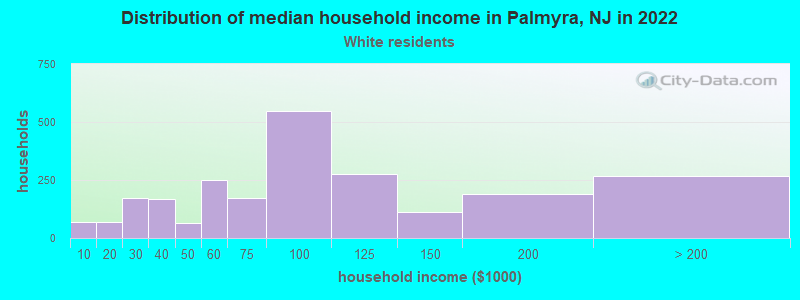
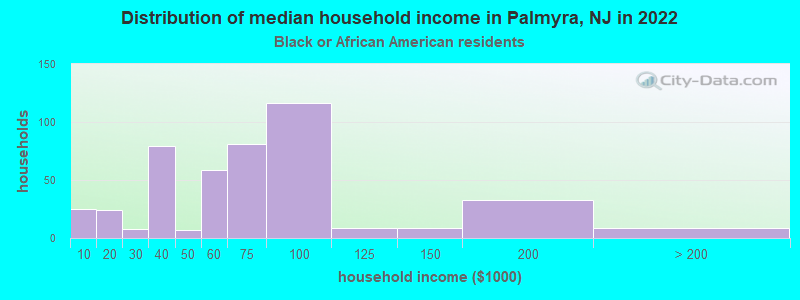
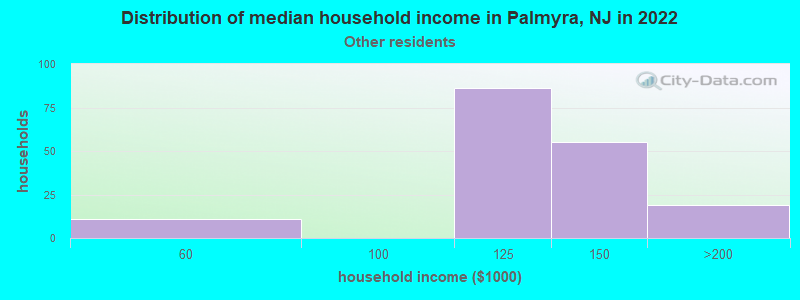
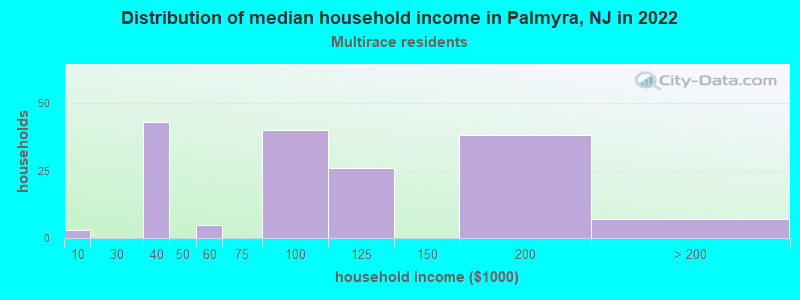
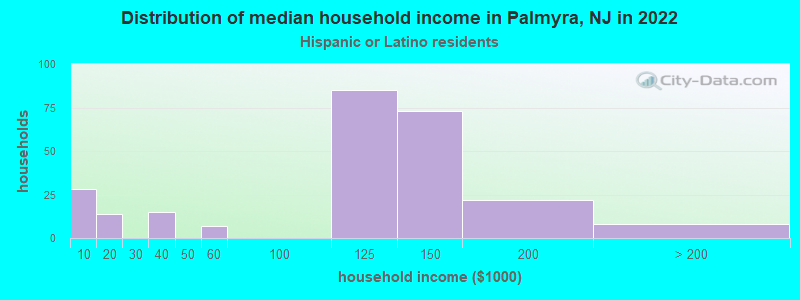
Income and house value in Palmyra Median household income in 2022 $81,565 White non-Hispanic householders$73,122 Black householders$104,245 Asian householders$152,385 Some other race householders$106,178 Two or more races householders$133,812 Hispanic or Latino race householdersMedian 2022 house value $221,759 White Non-Hispanic householders$201,056 Black or African American householders $205,236 Asian householders$223,948 Some other race householders$221,560 Two or more races householders$223,948 Hispanic or Latino householders
Median age by race in Palmyra
50.4 Median age for White residents47.7 51.8 51.4 Median age for Black or African American residents42.3 51.7 -676,272,813.9 Median age for American Indian / Alaska Native residents-670,465,336.5 -688,298,917.7 35.6 Median age for Asian residents25.0 36.5 -866,479,924.4 Median age for Native Hawaiian / Pacific Islander residents-866,479,924.4 -713,070,378.3 35.8 Median age for Other race residents40.8 21.4 24.4 Median age for Two or more races residents22.1 25.6 50.1 Median age for White alone residents46.9 51.8 29.6 Median age for Hispanic or Latino residents44.9 22.9
Owner/renter occupied households by race in Palmyra
House owners and renters - White residents 1,840 79.7% Owner occupied469 20.3% Renter occupiedHouse owners and renters - Black or African American residents 233 51.1% Owner occupied223 48.9% Renter occupiedHouse owners and renters - Asian residents 99 66.7% Owner occupied49 33.3% Renter occupiedHouse owners and renters - Other race residents 172 94.4% Owner occupied10 5.6% Renter occupiedHouse owners and renters - Two or more races residents 130 80.6% Owner occupied31 19.4% Renter occupiedHouse owners and renters - White alone residents 1,817 79.3% Owner occupied474 20.7% Renter occupiedHouse owners and renters - Hispanic or Latino residents 194 87.8% Owner occupied27 12.2% Renter occupied
Language usage in Palmyra
English speakers - Total 88.5% of residents of Palmyra speak English at home.
7.3% of residents speak Spanish at home 356 67.0% Speak English very well175 33.0% Speak English less than very well4.4% of residents speak other language at home 202 62.9% Speak English very well119 37.1% Speak English less than very well
English speakers - Born in the United States 92.8% of residents of Palmyra speak English at home.
6.9% of residents speak Spanish at home 157 67.4% Speak English very well76 32.6% Speak English less than very well1.0% of residents speak other language at home 34 100.0% Speak English very well
English speakers - Native, born elsewhere 7.8% of residents of Palmyra speak English at home.
87.5% of residents speak Spanish at home 52 92.9% Speak English very well4 7.1% Speak English less than very well28.1% of residents speak other language at home 2 11.1% Speak English very well16 88.9% Speak English less than very well
English speakers - Foreign-born 35.3% of residents of Palmyra speak English at home.
34.4% of residents speak Spanish at home 114 58.5% Speak English very well81 41.5% Speak English less than very well33.0% of residents speak other language at home 79 42.2% Speak English very well108 57.8% Speak English less than very well
White (Caucasian) - Speak only English Native:
98.7% (4,561)Foreign-born:
47.8% (42)
White (Caucasian) - Speak another language Native:
1.6% (76)Foreign-born:
48.2% (42)
Black or African American - Speak only English Native:
98.0% (908)Foreign-born:
85.5% (117)
Black or African American - Speak another language Native:
2.3% (21)Foreign-born:
13.8% (19)
Asian - Speak only English Native:
82.1% (109)Foreign-born:
13.2% (17)
Asian - Speak another language Native:
23.8% (32)Foreign-born:
86.1% (112)
Other race - Speak another language Native:
62.7% (291)Foreign-born:
100.0% (150)
Two or more races - Speak only English Native:
85.0% (511)Foreign-born:
51.9% (19)
Two or more races - Speak another language Native:
14.9% (90)Foreign-born:
47.4% (17)
White alone - Speak only English Native:
99.2% (4,544)Foreign-born:
53.6% (40)
White alone - Speak another language Native:
1.0% (46)Foreign-born:
44.4% (33)
Hispanic or Latino - Speak only English Native:
44.3% (251)Foreign-born:
9.0% (20)
Hispanic or Latino - Speak another language Native:
55.3% (313)Foreign-born:
85.2% (190)
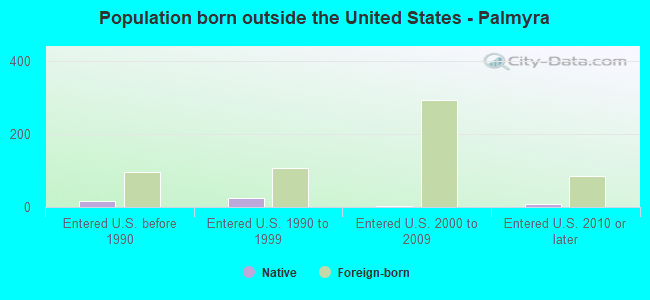
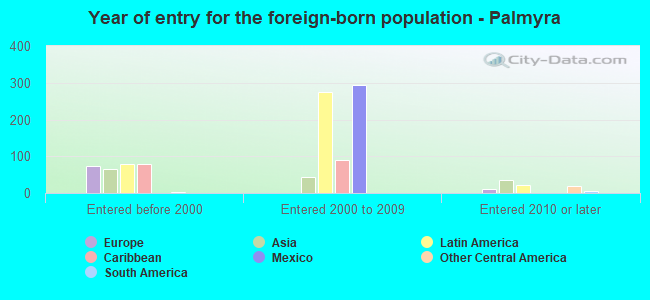
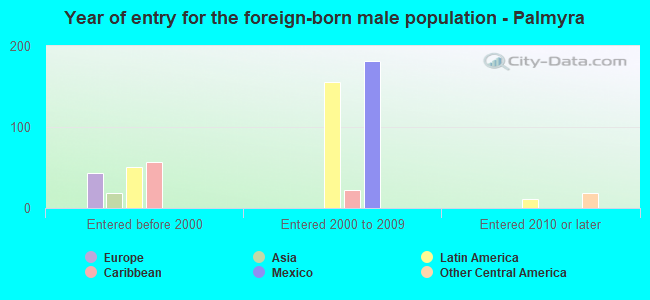
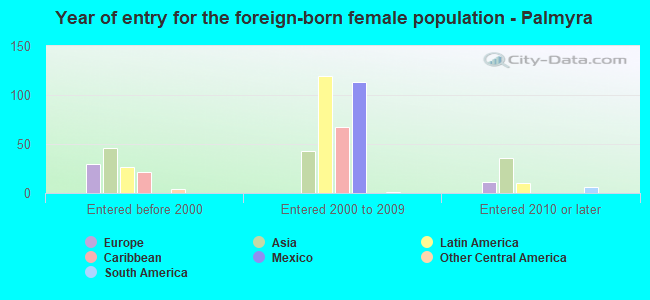
Foreign-born residents in Palmyra 505 residents are foreign born (3.8% Latin America , 1.7% Asia , 1.2% Europe ).
This city:
6.7%New Jersey:
23.2%
Marital status for residents in Palmyra Marital status - White (Caucasian) population 15 years and over
Males 39.3% Never married48.2% Now married0.9% Separated4.0% Widowed7.5% DivorcedFemales 30.6% Never married43.3% Now married3.4% Separated7.5% Widowed15.2% DivorcedWomen who gave birth in the past 12 months Now married:
89.3% (47)Unmarried:
10.7% (6)
Women who did not give birth in the past 12 months Now married:
40.7% (361)Unmarried:
59.3% (526)
Marital status - Black or African American population 15 years and over
Males 42.6% Never married38.3% Now married2.7% Separated9.8% Widowed6.6% DivorcedFemales 54.0% Never married21.0% Now married0.0% Separated6.5% Widowed18.4% DivorcedWomen who gave birth in the past 12 months Now married:
0.0% (0)Unmarried:
100.0% (16)
Women who did not give birth in the past 12 months Now married:
7.0% (18)Unmarried:
93.0% (242)
Marital status - Asian population 15 years and over
Males 60.0% Never married31.7% Now married0.0% Separated0.0% Widowed8.3% DivorcedFemales 29.7% Never married45.2% Now married0.0% Separated0.0% Widowed25.2% DivorcedWomen who did not give birth in the past 12 months Now married:
44.7% (59)Unmarried:
55.3% (73)
Marital status - Other race population 15 years and over
Males 76.6% Never married23.4% Now married0.0% Separated0.0% Widowed0.0% DivorcedFemales 71.3% Never married22.6% Now married0.0% Separated6.1% Widowed0.0% DivorcedWomen who did not give birth in the past 12 months Now married:
24.1% (66)Unmarried:
75.9% (207)
Marital status - Two or more races population 15 years and over
Males 65.5% Never married21.0% Now married0.0% Separated0.0% Widowed13.5% DivorcedFemales 89.4% Never married9.2% Now married0.0% Separated0.0% Widowed1.4% DivorcedWomen who did not give birth in the past 12 months Now married:
7.4% (17)Unmarried:
92.6% (215)
Marital status - White alone, not Hispanic / Latino population 15 years and over
Males 39.7% Never married48.2% Now married1.0% Separated3.4% Widowed7.7% DivorcedFemales 30.3% Never married43.5% Now married3.5% Separated7.6% Widowed15.1% DivorcedWomen who gave birth in the past 12 months Now married:
89.3% (47)Unmarried:
10.7% (6)
Women who did not give birth in the past 12 months Now married:
40.9% (356)Unmarried:
59.1% (516)
Marital status - Hispanic or Latino population 15 years and over
Males 64.6% Never married27.7% Now married0.0% Separated7.7% Widowed0.0% DivorcedFemales 69.5% Never married23.7% Now married0.0% Separated4.1% Widowed2.7% DivorcedWomen who did not give birth in the past 12 months Now married:
22.4% (77)Unmarried:
77.6% (267)
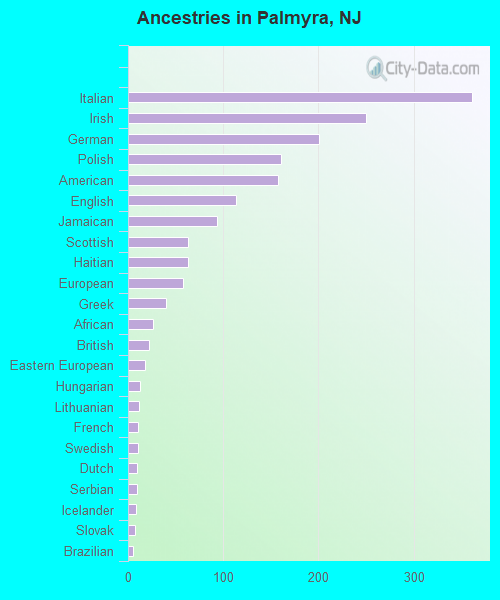
Ancestries in Palmyra
361 12.7% Italian250 8.8% Irish201 7.1% German161 5.7% Polish157 5.5% American113 4.0% English93 3.3% Jamaican63 2.2% Scottish63 2.2% Haitian58 2.0% European40 1.4% Greek26 0.9% African22 0.8% British18 0.6% Eastern European13 0.5% Hungarian12 0.4% Lithuanian10 0.4% French10 0.4% Swedish9 0.3% Dutch9 0.3% Serbian8 0.3% Icelander7 0.2% Slovak5 0.2% Brazilian
Children Nativity (place of birth) in Palmyra
Children under 6 years - Living with two parents Both parents native 139 100.0% NativeChildren under 6 years - Living with one parent Native parent 113 100.0% NativeForeign-born parent 18 100.0% NativeChildren 6 to 17 years - Living with two parents Both parents native 518 100.0% NativeOne native, one foreign-born parent 38 100.0% NativeChildren 6 to 17 years - Living with one parent Native parent 253 100.0% NativeForeign-born parent 196 52.6% Native177 47.4% Foreign-born
Grandparents responsible for own grandchildren in Palmyra
Grandparents (30 to 59 years) Two or more races 4 100.0% Not responsible for grandchildren
Grandparents (60 years and over)