Races in Palos Heights, Illinois (IL) Detailed Stats
Data:
Races - White alone (%)
Races - White alone (% change since 2000)
Races - Black alone (%)
Races - Black alone (% change since 2000)
Races - American Indian alone (%)
Races - American Indian alone (% change since 2000)
Races - Asian alone (%)
Races - Asian alone (% change since 2000)
Races - Hispanic (%)
Races - Hispanic (% change since 2000)
Races - Native Hawaiian and Other Pacific Islander alone (%)
Races - Native Hawaiian and Other Pacific Islander alone (% change since 2000)
Races - Two or more races(%)
Races - Two or more races(% change since 2000)
Races - Other race alone (%)
Races - Other race alone (% change since 2000)
Racial diversity
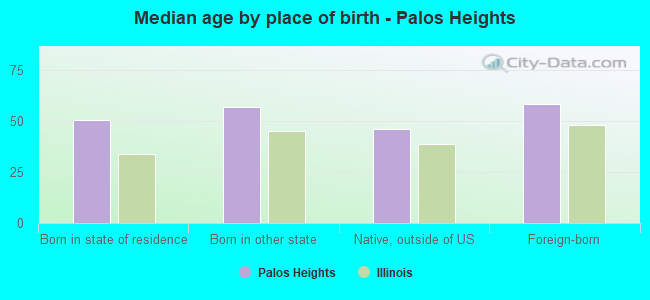
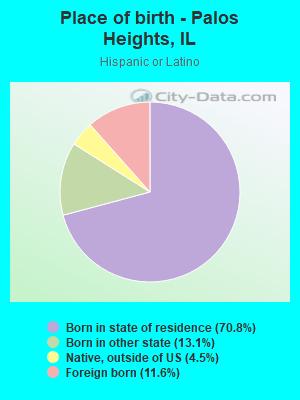
Place of birth - Born in state of residence (%)
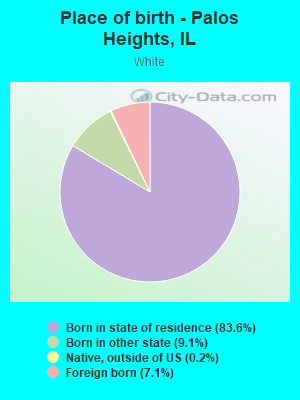
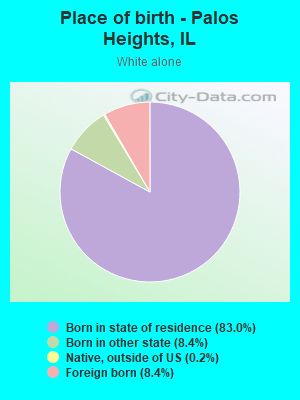
Place of birth - Born in state of residence (%) - White
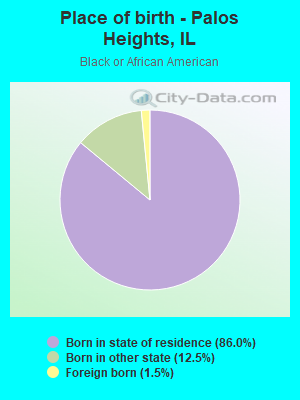
Place of birth - Born in state of residence (%) - Black or African American
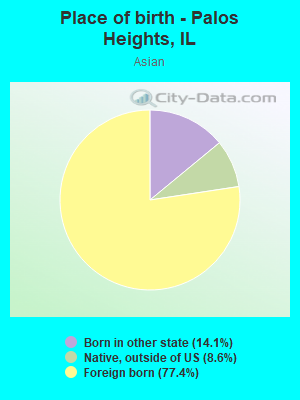
Place of birth - Born in state of residence (%) - Asian
Place of birth - Born in state of residence (%) - Hispanic or Latino
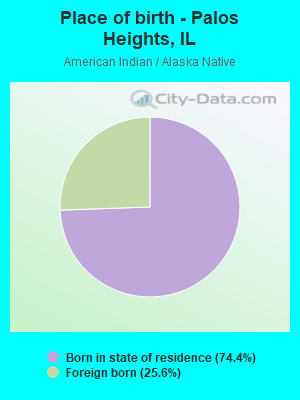
Place of birth - Born in state of residence (%) - American Indian and Alaska Native
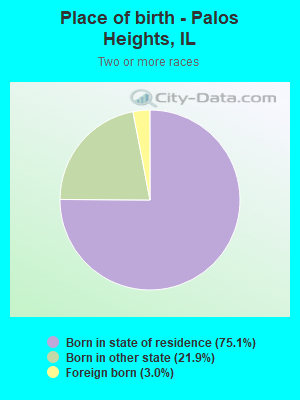
Place of birth - Born in state of residence (%) - Multirace
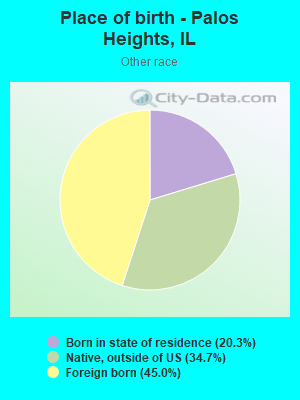
Place of birth - Born in state of residence (%) - Other Race
Place of birth - Born in other state (%)
Place of birth - Born in other state (%) - White
Place of birth - Born in other state (%) - Black or African American
Place of birth - Born in other state (%) - Asian
Place of birth - Born in other state (%) - Hispanic or Latino
Place of birth - Born in other state (%) - American Indian and Alaska Native
Place of birth - Born in other state (%) - Multirace
Place of birth - Born in other state (%) - Other Race
Place of birth - Native, outside of US (%)
Place of birth - Native, outside of US (%) - White
Place of birth - Native, outside of US (%) - Black or African American
Place of birth - Native, outside of US (%) - Asian
Place of birth - Native, outside of US (%) - Hispanic or Latino
Place of birth - Native, outside of US (%) - American Indian and Alaska Native
Place of birth - Native, outside of US (%) - Multirace
Place of birth - Native, outside of US (%) - Other Race
Place of birth - Foreign born (%)
Place of birth - Foreign born (%) - White
Place of birth - Foreign born (%) - Black or African American
Place of birth - Foreign born (%) - Asian
Place of birth - Foreign born (%) - Hispanic or Latino
Place of birth - Foreign born (%) - American Indian and Alaska Native
Place of birth - Foreign born (%) - Multirace
Place of birth - Foreign born (%) - Other Race
Residents speaking English at home (%)
Residents speaking English at home - Born in the United States (%)
Residents speaking English at home - Native, born elsewhere (%)
Residents speaking English at home - Foreign born (%)
Residents speaking Spanish at home (%)
Residents speaking Spanish at home - Born in the United States (%)
Residents speaking Spanish at home - Native, born elsewhere (%)
Residents speaking Spanish at home - Foreign born (%)
Residents speaking other language at home (%)
Residents speaking other language at home - Born in the United States (%)
Residents speaking other language at home - Native, born elsewhere (%)
Residents speaking other language at home - Foreign born (%)
Marital status - Never married (%)
Marital status - Now married (%)
Marital status - Separated (%)
Marital status - Widowed (%)
Marital status - Divorced (%)
Ancestries Reported - Arab (%)
Ancestries Reported - Czech (%)
Ancestries Reported - Danish (%)
Ancestries Reported - Dutch (%)
Ancestries Reported - English (%)
Ancestries Reported - French (%)
Ancestries Reported - French Canadian (%)
Ancestries Reported - German (%)
Ancestries Reported - Greek (%)
Ancestries Reported - Hungarian (%)
Ancestries Reported - Irish (%)
Ancestries Reported - Italian (%)
Ancestries Reported - Lithuanian (%)
Ancestries Reported - Norwegian (%)
Ancestries Reported - Polish (%)
Ancestries Reported - Portuguese (%)
Ancestries Reported - Russian (%)
Ancestries Reported - Scotch-Irish (%)
Ancestries Reported - Scottish (%)
Ancestries Reported - Slovak (%)
Ancestries Reported - Subsaharan African (%)
Ancestries Reported - Swedish (%)
Ancestries Reported - Swiss (%)
Ancestries Reported - Ukrainian (%)
Ancestries Reported - United States (%)
Ancestries Reported - Welsh (%)
Ancestries Reported - West Indian (%)
Ancestries Reported - Other (%)
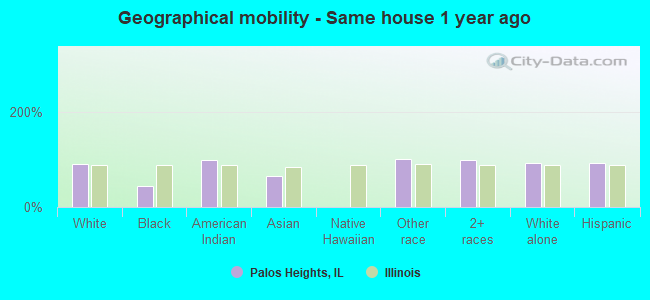
Geographical mobility - Same house 1 year ago (%)
Geographical mobility - Same house 1 year ago (%) - White
Geographical mobility - Same house 1 year ago (%) - Black or African American
Geographical mobility - Same house 1 year ago (%) - Asian
Geographical mobility - Same house 1 year ago (%) - Hispanic or Latino
Geographical mobility - Same house 1 year ago (%) - American Indian and Alaska Native
Geographical mobility - Same house 1 year ago (%) - Multirace
Geographical mobility - Same house 1 year ago (%) - Other Race
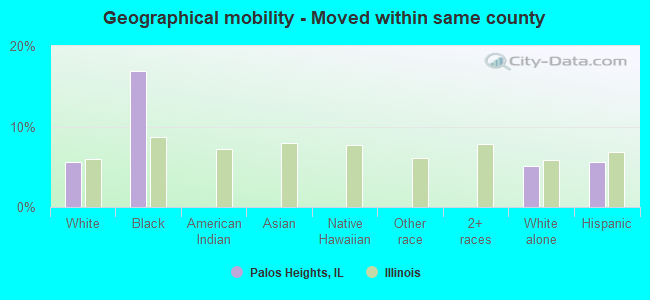
Geographical mobility - Moved within same county (%)
Geographical mobility - Moved within same county (%) - White
Geographical mobility - Moved within same county (%) - Black or African American
Geographical mobility - Moved within same county (%) - Asian
Geographical mobility - Moved within same county (%) - Hispanic or Latino
Geographical mobility - Moved within same county (%) - American Indian and Alaska Native
Geographical mobility - Moved within same county (%) - Multirace
Geographical mobility - Moved within same county (%) - Other Race
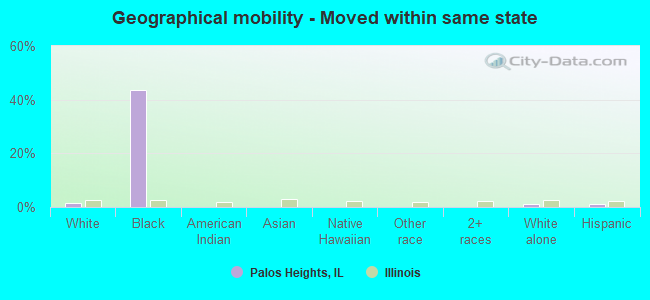
Geographical mobility - Moved from different county within same state (%)
Geographical mobility - Moved from different county within same state (%) - White
Geographical mobility - Moved from different county within same state (%) - Black or African American
Geographical mobility - Moved from different county within same state (%) - Asian
Geographical mobility - Moved from different county within same state (%) - Hispanic or Latino
Geographical mobility - Moved from different county within same state (%) - American Indian and Alaska Native
Geographical mobility - Moved from different county within same state (%) - Multirace
Geographical mobility - Moved from different county within same state (%) - Other Race
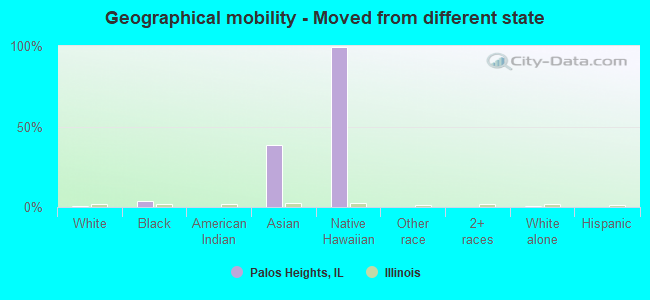
Geographical mobility - Moved from different state (%)
Geographical mobility - Moved from different state (%) - White
Geographical mobility - Moved from different state (%) - Black or African American
Geographical mobility - Moved from different state (%) - Asian
Geographical mobility - Moved from different state (%) - Hispanic or Latino
Geographical mobility - Moved from different state (%) - American Indian and Alaska Native
Geographical mobility - Moved from different state (%) - Multirace
Geographical mobility - Moved from different state (%) - Other Race
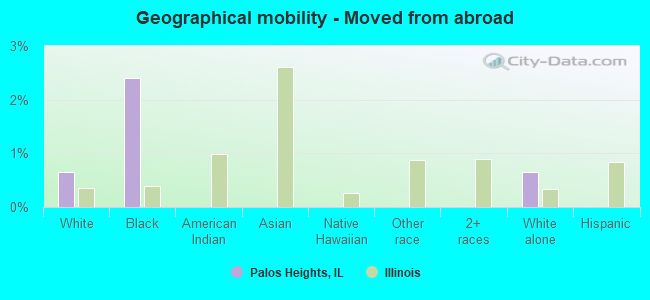
Geographical mobility - Moved from abroad (%)
Geographical mobility - Moved from abroad (%) - White
Geographical mobility - Moved from abroad (%) - Black or African American
Geographical mobility - Moved from abroad (%) - Asian
Geographical mobility - Moved from abroad (%) - Hispanic or Latino
Geographical mobility - Moved from abroad (%) - American Indian and Alaska Native
Geographical mobility - Moved from abroad (%) - Multirace
Geographical mobility - Moved from abroad (%) - Other Race
Place of birth for the foreign-born population - Ireland (%)
Place of birth for the foreign-born population - Denmark (%)
Place of birth for the foreign-born population - Norway (%)
Place of birth for the foreign-born population - Sweden (%)
Place of birth for the foreign-born population - United Kingdom (%)
Place of birth for the foreign-born population - England (%)
Place of birth for the foreign-born population - Scotland (%)
Place of birth for the foreign-born population - Other Northern Europe (%)
Place of birth for the foreign-born population - Austria (%)
Place of birth for the foreign-born population - Belgium (%)
Place of birth for the foreign-born population - France (%)
Place of birth for the foreign-born population - Germany (%)
Place of birth for the foreign-born population - Netherlands (%)
Place of birth for the foreign-born population - Switzerland (%)
Place of birth for the foreign-born population - Other Western Europe (%)
Place of birth for the foreign-born population - Greece (%)
Place of birth for the foreign-born population - Italy (%)
Place of birth for the foreign-born population - Portugal (%)
Place of birth for the foreign-born population - Spain (%)
Place of birth for the foreign-born population - Other Southern Europe (%)
Place of birth for the foreign-born population - Albania (%)
Place of birth for the foreign-born population - Belarus (%)
Place of birth for the foreign-born population - Bosnia and Herzegovina (%)
Place of birth for the foreign-born population - Bulgaria (%)
Place of birth for the foreign-born population - Croatia (%)
Place of birth for the foreign-born population - Czechoslovakia (%)
Place of birth for the foreign-born population - Hungary (%)
Place of birth for the foreign-born population - Latvia (%)
Place of birth for the foreign-born population - Lithuania (%)
Place of birth for the foreign-born population - North Macedonia (Macedonia) (%)
Place of birth for the foreign-born population - Moldova (%)
Place of birth for the foreign-born population - Poland (%)
Place of birth for the foreign-born population - Romania (%)
Place of birth for the foreign-born population - Russia (%)
Place of birth for the foreign-born population - Serbia (%)
Place of birth for the foreign-born population - Ukraine (%)
Place of birth for the foreign-born population - Other Eastern Europe (%)
Place of birth for the foreign-born population - China (%)
Place of birth for the foreign-born population - Hong Kong (%)
Place of birth for the foreign-born population - Taiwan (%)
Place of birth for the foreign-born population - Japan (%)
Place of birth for the foreign-born population - Korea (%)
Place of birth for the foreign-born population - Other Eastern Asia (%)
Place of birth for the foreign-born population - Afghanistan (%)
Place of birth for the foreign-born population - Bangladesh (%)
Place of birth for the foreign-born population - India (%)
Place of birth for the foreign-born population - Iran (%)
Place of birth for the foreign-born population - Kazakhstan (%)
Place of birth for the foreign-born population - Nepal (%)
Place of birth for the foreign-born population - Pakistan (%)
Place of birth for the foreign-born population - Sri Lanka (%)
Place of birth for the foreign-born population - Uzbekistan (%)
Place of birth for the foreign-born population - Other South Central Asia (%)
Place of birth for the foreign-born population - Burma (%)
Place of birth for the foreign-born population - Cambodia (%)
Place of birth for the foreign-born population - Indonesia (%)
Place of birth for the foreign-born population - Laos (%)
Place of birth for the foreign-born population - Malaysia (%)
Place of birth for the foreign-born population - Philippines (%)
Place of birth for the foreign-born population - Singapore (%)
Place of birth for the foreign-born population - Thailand (%)
Place of birth for the foreign-born population - Vietnam (%)
Place of birth for the foreign-born population - Other South Eastern Asia (%)
Place of birth for the foreign-born population - Armenia (%)
Place of birth for the foreign-born population - Iraq (%)
Place of birth for the foreign-born population - Israel (%)
Place of birth for the foreign-born population - Jordan (%)
Place of birth for the foreign-born population - Kuwait (%)
Place of birth for the foreign-born population - Lebanon (%)
Place of birth for the foreign-born population - Saudi Arabia (%)
Place of birth for the foreign-born population - Syria (%)
Place of birth for the foreign-born population - Turkey (%)
Place of birth for the foreign-born population - Yemen (%)
Place of birth for the foreign-born population - Other Western Asia (%)
Place of birth for the foreign-born population - Eritrea (%)
Place of birth for the foreign-born population - Ethiopia (%)
Place of birth for the foreign-born population - Kenya (%)
Place of birth for the foreign-born population - Somalia (%)
Place of birth for the foreign-born population - Uganda (%)
Place of birth for the foreign-born population - Zimbabwe (%)
Place of birth for the foreign-born population - Other Eastern Africa (%)
Place of birth for the foreign-born population - Cameroon (%)
Place of birth for the foreign-born population - Congo (%)
Place of birth for the foreign-born population - Democratic Republic of Congo (Zaire) (%)
Place of birth for the foreign-born population - Other Middle Africa (%)
Place of birth for the foreign-born population - Egypt (%)
Place of birth for the foreign-born population - Morocco (%)
Place of birth for the foreign-born population - Sudan (%)
Place of birth for the foreign-born population - Other Northern Africa (%)
Place of birth for the foreign-born population - South Africa (%)
Place of birth for the foreign-born population - Other Southern Africa (%)
Place of birth for the foreign-born population - Cabo Verde (%)
Place of birth for the foreign-born population - Ghana (%)
Place of birth for the foreign-born population - Liberia (%)
Place of birth for the foreign-born population - Nigeria (%)
Place of birth for the foreign-born population - Senegal (%)
Place of birth for the foreign-born population - Sierra Leone (%)
Place of birth for the foreign-born population - Other Western Africa (%)
Place of birth for the foreign-born population - Australia (%)
Place of birth for the foreign-born population - New Zealand (%)
Place of birth for the foreign-born population - Fiji (%)
Place of birth for the foreign-born population - Micronesia (%)
Place of birth for the foreign-born population - Bahamas (%)
Place of birth for the foreign-born population - Barbados (%)
Place of birth for the foreign-born population - Cuba (%)
Place of birth for the foreign-born population - Dominica (%)
Place of birth for the foreign-born population - Dominican Republic (%)
Place of birth for the foreign-born population - Grenada (%)
Place of birth for the foreign-born population - Haiti (%)
Place of birth for the foreign-born population - Jamaica (%)
Place of birth for the foreign-born population - St. Vincent and the Grenadines (%)
Place of birth for the foreign-born population - Trinidad and Tobago (%)
Place of birth for the foreign-born population - West Indies (%)
Place of birth for the foreign-born population - Other Caribbean (%)
Place of birth for the foreign-born population - Belize (%)
Place of birth for the foreign-born population - Costa Rica (%)
Place of birth for the foreign-born population - El Salvador (%)
Place of birth for the foreign-born population - Guatemala (%)
Place of birth for the foreign-born population - Honduras (%)
Place of birth for the foreign-born population - Mexico (%)
Place of birth for the foreign-born population - Nicaragua (%)
Place of birth for the foreign-born population - Panama (%)
Place of birth for the foreign-born population - Other Central America (%)
Place of birth for the foreign-born population - Argentina (%)
Place of birth for the foreign-born population - Bolivia (%)
Place of birth for the foreign-born population - Brazil (%)
Place of birth for the foreign-born population - Chile (%)
Place of birth for the foreign-born population - Colombia (%)
Place of birth for the foreign-born population - Ecuador (%)
Place of birth for the foreign-born population - Guyana (%)
Place of birth for the foreign-born population - Peru (%)
Place of birth for the foreign-born population - Uruguay (%)
Place of birth for the foreign-born population - Venezuela (%)
Place of birth for the foreign-born population - Other South America (%)
Place of birth for the foreign-born population - Canada (%)
Place of birth for the foreign-born population - Other Northern America (%)
Place of birth for the foreign-born population - Other (%)
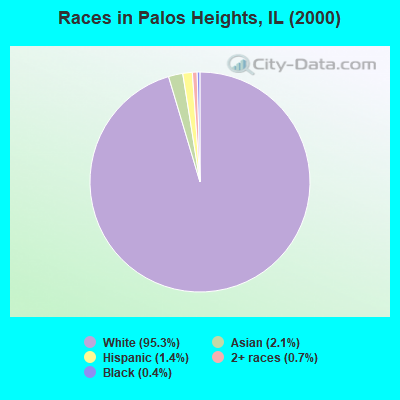
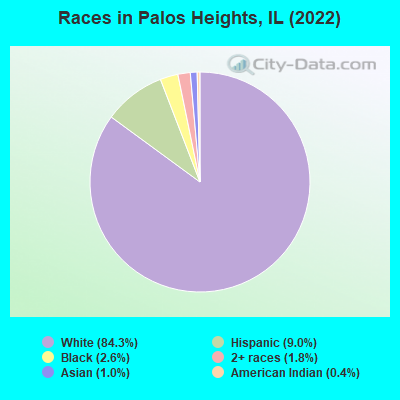
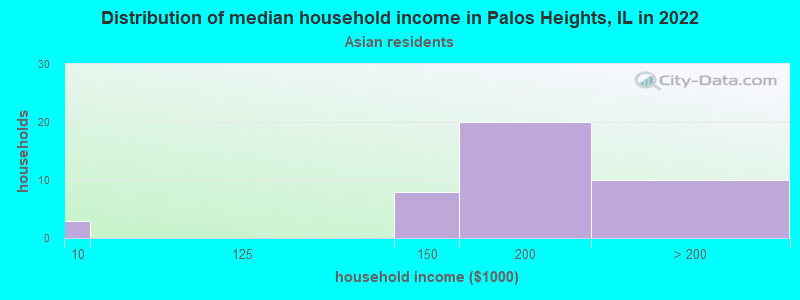
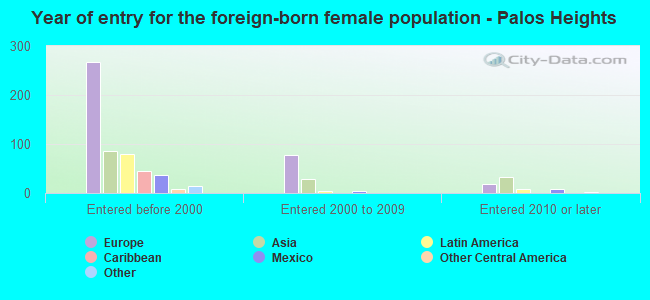
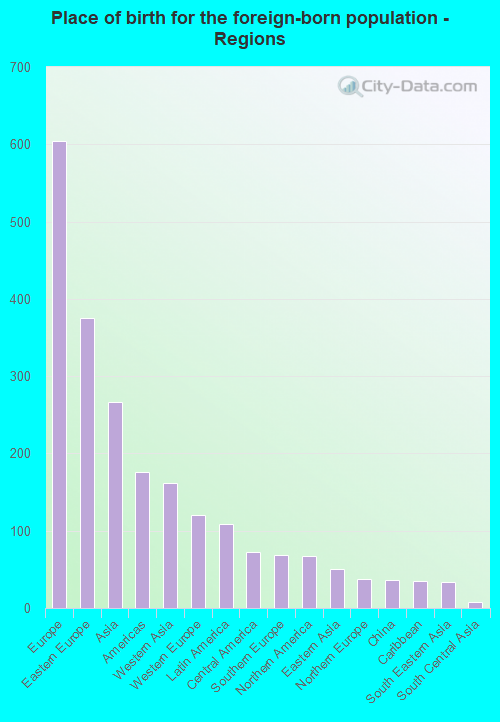
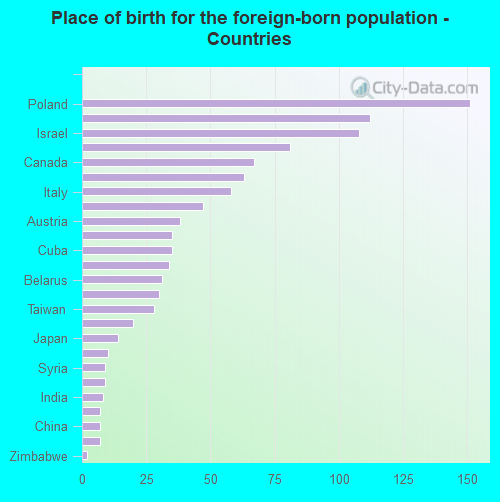
According to 2022 data, the most numerous races in Palos Heights, IL are White alone (9,857 residents), Hispanic (1,053 residents), and Black alone (299 residents). 82.8% of Palos Heights residents speak English at home. 9.0% of Palos Heights, IL residents are foreign-born (5.1% born in Europe, 2.2% born in Asia, 0.9% born in Latin America), which is 55.7% less than the foreign-born rate of 14.0% across the entire state of Illinois.
Race distribution in Palos Heights
2000 2022
8,424,140 67.8% White alone 1,856,152 14.9% Black alone 1,530,262 12.3% Hispanic 419,916 3.4% Asian alone 153,996 1.2% Two or more races 13,479 0.1% Other race alone 18,232 0.1% American Indian alone 3,116 0.03% Native Hawaiian and Other
7,356,301 58.5% White alone 2,299,726 18.3% Hispanic 1,660,423 13.2% Black alone 747,296 5.9% Asian alone 458,599 3.6% Two or more races 45,386 0.4% Other race alone 10,405 0.08% American Indian alone 3,896 0.03% Native Hawaiian and Other
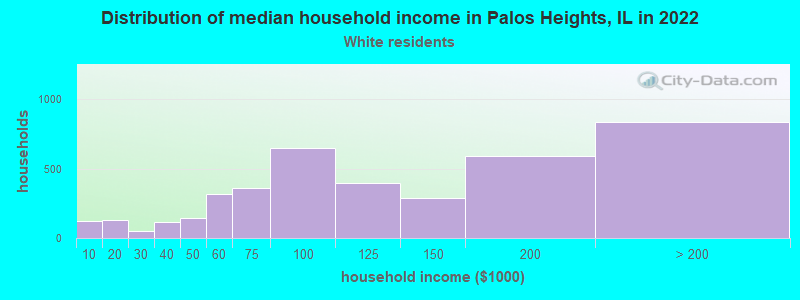
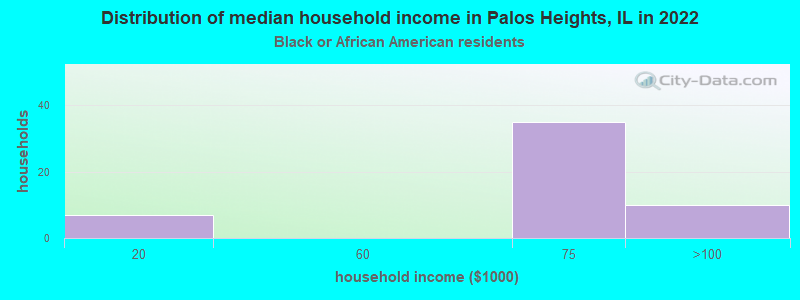
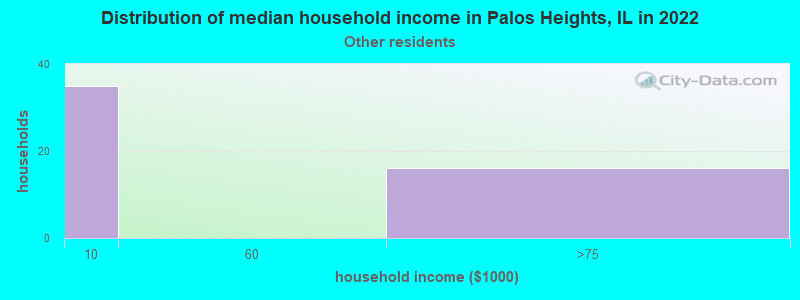
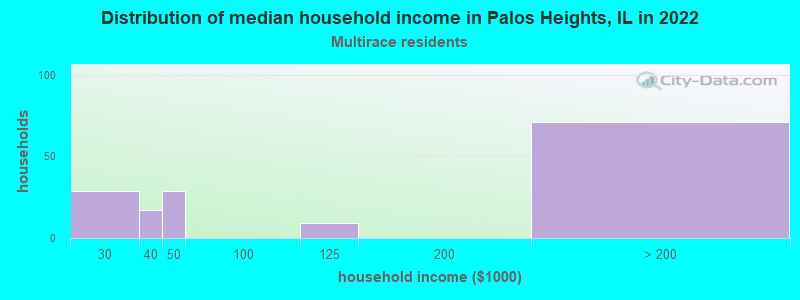
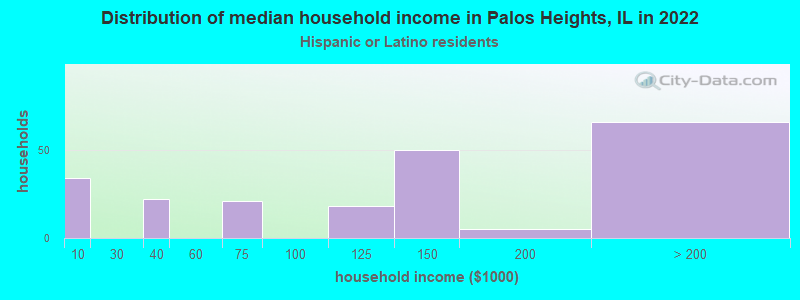
Income and house value in Palos Heights Median household income in 2022 $102,150 White non-Hispanic householders$62,387 Black householders$148,550 Asian householders$143,421 Hispanic or Latino race householdersMedian 2022 house value $355,386 White Non-Hispanic householders$734,269 Black or African American householders$426,039 American Indian or Alaska Native householders $553,965 Asian householders$433,382 Some other race householders$734,269 Two or more races householders$386,225 Hispanic or Latino householders
Median age by race in Palos Heights
55.7 Median age for White residents53.1 58.5 47.0 Median age for Black or African American residents27.8 59.0 -680,473,372.1 Median age for American Indian / Alaska Native residents-736,736,736.0 -641,399,416.3 66.1 Median age for Asian residents53.5 66.2 -687,999,999.3 Median age for Native Hawaiian / Pacific Islander residents-918,721,460.3 -610,229,276.3 36.0 Median age for Other race residents35.0 56.9 19.8 Median age for Two or more races residents38.3 17.7 55.8 Median age for White alone residents52.9 57.5 33.3 Median age for Hispanic or Latino residents34.2 33.0
Owner/renter occupied households by race in Palos Heights
House owners and renters - White residents 3,807 95.0% Owner occupied201 5.0% Renter occupiedHouse owners and renters - Black or African American residents 54 100.0% Owner occupiedHouse owners and renters - Asian residents 35 79.9% Owner occupied9 20.1% Renter occupiedHouse owners and renters - Other race residents 52 100.0% Owner occupiedHouse owners and renters - Two or more races residents 155 100.0% Owner occupiedHouse owners and renters - White alone residents 3,909 94.6% Owner occupied222 5.4% Renter occupiedHouse owners and renters - Hispanic or Latino residents 217 100.0% Owner occupied
Language usage in Palos Heights
English speakers - Total 82.8% of residents of Palos Heights speak English at home.
5.4% of residents speak Spanish at home 544 89.8% Speak English very well62 10.2% Speak English less than very well11.3% of residents speak other language at home 1,042 82.4% Speak English very well223 17.6% Speak English less than very well
English speakers - Born in the United States 90.8% of residents of Palos Heights speak English at home.
6.9% of residents speak Spanish at home 67 91.8% Speak English very well6 8.2% Speak English less than very well1.5% of residents speak other language at home 14 87.5% Speak English very well2 12.5% Speak English less than very well
English speakers - Native, born elsewhere 21.5% of residents of Palos Heights speak English at home.
58.2% of residents speak Spanish at home 46 100.0% Speak English very well20.3% of residents speak other language at home 16 100.0% Speak English very well
English speakers - Foreign-born 19.0% of residents of Palos Heights speak English at home.
9.9% of residents speak Spanish at home 75 72.1% Speak English very well29 27.9% Speak English less than very well70.1% of residents speak other language at home 522 70.8% Speak English very well215 29.2% Speak English less than very well
White (Caucasian) - Speak only English Native:
96.9% (8,095)Foreign-born:
23.3% (153)
White (Caucasian) - Speak another language Native:
5.5% (457)Foreign-born:
77.4% (507)
Black or African American - Speak another language Native:
5.3% (16)Foreign-born:
91.2% (4)
Asian - Speak only English Native:
52.4% (13)Foreign-born:
8.1% (7)
Asian - Speak another language Native:
47.6% (11)Foreign-born:
92.4% (82)
Other race - Speak only English Native:
7.3% (4)Foreign-born:
24.1% (18)
Other race - Speak another language Native:
91.2% (46)Foreign-born:
73.5% (54)
Two or more races - Speak another language Native:
48.8% (380)Foreign-born:
100.0% (26)
White alone - Speak only English Native:
93.5% (8,135)Foreign-born:
20.5% (169)
White alone - Speak another language Native:
6.4% (553)Foreign-born:
78.9% (648)
Hispanic or Latino - Speak only English Native:
40.8% (308)Foreign-born:
12.6% (15)
Hispanic or Latino - Speak another language Native:
59.8% (451)Foreign-born:
86.4% (105)
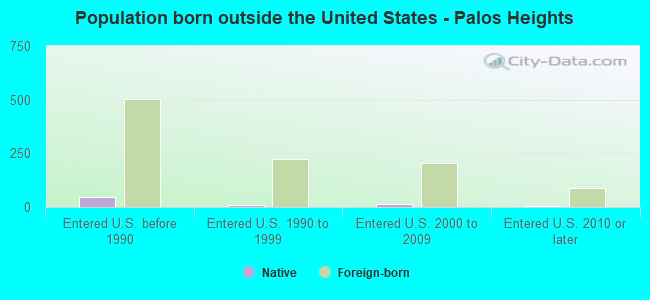
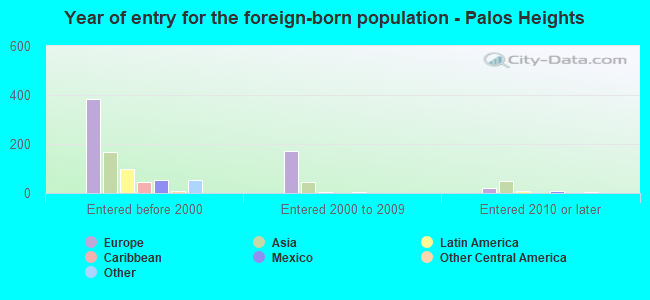
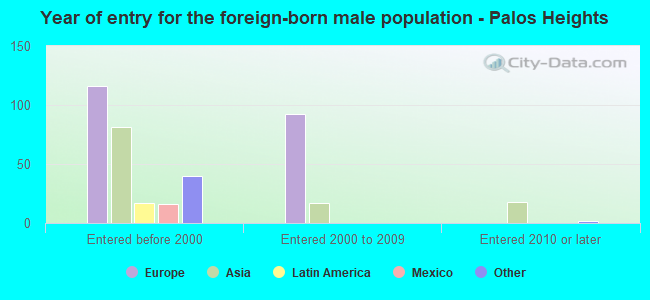
Foreign-born residents in Palos Heights 1,052 residents are foreign born (5.1% Europe , 2.2% Asia , 0.9% Latin America ).
This city:
9.0%Illinois:
14.1%
Marital status for residents in Palos Heights Marital status - White (Caucasian) population 15 years and over
Males 26.6% Never married62.3% Now married0.0% Separated3.0% Widowed8.1% DivorcedFemales 21.6% Never married55.4% Now married0.4% Separated12.1% Widowed10.5% DivorcedWomen who gave birth in the past 12 months Now married:
96.5% (118)Unmarried:
3.5% (4)
Women who did not give birth in the past 12 months Now married:
38.3% (537)Unmarried:
61.7% (865)
Marital status - Black or African American population 15 years and over
Males 72.4% Never married13.5% Now married0.0% Separated11.0% Widowed3.1% DivorcedFemales 57.6% Never married6.8% Now married0.0% Separated22.0% Widowed13.6% DivorcedWomen who did not give birth in the past 12 months Now married:
14.8% (8)Unmarried:
85.2% (43)
Marital status - American Indian / Alaska Native population 15 years and over
Males 100.0% Never married0.0% Now married0.0% Separated0.0% Widowed0.0% DivorcedFemales 100.0% Never married0.0% Now married0.0% Separated0.0% Widowed0.0% DivorcedWomen who did not give birth in the past 12 months Now married:
0.0% (0)Unmarried:
100.0% (22)
Marital status - Asian population 15 years and over
Males 41.7% Never married58.3% Now married0.0% Separated0.0% Widowed0.0% DivorcedFemales 30.2% Never married55.6% Now married0.0% Separated14.3% Widowed0.0% DivorcedWomen who did not give birth in the past 12 months Now married:
32.1% (9)Unmarried:
67.9% (19)
Marital status - Other race population 15 years and over
Males 58.6% Never married41.4% Now married0.0% Separated0.0% Widowed0.0% DivorcedFemales 17.9% Never married44.9% Now married0.0% Separated37.2% Widowed0.0% DivorcedWomen who did not give birth in the past 12 months Now married:
88.0% (25)Unmarried:
12.0% (3)
Marital status - Two or more races population 15 years and over
Males 23.2% Never married74.1% Now married0.0% Separated0.0% Widowed2.6% DivorcedFemales 57.1% Never married28.1% Now married0.0% Separated14.8% Widowed0.0% DivorcedWomen who did not give birth in the past 12 months Now married:
28.7% (62)Unmarried:
71.3% (155)
Marital status - White alone, not Hispanic / Latino population 15 years and over
Males 26.2% Never married63.1% Now married0.0% Separated3.1% Widowed7.6% DivorcedFemales 21.9% Never married54.9% Now married0.4% Separated12.0% Widowed10.8% DivorcedWomen who gave birth in the past 12 months Now married:
95.8% (108)Unmarried:
4.2% (5)
Women who did not give birth in the past 12 months Now married:
36.8% (558)Unmarried:
63.2% (958)
Marital status - Hispanic or Latino population 15 years and over
Males 36.6% Never married53.2% Now married0.0% Separated0.0% Widowed10.2% DivorcedFemales 35.9% Never married49.0% Now married0.0% Separated15.1% Widowed0.0% DivorcedWomen who gave birth in the past 12 months Now married:
100.0% (25)Unmarried:
0.0% (0)
Women who did not give birth in the past 12 months Now married:
47.1% (115)Unmarried:
52.9% (129)
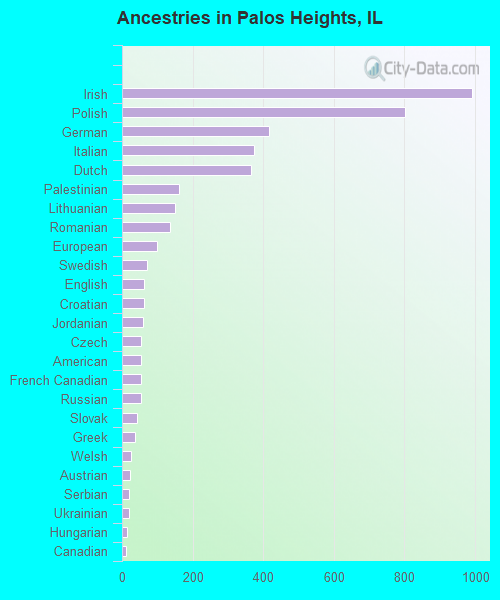
Ancestries in Palos Heights
990 19.1% Irish801 15.4% Polish417 8.0% German373 7.2% Italian365 7.0% Dutch161 3.1% Palestinian150 2.9% Lithuanian135 2.6% Romanian98 1.9% European70 1.3% Swedish63 1.2% English61 1.2% Croatian59 1.1% Jordanian55 1.1% Czech54 1.0% American54 1.0% French Canadian53 1.0% Russian43 0.8% Slovak36 0.7% Greek25 0.5% Welsh22 0.4% Austrian20 0.4% Serbian19 0.4% Ukrainian15 0.3% Hungarian12 0.2% Canadian12 0.2% Swiss11 0.2% Scotch-Irish10 0.2% Latvian10 0.2% Arab8 0.2% Eastern European7 0.1% Danish4 0.08% British4 0.08% Kenyan4 0.08% African2 0.04% Ethiopian
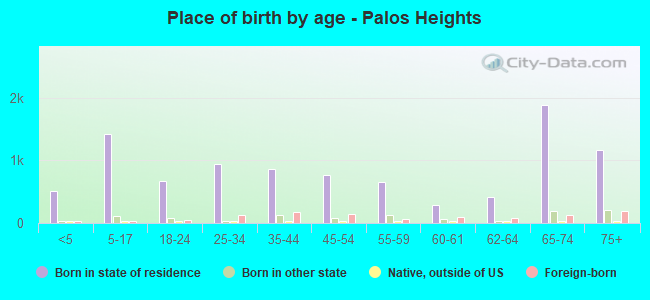
Children Nativity (place of birth) in Palos Heights
Children under 6 years - Living with two parents Both parents native 413 100.0% NativeBoth parents foreign-born 27 100.0% NativeOne native, one foreign-born parent 63 100.0% NativeChildren under 6 years - Living with one parent Native parent 84 100.0% NativeChildren 6 to 17 years - Living with two parents Both parents native 971 100.0% NativeBoth parents foreign-born 92 100.0% NativeOne native, one foreign-born parent 76 100.0% NativeChildren 6 to 17 years - Living with one parent Native parent 191 100.0% NativeForeign-born parent 75 50.1% Native75 49.9% Foreign-born