Races in Paradise, Nevada (NV) Detailed Stats
Data:
Races - White alone (%)
Races - White alone (% change since 2000)
Races - Black alone (%)
Races - Black alone (% change since 2000)
Races - American Indian alone (%)
Races - American Indian alone (% change since 2000)
Races - Asian alone (%)
Races - Asian alone (% change since 2000)
Races - Hispanic (%)
Races - Hispanic (% change since 2000)
Races - Native Hawaiian and Other Pacific Islander alone (%)
Races - Native Hawaiian and Other Pacific Islander alone (% change since 2000)
Races - Two or more races(%)
Races - Two or more races(% change since 2000)
Races - Other race alone (%)
Races - Other race alone (% change since 2000)
Racial diversity
Place of birth - Born in state of residence (%)
Place of birth - Born in state of residence (%) - White
Place of birth - Born in state of residence (%) - Black or African American
Place of birth - Born in state of residence (%) - Asian
Place of birth - Born in state of residence (%) - Hispanic or Latino
Place of birth - Born in state of residence (%) - American Indian and Alaska Native
Place of birth - Born in state of residence (%) - Multirace
Place of birth - Born in state of residence (%) - Other Race
Place of birth - Born in other state (%)
Place of birth - Born in other state (%) - White
Place of birth - Born in other state (%) - Black or African American
Place of birth - Born in other state (%) - Asian
Place of birth - Born in other state (%) - Hispanic or Latino
Place of birth - Born in other state (%) - American Indian and Alaska Native
Place of birth - Born in other state (%) - Multirace
Place of birth - Born in other state (%) - Other Race
Place of birth - Native, outside of US (%)
Place of birth - Native, outside of US (%) - White
Place of birth - Native, outside of US (%) - Black or African American
Place of birth - Native, outside of US (%) - Asian
Place of birth - Native, outside of US (%) - Hispanic or Latino
Place of birth - Native, outside of US (%) - American Indian and Alaska Native
Place of birth - Native, outside of US (%) - Multirace
Place of birth - Native, outside of US (%) - Other Race
Place of birth - Foreign born (%)
Place of birth - Foreign born (%) - White
Place of birth - Foreign born (%) - Black or African American
Place of birth - Foreign born (%) - Asian
Place of birth - Foreign born (%) - Hispanic or Latino
Place of birth - Foreign born (%) - American Indian and Alaska Native
Place of birth - Foreign born (%) - Multirace
Place of birth - Foreign born (%) - Other Race
Residents speaking English at home (%)
Residents speaking English at home - Born in the United States (%)
Residents speaking English at home - Native, born elsewhere (%)
Residents speaking English at home - Foreign born (%)
Residents speaking Spanish at home (%)
Residents speaking Spanish at home - Born in the United States (%)
Residents speaking Spanish at home - Native, born elsewhere (%)
Residents speaking Spanish at home - Foreign born (%)
Residents speaking other language at home (%)
Residents speaking other language at home - Born in the United States (%)
Residents speaking other language at home - Native, born elsewhere (%)
Residents speaking other language at home - Foreign born (%)
Marital status - Never married (%)
Marital status - Now married (%)
Marital status - Separated (%)
Marital status - Widowed (%)
Marital status - Divorced (%)
Ancestries Reported - Arab (%)
Ancestries Reported - Czech (%)
Ancestries Reported - Danish (%)
Ancestries Reported - Dutch (%)
Ancestries Reported - English (%)
Ancestries Reported - French (%)
Ancestries Reported - French Canadian (%)
Ancestries Reported - German (%)
Ancestries Reported - Greek (%)
Ancestries Reported - Hungarian (%)
Ancestries Reported - Irish (%)
Ancestries Reported - Italian (%)
Ancestries Reported - Lithuanian (%)
Ancestries Reported - Norwegian (%)
Ancestries Reported - Polish (%)
Ancestries Reported - Portuguese (%)
Ancestries Reported - Russian (%)
Ancestries Reported - Scotch-Irish (%)
Ancestries Reported - Scottish (%)
Ancestries Reported - Slovak (%)
Ancestries Reported - Subsaharan African (%)
Ancestries Reported - Swedish (%)
Ancestries Reported - Swiss (%)
Ancestries Reported - Ukrainian (%)
Ancestries Reported - United States (%)
Ancestries Reported - Welsh (%)
Ancestries Reported - West Indian (%)
Ancestries Reported - Other (%)
Geographical mobility - Same house 1 year ago (%)
Geographical mobility - Same house 1 year ago (%) - White
Geographical mobility - Same house 1 year ago (%) - Black or African American
Geographical mobility - Same house 1 year ago (%) - Asian
Geographical mobility - Same house 1 year ago (%) - Hispanic or Latino
Geographical mobility - Same house 1 year ago (%) - American Indian and Alaska Native
Geographical mobility - Same house 1 year ago (%) - Multirace
Geographical mobility - Same house 1 year ago (%) - Other Race
Geographical mobility - Moved within same county (%)
Geographical mobility - Moved within same county (%) - White
Geographical mobility - Moved within same county (%) - Black or African American
Geographical mobility - Moved within same county (%) - Asian
Geographical mobility - Moved within same county (%) - Hispanic or Latino
Geographical mobility - Moved within same county (%) - American Indian and Alaska Native
Geographical mobility - Moved within same county (%) - Multirace
Geographical mobility - Moved within same county (%) - Other Race
Geographical mobility - Moved from different county within same state (%)
Geographical mobility - Moved from different county within same state (%) - White
Geographical mobility - Moved from different county within same state (%) - Black or African American
Geographical mobility - Moved from different county within same state (%) - Asian
Geographical mobility - Moved from different county within same state (%) - Hispanic or Latino
Geographical mobility - Moved from different county within same state (%) - American Indian and Alaska Native
Geographical mobility - Moved from different county within same state (%) - Multirace
Geographical mobility - Moved from different county within same state (%) - Other Race
Geographical mobility - Moved from different state (%)
Geographical mobility - Moved from different state (%) - White
Geographical mobility - Moved from different state (%) - Black or African American
Geographical mobility - Moved from different state (%) - Asian
Geographical mobility - Moved from different state (%) - Hispanic or Latino
Geographical mobility - Moved from different state (%) - American Indian and Alaska Native
Geographical mobility - Moved from different state (%) - Multirace
Geographical mobility - Moved from different state (%) - Other Race
Geographical mobility - Moved from abroad (%)
Geographical mobility - Moved from abroad (%) - White
Geographical mobility - Moved from abroad (%) - Black or African American
Geographical mobility - Moved from abroad (%) - Asian
Geographical mobility - Moved from abroad (%) - Hispanic or Latino
Geographical mobility - Moved from abroad (%) - American Indian and Alaska Native
Geographical mobility - Moved from abroad (%) - Multirace
Geographical mobility - Moved from abroad (%) - Other Race
Place of birth for the foreign-born population - Ireland (%)
Place of birth for the foreign-born population - Denmark (%)
Place of birth for the foreign-born population - Norway (%)
Place of birth for the foreign-born population - Sweden (%)
Place of birth for the foreign-born population - United Kingdom (%)
Place of birth for the foreign-born population - England (%)
Place of birth for the foreign-born population - Scotland (%)
Place of birth for the foreign-born population - Other Northern Europe (%)
Place of birth for the foreign-born population - Austria (%)
Place of birth for the foreign-born population - Belgium (%)
Place of birth for the foreign-born population - France (%)
Place of birth for the foreign-born population - Germany (%)
Place of birth for the foreign-born population - Netherlands (%)
Place of birth for the foreign-born population - Switzerland (%)
Place of birth for the foreign-born population - Other Western Europe (%)
Place of birth for the foreign-born population - Greece (%)
Place of birth for the foreign-born population - Italy (%)
Place of birth for the foreign-born population - Portugal (%)
Place of birth for the foreign-born population - Spain (%)
Place of birth for the foreign-born population - Other Southern Europe (%)
Place of birth for the foreign-born population - Albania (%)
Place of birth for the foreign-born population - Belarus (%)
Place of birth for the foreign-born population - Bosnia and Herzegovina (%)
Place of birth for the foreign-born population - Bulgaria (%)
Place of birth for the foreign-born population - Croatia (%)
Place of birth for the foreign-born population - Czechoslovakia (%)
Place of birth for the foreign-born population - Hungary (%)
Place of birth for the foreign-born population - Latvia (%)
Place of birth for the foreign-born population - Lithuania (%)
Place of birth for the foreign-born population - North Macedonia (Macedonia) (%)
Place of birth for the foreign-born population - Moldova (%)
Place of birth for the foreign-born population - Poland (%)
Place of birth for the foreign-born population - Romania (%)
Place of birth for the foreign-born population - Russia (%)
Place of birth for the foreign-born population - Serbia (%)
Place of birth for the foreign-born population - Ukraine (%)
Place of birth for the foreign-born population - Other Eastern Europe (%)
Place of birth for the foreign-born population - China (%)
Place of birth for the foreign-born population - Hong Kong (%)
Place of birth for the foreign-born population - Taiwan (%)
Place of birth for the foreign-born population - Japan (%)
Place of birth for the foreign-born population - Korea (%)
Place of birth for the foreign-born population - Other Eastern Asia (%)
Place of birth for the foreign-born population - Afghanistan (%)
Place of birth for the foreign-born population - Bangladesh (%)
Place of birth for the foreign-born population - India (%)
Place of birth for the foreign-born population - Iran (%)
Place of birth for the foreign-born population - Kazakhstan (%)
Place of birth for the foreign-born population - Nepal (%)
Place of birth for the foreign-born population - Pakistan (%)
Place of birth for the foreign-born population - Sri Lanka (%)
Place of birth for the foreign-born population - Uzbekistan (%)
Place of birth for the foreign-born population - Other South Central Asia (%)
Place of birth for the foreign-born population - Burma (%)
Place of birth for the foreign-born population - Cambodia (%)
Place of birth for the foreign-born population - Indonesia (%)
Place of birth for the foreign-born population - Laos (%)
Place of birth for the foreign-born population - Malaysia (%)
Place of birth for the foreign-born population - Philippines (%)
Place of birth for the foreign-born population - Singapore (%)
Place of birth for the foreign-born population - Thailand (%)
Place of birth for the foreign-born population - Vietnam (%)
Place of birth for the foreign-born population - Other South Eastern Asia (%)
Place of birth for the foreign-born population - Armenia (%)
Place of birth for the foreign-born population - Iraq (%)
Place of birth for the foreign-born population - Israel (%)
Place of birth for the foreign-born population - Jordan (%)
Place of birth for the foreign-born population - Kuwait (%)
Place of birth for the foreign-born population - Lebanon (%)
Place of birth for the foreign-born population - Saudi Arabia (%)
Place of birth for the foreign-born population - Syria (%)
Place of birth for the foreign-born population - Turkey (%)
Place of birth for the foreign-born population - Yemen (%)
Place of birth for the foreign-born population - Other Western Asia (%)
Place of birth for the foreign-born population - Eritrea (%)
Place of birth for the foreign-born population - Ethiopia (%)
Place of birth for the foreign-born population - Kenya (%)
Place of birth for the foreign-born population - Somalia (%)
Place of birth for the foreign-born population - Uganda (%)
Place of birth for the foreign-born population - Zimbabwe (%)
Place of birth for the foreign-born population - Other Eastern Africa (%)
Place of birth for the foreign-born population - Cameroon (%)
Place of birth for the foreign-born population - Congo (%)
Place of birth for the foreign-born population - Democratic Republic of Congo (Zaire) (%)
Place of birth for the foreign-born population - Other Middle Africa (%)
Place of birth for the foreign-born population - Egypt (%)
Place of birth for the foreign-born population - Morocco (%)
Place of birth for the foreign-born population - Sudan (%)
Place of birth for the foreign-born population - Other Northern Africa (%)
Place of birth for the foreign-born population - South Africa (%)
Place of birth for the foreign-born population - Other Southern Africa (%)
Place of birth for the foreign-born population - Cabo Verde (%)
Place of birth for the foreign-born population - Ghana (%)
Place of birth for the foreign-born population - Liberia (%)
Place of birth for the foreign-born population - Nigeria (%)
Place of birth for the foreign-born population - Senegal (%)
Place of birth for the foreign-born population - Sierra Leone (%)
Place of birth for the foreign-born population - Other Western Africa (%)
Place of birth for the foreign-born population - Australia (%)
Place of birth for the foreign-born population - New Zealand (%)
Place of birth for the foreign-born population - Fiji (%)
Place of birth for the foreign-born population - Micronesia (%)
Place of birth for the foreign-born population - Bahamas (%)
Place of birth for the foreign-born population - Barbados (%)
Place of birth for the foreign-born population - Cuba (%)
Place of birth for the foreign-born population - Dominica (%)
Place of birth for the foreign-born population - Dominican Republic (%)
Place of birth for the foreign-born population - Grenada (%)
Place of birth for the foreign-born population - Haiti (%)
Place of birth for the foreign-born population - Jamaica (%)
Place of birth for the foreign-born population - St. Vincent and the Grenadines (%)
Place of birth for the foreign-born population - Trinidad and Tobago (%)
Place of birth for the foreign-born population - West Indies (%)
Place of birth for the foreign-born population - Other Caribbean (%)
Place of birth for the foreign-born population - Belize (%)
Place of birth for the foreign-born population - Costa Rica (%)
Place of birth for the foreign-born population - El Salvador (%)
Place of birth for the foreign-born population - Guatemala (%)
Place of birth for the foreign-born population - Honduras (%)
Place of birth for the foreign-born population - Mexico (%)
Place of birth for the foreign-born population - Nicaragua (%)
Place of birth for the foreign-born population - Panama (%)
Place of birth for the foreign-born population - Other Central America (%)
Place of birth for the foreign-born population - Argentina (%)
Place of birth for the foreign-born population - Bolivia (%)
Place of birth for the foreign-born population - Brazil (%)
Place of birth for the foreign-born population - Chile (%)
Place of birth for the foreign-born population - Colombia (%)
Place of birth for the foreign-born population - Ecuador (%)
Place of birth for the foreign-born population - Guyana (%)
Place of birth for the foreign-born population - Peru (%)
Place of birth for the foreign-born population - Uruguay (%)
Place of birth for the foreign-born population - Venezuela (%)
Place of birth for the foreign-born population - Other South America (%)
Place of birth for the foreign-born population - Canada (%)
Place of birth for the foreign-born population - Other Northern America (%)
Place of birth for the foreign-born population - Other (%)
Latest news about races in Paradise, NV collected exclusively by city-data.com from local newspapers, TV, and radio stations
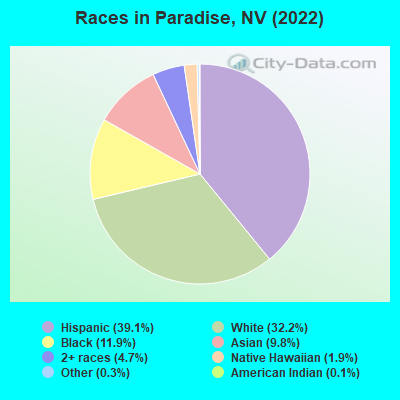
According to 2022 data, the most numerous races in Paradise, NV are White alone (59,044 residents), Hispanic (71,698 residents), and Black alone (21,893 residents). 61.0% of Paradise residents speak English at home. 26.9% of Paradise, NV residents are foreign-born (14.9% born in Latin America, 8.9% born in Asia), which is 33.0% greater than the foreign-born rate of 18.0% across the entire state of Nevada.
Race distribution in Paradise
2000 2022
111,017 59.7% White alone 43,663 23.5% Hispanic 11,945 6.4% Asian alone 11,734 6.3% Black alone 5,407 2.9% Two or more races 1,018 0.5% Native Hawaiian and Other 997 0.5% American Indian alone 289 0.2% Other race alone
71,698 39.1% Hispanic 59,044 32.2% White alone 21,893 11.9% Black alone 17,981 9.8% Asian alone 8,563 4.7% Two or more races 3,405 1.9% Native Hawaiian and Other 526 0.3% Other race alone 211 0.1% American Indian alone
2000 2022
1,303,001 65.2% White alone 393,970 19.7% Hispanic 131,509 6.6% Black alone 88,593 4.4% Asian alone 49,231 2.5% Two or more races 21,397 1.1% American Indian alone 7,769 0.4% Native Hawaiian and Other 2,787 0.1% Other race alone
1,410,145 44.4% White alone 961,357 30.3% Hispanic 286,471 9.0% Black alone 281,149 8.8% Asian alone 182,151 5.7% Two or more races 20,102 0.6% Native Hawaiian and Other 18,781 0.6% Other race alone 17,616 0.6% American Indian alone
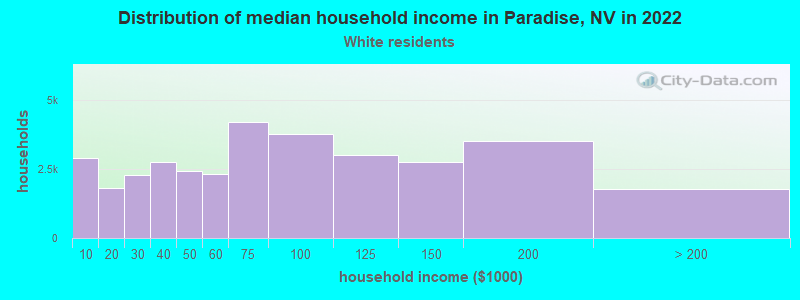
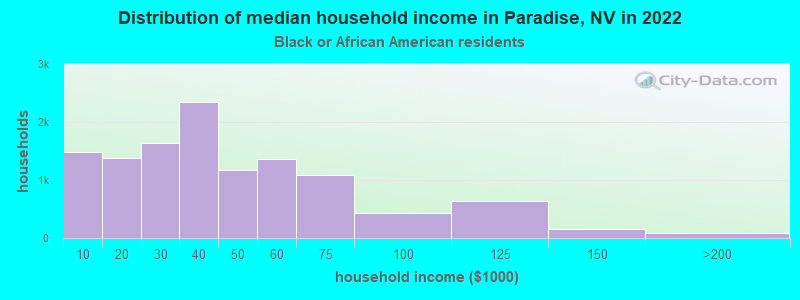
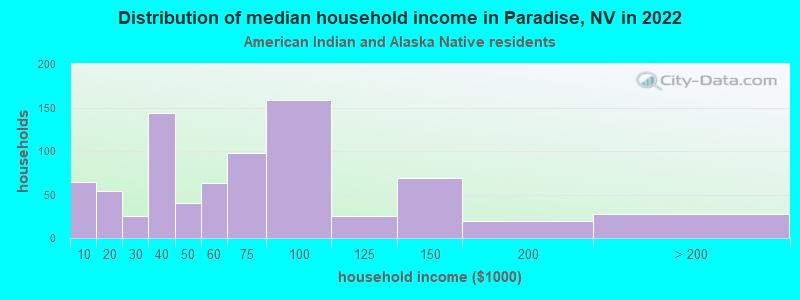
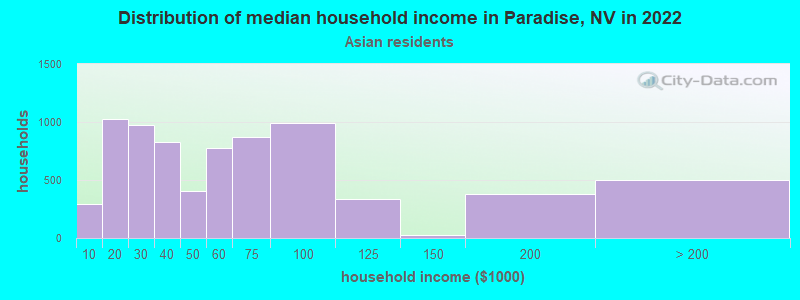
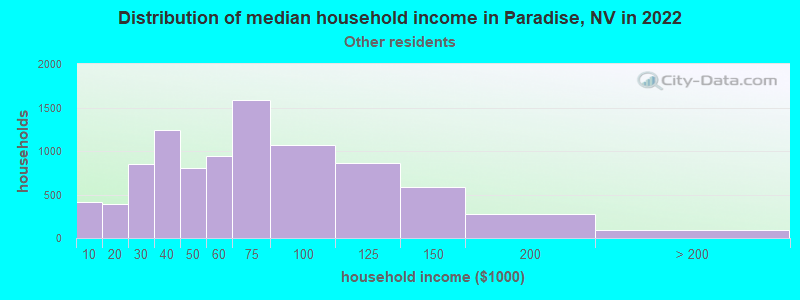
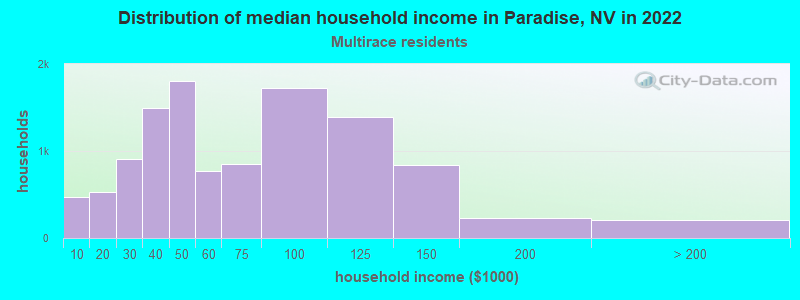
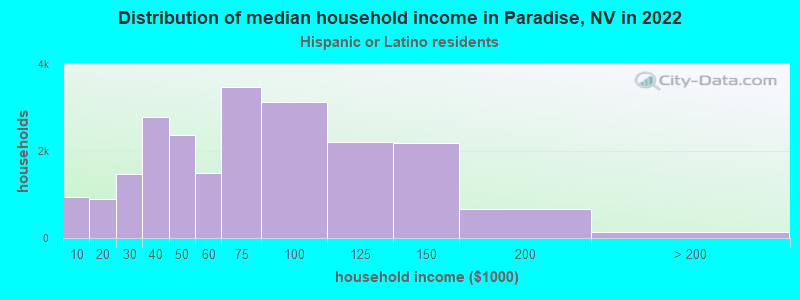
Income and house value in Paradise Median household income in 2022 $66,077 White non-Hispanic householders$34,283 Black householders$92,864 American Indian and Alaska Native householders$53,260 Asian householders$44,848 Native Hawaiian and other Pacific Islander householders$59,379 Some other race householders$56,985 Two or more races householders$64,821 Hispanic or Latino race householdersMedian 2022 house value $401,481 White Non-Hispanic householders$386,170 Black or African American householders$388,155 American Indian or Alaska Native householders $423,596 Asian householders$531,622 Native Hawaiian and other Pacific Islander householders$362,921 Some other race householders$402,615 Two or more races householders$365,756 Hispanic or Latino householders
Median age by race in Paradise
44.6 Median age for White residents44.2 45.2 31.4 Median age for Black or African American residents31.8 31.2 27.7 Median age for American Indian / Alaska Native residents38.9 24.9 40.5 Median age for Asian residents37.9 44.3 24.6 Median age for Native Hawaiian / Pacific Islander residents36.1 24.3 35.3 Median age for Other race residents35.6 34.8 30.7 Median age for Two or more races residents33.2 30.4 48.5 Median age for White alone residents47.9 49.2 31.9 Median age for Hispanic or Latino residents32.6 31.2
Owner/renter occupied households by race in Paradise
House owners and renters - White residents 17,630 52.7% Owner occupied15,805 47.3% Renter occupiedHouse owners and renters - Black or African American residents 1,187 10.1% Owner occupied10,615 89.9% Renter occupiedHouse owners and renters - American Indian / Alaska Native residents 280 54.6% Owner occupied233 45.4% Renter occupiedHouse owners and renters - Asian residents 2,611 35.2% Owner occupied4,797 64.8% Renter occupiedHouse owners and renters - Native Hawaiian / Pacific Islander residents 137 25.4% Owner occupied402 74.6% Renter occupiedHouse owners and renters - Other race residents 2,956 32.5% Owner occupied6,150 67.5% Renter occupiedHouse owners and renters - Two or more races residents 3,735 33.3% Owner occupied7,490 66.7% Renter occupiedHouse owners and renters - White alone residents 15,605 54.6% Owner occupied12,969 45.4% Renter occupiedHouse owners and renters - Hispanic or Latino residents 8,044 36.9% Owner occupied13,728 63.1% Renter occupied
Language usage in Paradise
English speakers - Total 61.0% of residents of Paradise speak English at home.
27.6% of residents speak Spanish at home 26,900 56.0% Speak English very well21,126 44.0% Speak English less than very well11.4% of residents speak other language at home 11,039 55.8% Speak English very well8,758 44.2% Speak English less than very well
English speakers - Born in the United States 84.2% of residents of Paradise speak English at home.
14.1% of residents speak Spanish at home 10,752 84.3% Speak English very well1,997 15.7% Speak English less than very well1.7% of residents speak other language at home 1,275 85.4% Speak English very well218 14.6% Speak English less than very well
English speakers - Native, born elsewhere 35.3% of residents of Paradise speak English at home.
32.0% of residents speak Spanish at home 1,399 83.1% Speak English very well284 16.9% Speak English less than very well32.7% of residents speak other language at home 1,250 72.5% Speak English very well474 27.5% Speak English less than very well
English speakers - Foreign-born 11.3% of residents of Paradise speak English at home.
56.0% of residents speak Spanish at home 8,520 32.2% Speak English very well17,939 67.8% Speak English less than very well32.7% of residents speak other language at home 7,759 50.2% Speak English very well7,705 49.8% Speak English less than very well
White (Caucasian) - Speak only English Native:
91.6% (60,697)Foreign-born:
29.9% (1,512)
White (Caucasian) - Speak another language Native:
8.4% (5,538)Foreign-born:
70.1% (3,537)
Black or African American - Speak only English Native:
99.3% (18,275)Foreign-born:
45.5% (1,063)
Black or African American - Speak another language Native:
0.7% (134)Foreign-born:
54.5% (1,275)
American Indian / Alaska Native - Speak only English Native:
70.9% (1,205)Foreign-born:
5.6% (37)
American Indian / Alaska Native - Speak another language Native:
27.9% (475)Foreign-born:
96.9% (640)
Asian - Speak only English Native:
66.5% (3,430)Foreign-born:
16.7% (2,077)
Asian - Speak another language Native:
33.5% (1,731)Foreign-born:
83.3% (10,356)
Native Hawaiian / Pacific Islander - Speak only English Native:
55.0% (567)Foreign-born:
1.7% (8)
Native Hawaiian / Pacific Islander - Speak another language Native:
50.2% (518)Foreign-born:
84.0% (372)
Other race - Speak only English Native:
19.2% (2,239)Foreign-born:
2.5% (355)
Other race - Speak another language Native:
80.8% (9,394)Foreign-born:
97.5% (13,954)
Two or more races - Speak only English Native:
67.3% (14,781)Foreign-born:
2.6% (315)
Two or more races - Speak another language Native:
32.7% (7,194)Foreign-born:
97.4% (11,588)
White alone - Speak only English Native:
97.3% (52,497)Foreign-born:
37.4% (1,402)
White alone - Speak another language Native:
2.7% (1,453)Foreign-born:
62.6% (2,350)
Hispanic or Latino - Speak only English Native:
46.6% (18,537)Foreign-born:
3.0% (806)
Hispanic or Latino - Speak another language Native:
53.4% (21,257)Foreign-born:
97.0% (26,492)
Foreign-born residents in Paradise 52,239 residents are foreign born (14.9% Latin America , 8.9% Asia ).
This city:
26.9%Nevada:
19.1%
Marital status for residents in Paradise Marital status - White (Caucasian) population 15 years and over
Males 42.9% Never married39.4% Now married1.1% Separated1.3% Widowed15.3% DivorcedFemales 32.5% Never married39.0% Now married1.1% Separated9.4% Widowed18.1% DivorcedWomen who gave birth in the past 12 months Now married:
86.3% (377)Unmarried:
13.7% (60)
Women who did not give birth in the past 12 months Now married:
34.2% (5,375)Unmarried:
65.8% (10,337)
Marital status - Black or African American population 15 years and over
Males 59.0% Never married25.6% Now married2.5% Separated0.0% Widowed12.9% DivorcedFemales 65.2% Never married12.7% Now married4.5% Separated8.6% Widowed9.0% DivorcedWomen who gave birth in the past 12 months Now married:
34.7% (136)Unmarried:
65.3% (256)
Women who did not give birth in the past 12 months Now married:
16.7% (1,290)Unmarried:
83.3% (6,445)
Marital status - American Indian / Alaska Native population 15 years and over
Males 60.4% Never married30.4% Now married0.0% Separated2.0% Widowed7.2% DivorcedFemales 49.2% Never married28.1% Now married3.3% Separated7.1% Widowed12.3% DivorcedWomen who gave birth in the past 12 months Now married:
0.0% (0)Unmarried:
100.0% (16)
Women who did not give birth in the past 12 months Now married:
25.8% (214)Unmarried:
74.2% (615)
Marital status - Asian population 15 years and over
Males 42.8% Never married44.1% Now married1.9% Separated1.4% Widowed9.7% DivorcedFemales 16.4% Never married51.6% Now married6.0% Separated12.7% Widowed13.3% DivorcedWomen who gave birth in the past 12 months Now married:
86.4% (192)Unmarried:
13.6% (30)
Women who did not give birth in the past 12 months Now married:
52.5% (2,875)Unmarried:
47.5% (2,601)
Marital status - Native Hawaiian / Pacific Islander population 15 years and over
Males 44.5% Never married44.0% Now married0.0% Separated0.0% Widowed11.5% DivorcedFemales 51.3% Never married29.2% Now married1.1% Separated10.2% Widowed8.2% DivorcedWomen who gave birth in the past 12 months Now married:
52.1% (27)Unmarried:
47.9% (25)
Women who did not give birth in the past 12 months Now married:
24.3% (129)Unmarried:
75.7% (400)
Marital status - Other race population 15 years and over
Males 43.9% Never married45.0% Now married0.0% Separated0.2% Widowed10.8% DivorcedFemales 32.4% Never married41.4% Now married4.7% Separated5.8% Widowed15.7% DivorcedWomen who gave birth in the past 12 months Now married:
100.0% (511)Unmarried:
0.0% (0)
Women who did not give birth in the past 12 months Now married:
43.2% (3,015)Unmarried:
56.8% (3,962)
Marital status - Two or more races population 15 years and over
Males 49.1% Never married39.2% Now married0.1% Separated1.9% Widowed9.7% DivorcedFemales 41.6% Never married32.5% Now married5.8% Separated4.7% Widowed15.3% DivorcedWomen who gave birth in the past 12 months Now married:
100.0% (497)Unmarried:
0.0% (0)
Women who did not give birth in the past 12 months Now married:
31.2% (3,443)Unmarried:
68.8% (7,589)
Marital status - White alone, not Hispanic / Latino population 15 years and over
Males 41.8% Never married39.5% Now married1.3% Separated1.5% Widowed15.9% DivorcedFemales 30.5% Never married40.4% Now married1.0% Separated9.8% Widowed18.3% DivorcedWomen who gave birth in the past 12 months Now married:
86.3% (377)Unmarried:
13.7% (60)
Women who did not give birth in the past 12 months Now married:
35.3% (4,320)Unmarried:
64.7% (7,933)
Marital status - Hispanic or Latino population 15 years and over
Males 46.3% Never married42.5% Now married0.0% Separated0.9% Widowed10.2% DivorcedFemales 37.7% Never married37.5% Now married5.1% Separated5.3% Widowed14.3% DivorcedWomen who gave birth in the past 12 months Now married:
100.0% (848)Unmarried:
0.0% (0)
Women who did not give birth in the past 12 months Now married:
37.4% (7,402)Unmarried:
62.6% (12,374)
Ancestries in Paradise
4,377 3.8% English3,358 2.9% American3,305 2.8% German3,291 2.8% Irish3,258 2.8% Italian1,587 1.4% African1,114 1.0% European851 0.7% Polish580 0.5% Scottish452 0.4% Norwegian389 0.3% Hungarian385 0.3% French340 0.3% Ethiopian333 0.3% British299 0.3% Russian286 0.2% Moroccan280 0.2% Jordanian268 0.2% Jamaican237 0.2% Dutch224 0.2% Greek215 0.2% Iranian203 0.2% Nigerian195 0.2% Ugandan191 0.2% Ukrainian189 0.2% French Canadian179 0.2% Eastern European172 0.1% Lebanese165 0.1% Armenian163 0.1% Palestinian160 0.1% Lithuanian153 0.1% Romanian147 0.1% Israeli141 0.1% Brazilian137 0.1% Syrian132 0.1% Swedish131 0.1% Arab129 0.1% Portuguese128 0.1% Scotch-Irish124 0.1% Welsh116 0.10% Somali115 0.10% Scandinavian108 0.09% Canadian106 0.09% Trinidadian and Tobagonian96 0.08% Sudanese89 0.08% Haitian83 0.07% Czech81 0.07% Albanian81 0.07% British West Indian80 0.07% Afghan69 0.06% Bulgarian69 0.06% Belizean64 0.05% Liberian61 0.05% Swiss57 0.05% Turkish56 0.05% Yugoslavian49 0.04% Iraqi49 0.04% Northern European45 0.04% Slavic43 0.04% Serbian42 0.04% Danish40 0.03% Slovak38 0.03% Macedonian37 0.03% Slovene33 0.03% Finnish31 0.03% Austrian31 0.03% West Indian30 0.03% Australian27 0.02% Basque22 0.02% Belgian18 0.02% Czechoslovakian17 0.01% Cajun17 0.01% Croatian16 0.01% Icelander11 0.01% German Russian10 0.01% New Zealander7 0.01% Assyrian7 0.01% Latvian
Geographical mobility in Paradise Same house 1 year ago 62,424 85.0% White (Caucasian)19,462 88.5% Black or African American1,992 81.9% American Indian / Alaska Native16,267 89.3% Asian1,080 66.3% Native Hawaiian / Pacific Islander23,240 84.6% Other race30,514 85.2% Two or more races51,337 87.3% White alone, not Hispanic / Latino59,196 83.1% Hispanic or LatinoMoved within same county 6,984 9.5% White / Caucasian1,756 8.0% Black or African American262 10.8% American Indian / Alaska Native757 4.2% Asian357 21.9% Native Hawaiian / Pacific Islander3,713 13.5% Other race2,894 8.1% Two or more races3,655 6.2% White alone, not Hispanic / Latino9,751 13.7% Hispanic or LatinoMoved within same state 163 0.2% White / Caucasian41 0.1% Other race53 0.1% Two or more races163 0.3% White alone, not Hispanic / Latino94 0.1% Hispanic or LatinoMoved from different state 3,747 5.1% White / Caucasian654 3.0% Black or African American85 3.5% American Indian / Alaska Native790 4.3% Asian67 4.1% Native Hawaiian / Pacific Islander472 1.7% Other race2,188 6.1% Two or more races3,573 6.1% White alone, not Hispanic / Latino1,973 2.8% Hispanic or LatinoMoved from abroad 105 0.1% White107 0.5% Black or African American410 2.2% Asian39 2.4% Native Hawaiian / Pacific Islander179 0.5% Two or more races105 0.2% White alone, not Hispanic / Latino179 0.3% Hispanic or Latino
Children Nativity (place of birth) in Paradise
Children under 6 years - Living with two parents Both parents native 2,879 100.0% NativeBoth parents foreign-born 1,855 91.2% Native178 8.8% Foreign-bornOne native, one foreign-born parent 842 100.0% NativeChildren under 6 years - Living with one parent Native parent 4,554 100.0% NativeForeign-born parent 1,069 83.3% Native215 16.7% Foreign-bornChildren 6 to 17 years - Living with two parents Both parents native 7,386 100.0% NativeBoth parents foreign-born 3,163 82.5% Native670 17.5% Foreign-bornOne native, one foreign-born parent 1,335 100.0% NativeChildren 6 to 17 years - Living with one parent Native parent 7,277 100.0% NativeForeign-born parent 3,460 58.6% Native2,446 41.4% Foreign-born
Place of birth for residents in Paradise 29,413 Americas28,820 Latin America20,025 Central America17,209 Asia11,487 South Eastern Asia6,038 Caribbean2,900 Europe2,755 South America2,661 Eastern Asia2,363 South Central Asia2,287 Africa1,501 China1,371 Eastern Africa1,222 Eastern Europe738 Western Europe662 Western Asia650 Northern Europe593 Northern America466 Northern Africa428 Oceania289 Southern Europe255 Western Africa143 Australia and New Zealand Subregion130 Middle Africa63 Southern Africa14,669 Mexico9,132 Philippines5,482 Cuba3,012 El Salvador1,485 Vietnam1,452 Guatemala1,303 India1,034 China734 Korea676 Ethiopia602 Brazil593 Canada537 Germany475 Venezuela434 Peru433 Argentina425 Japan391 Colombia389 Thailand388 Honduras341 Taiwan299 England293 Nicaragua245 Romania243 Iran225 Chile214 Israel204 Bhutan200 Uganda195 United Kingdom184 Nepal183 Pakistan182 Kenya177 Cambodia161 Russia156 Egypt154 Ukraine151 Jamaica149 Afghanistan146 Morocco142 Belize129 Lebanon125 Hong Kong123 Laos113 Guyana110 Indonesia109 Trinidad and Tobago105 Hungary102 Croatia97 Eritrea97 Nigeria96 Bulgaria95 Togo95 Greece94 Portugal94 Democratic Republic of Congo (Zaire)87 Sri Lanka86 Bosnia and Herzegovina81 Australia76 Haiti72 Italy72 Iraq71 Somalia71 Syria71 Dominican Republic64 Algeria63 South Africa62 Sweden62 Panama61 France61 New Zealand61 Ecuador56 Poland54 Sudan53 Albania53 Ireland53 Zimbabwe52 West Indies52 Switzerland43 Saudi Arabia41 Czechoslovakia41 Jordan39 Belgium38 Malaysia37 Austria36 Cameroon31 Armenia31 Liberia29 Serbia28 Belarus27 Micronesia24 Ghana23 Tanzania23 Singapore22 Yemen22 Lithuania19 North Macedonia (Macedonia)18 United Arab Emirates15 Turkey14 Fiji12 Denmark12 Bolivia11 Norway10 Spain10 Netherlands8 Moldova6 Costa Rica6 Uruguay6 Burma (Myanmar)5 Latvia
Grandparents responsible for own grandchildren in Paradise
Grandparents (30 to 59 years) White / Caucasian 149 33.1% Responsible for grandchildren301 66.9% Not responsible for grandchildrenBlack or African American 163 66.4% Responsible for grandchildren82 33.6% Not responsible for grandchildrenAmerican Indian / Alaska Native 8 3.9% Responsible for grandchildren192 96.1% Not responsible for grandchildrenAsian 111 100.0% Not responsible for grandchildrenNative Hawaiian / Pacific Islander 24 100.0% Not responsible for grandchildrenOther race 143 30.9% Responsible for grandchildren320 69.1% Not responsible for grandchildrenTwo or more races 27 17.3% Responsible for grandchildren128 82.7% Not responsible for grandchildrenWhite alone, not Hispanic / Latino 142 37.1% Responsible for grandchildren240 62.9% Not responsible for grandchildrenHispanic or Latino 129 16.8% Responsible for grandchildren641 83.2% Not responsible for grandchildrenGrandparents (60 years and over) White / Caucasian 159 24.9% Responsible for grandchildren479 75.1% Not responsible for grandchildrenBlack or African American 46 20.0% Responsible for grandchildren185 80.0% Not responsible for grandchildrenAmerican Indian / Alaska Native 18 100.0% Responsible for grandchildrenAsian 266 25.7% Responsible for grandchildren768 74.3% Not responsible for grandchildrenNative Hawaiian / Pacific Islander 4 100.0% Not responsible for grandchildrenOther race 90 23.6% Responsible for grandchildren292 76.4% Not responsible for grandchildrenTwo or more races 17 6.6% Responsible for grandchildren236 93.4% Not responsible for grandchildrenWhite alone, not Hispanic / Latino 181 33.1% Responsible for grandchildren367 66.9% Not responsible for grandchildrenHispanic or Latino 69 9.0% Responsible for grandchildren698 91.0% Not responsible for grandchildren