Races in Parkman, Maine (ME) Detailed Stats
Ancestries, Foreign-born residents, place of birth

Recent posts about races in Parkman, Maine on our local forum with over 2,400,000 registered users:
 | How do people afford to live in Maine (111 replies) |
| UPDATE'S, Where are you in life, and your move to Maine (1003 replies) |
| Any site that lists real estate tax by county? (26 replies) |
1.6% of Parkman, ME residents are foreign-born , which is 87.2% less than the foreign-born rate of 3.0% across the entire state of Maine.
Race distribution in Parkman

- 79197.5%White alone
- 70.9%Two or more races
- 70.9%Black alone
- 40.5%Hispanic
- 10.1%Asian alone
- 10.1%American Indian alone

2000
2022
-
- 1,230,29796.5%White alone
- 11,7310.9%Two or more races
- 9,3600.7%Hispanic
- 9,0140.7%Asian alone
- 6,4400.5%Black alone
- 6,9110.5%American Indian alone
- 8360.07%Other race alone
- 3340.03%Native Hawaiian and Other
Pacific Islander alone

-
- 1,249,23390.2%White alone
- 58,3574.2%Two or more races
- 28,7172.1%Hispanic
- 21,5831.6%Black alone
- 16,1511.2%Asian alone
- 5,8730.4%Other race alone
- 5,2050.4%American Indian alone
- 2210.02%Native Hawaiian and Other
Pacific Islander alone

Income and house value in Parkman
- Median household income in 2022
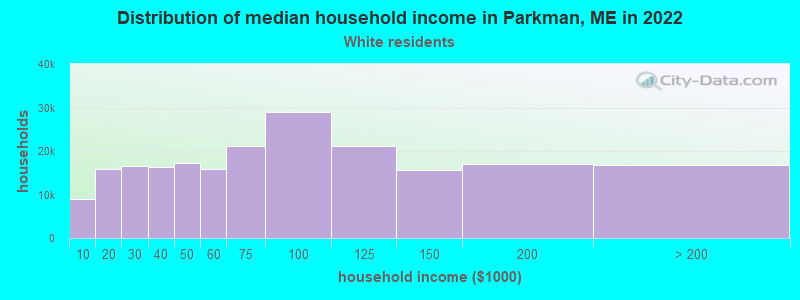
- $52,887White non-Hispanic householders
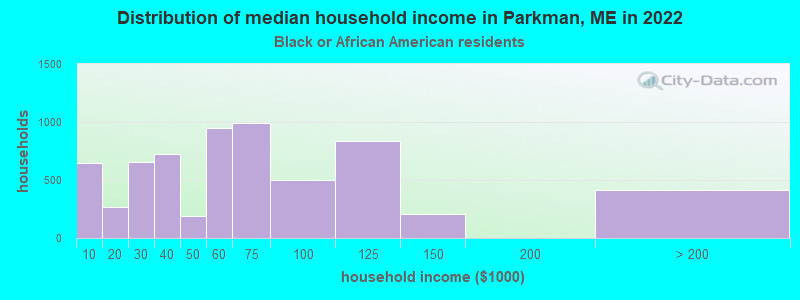
- $38,930Black householders
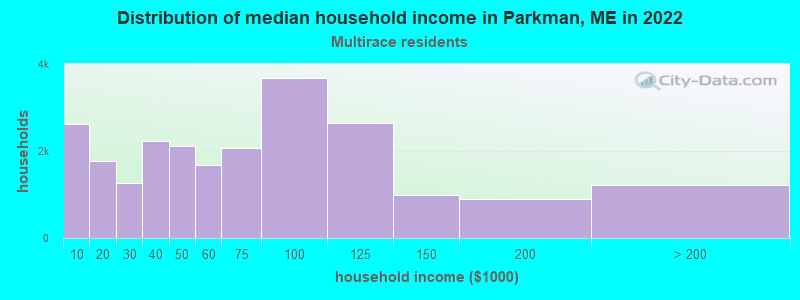
- $102,958Two or more races householders
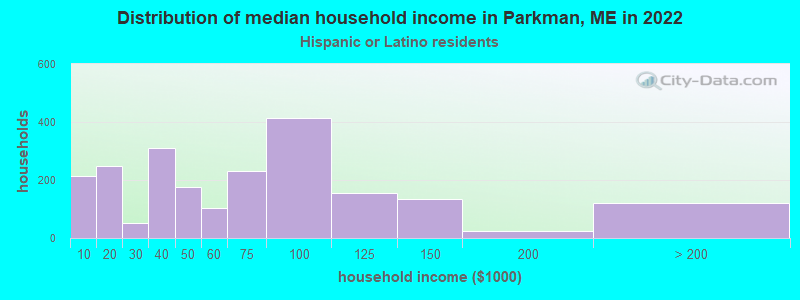
- $10,133Hispanic or Latino race householders
- Median 2022 house value
- $158,379White Non-Hispanic householders
- $221,055Two or more races householders
Household income for White non-Hispanic householders
Household income for Black householders
Household income for Two or more races householders
Household income for Hispanic or Latino race householders
Foreign-born residents in Parkman
13 residents are foreign born
| This city: | 1.6% |
| Maine: | 2.9% |
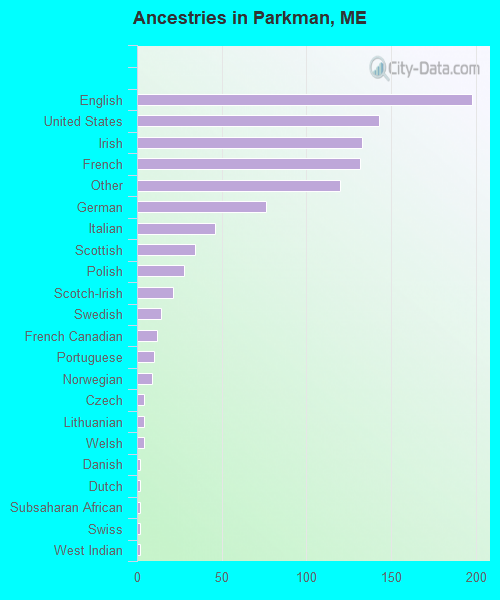
Ancestries in Parkman

- 19819.8%English
- 14314.3%United States
- 13313.3%Irish
- 13213.2%French
- 12012.0%Other
- 767.6%German
- 464.6%Italian
- 343.4%Scottish
- 282.8%Polish
- 212.1%Scotch-Irish
- 141.4%Swedish
- 121.2%French Canadian
- 101.0%Portuguese
- 90.9%Norwegian
- 40.4%Czech
- 40.4%Lithuanian
- 40.4%Welsh
- 20.2%Danish
- 20.2%Dutch
- 20.2%Subsaharan African
- 20.2%Swiss
- 20.2%West Indian
Zip codes: 04443.