Races in Parkwood, Washington (WA) Detailed Stats
Data:
Races - White alone (%)
Races - White alone (% change since 2000)
Races - Black alone (%)
Races - Black alone (% change since 2000)
Races - American Indian alone (%)
Races - American Indian alone (% change since 2000)
Races - Asian alone (%)
Races - Asian alone (% change since 2000)
Races - Hispanic (%)
Races - Hispanic (% change since 2000)
Races - Native Hawaiian and Other Pacific Islander alone (%)
Races - Native Hawaiian and Other Pacific Islander alone (% change since 2000)
Races - Two or more races(%)
Races - Two or more races(% change since 2000)
Races - Other race alone (%)
Races - Other race alone (% change since 2000)
Racial diversity
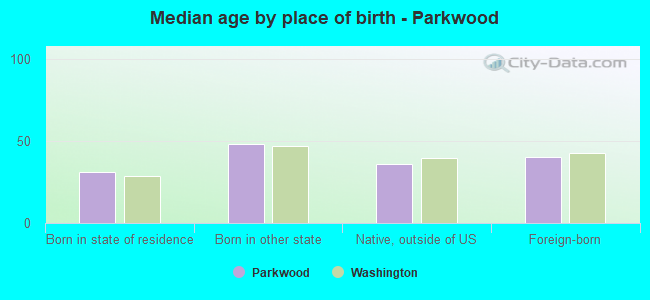
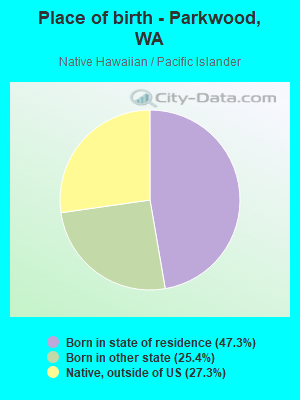
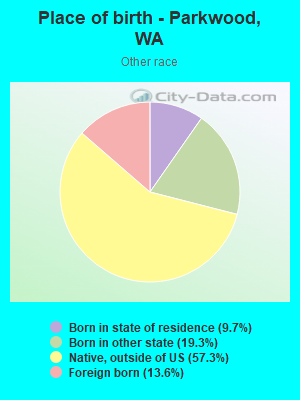
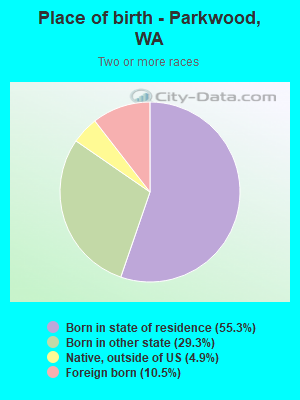
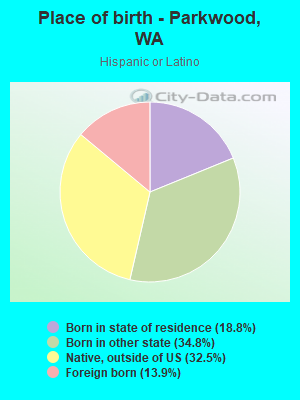
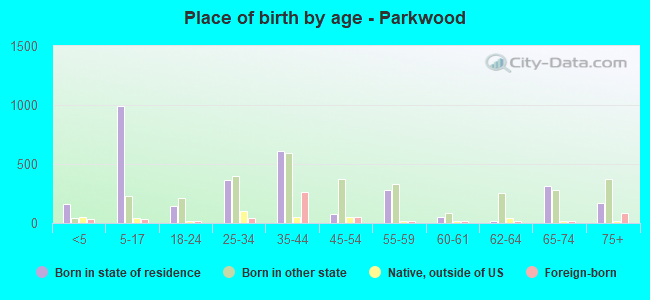
Place of birth - Born in state of residence (%)
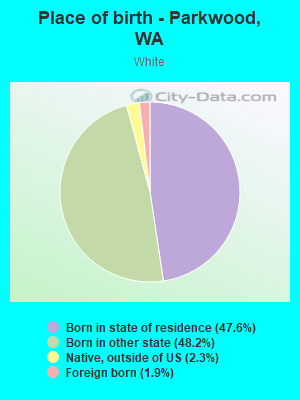
Place of birth - Born in state of residence (%) - White
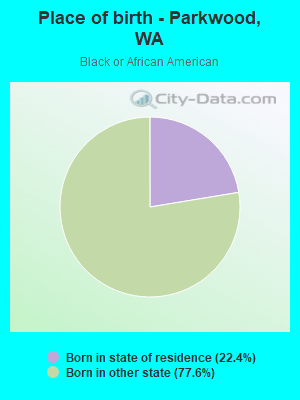
Place of birth - Born in state of residence (%) - Black or African American
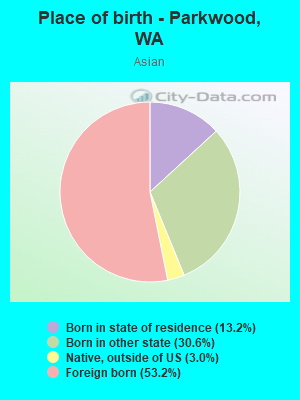
Place of birth - Born in state of residence (%) - Asian
Place of birth - Born in state of residence (%) - Hispanic or Latino
Place of birth - Born in state of residence (%) - American Indian and Alaska Native
Place of birth - Born in state of residence (%) - Multirace
Place of birth - Born in state of residence (%) - Other Race
Place of birth - Born in other state (%)
Place of birth - Born in other state (%) - White
Place of birth - Born in other state (%) - Black or African American
Place of birth - Born in other state (%) - Asian
Place of birth - Born in other state (%) - Hispanic or Latino
Place of birth - Born in other state (%) - American Indian and Alaska Native
Place of birth - Born in other state (%) - Multirace
Place of birth - Born in other state (%) - Other Race
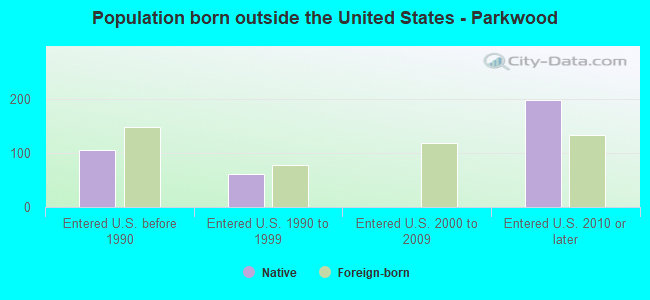
Place of birth - Native, outside of US (%)
Place of birth - Native, outside of US (%) - White
Place of birth - Native, outside of US (%) - Black or African American
Place of birth - Native, outside of US (%) - Asian
Place of birth - Native, outside of US (%) - Hispanic or Latino
Place of birth - Native, outside of US (%) - American Indian and Alaska Native
Place of birth - Native, outside of US (%) - Multirace
Place of birth - Native, outside of US (%) - Other Race
Place of birth - Foreign born (%)
Place of birth - Foreign born (%) - White
Place of birth - Foreign born (%) - Black or African American
Place of birth - Foreign born (%) - Asian
Place of birth - Foreign born (%) - Hispanic or Latino
Place of birth - Foreign born (%) - American Indian and Alaska Native
Place of birth - Foreign born (%) - Multirace
Place of birth - Foreign born (%) - Other Race
Residents speaking English at home (%)
Residents speaking English at home - Born in the United States (%)
Residents speaking English at home - Native, born elsewhere (%)
Residents speaking English at home - Foreign born (%)
Residents speaking Spanish at home (%)
Residents speaking Spanish at home - Born in the United States (%)
Residents speaking Spanish at home - Native, born elsewhere (%)
Residents speaking Spanish at home - Foreign born (%)
Residents speaking other language at home (%)
Residents speaking other language at home - Born in the United States (%)
Residents speaking other language at home - Native, born elsewhere (%)
Residents speaking other language at home - Foreign born (%)
Marital status - Never married (%)
Marital status - Now married (%)
Marital status - Separated (%)
Marital status - Widowed (%)
Marital status - Divorced (%)
Ancestries Reported - Arab (%)
Ancestries Reported - Czech (%)
Ancestries Reported - Danish (%)
Ancestries Reported - Dutch (%)
Ancestries Reported - English (%)
Ancestries Reported - French (%)
Ancestries Reported - French Canadian (%)
Ancestries Reported - German (%)
Ancestries Reported - Greek (%)
Ancestries Reported - Hungarian (%)
Ancestries Reported - Irish (%)
Ancestries Reported - Italian (%)
Ancestries Reported - Lithuanian (%)
Ancestries Reported - Norwegian (%)
Ancestries Reported - Polish (%)
Ancestries Reported - Portuguese (%)
Ancestries Reported - Russian (%)
Ancestries Reported - Scotch-Irish (%)
Ancestries Reported - Scottish (%)
Ancestries Reported - Slovak (%)
Ancestries Reported - Subsaharan African (%)
Ancestries Reported - Swedish (%)
Ancestries Reported - Swiss (%)
Ancestries Reported - Ukrainian (%)
Ancestries Reported - United States (%)
Ancestries Reported - Welsh (%)
Ancestries Reported - West Indian (%)
Ancestries Reported - Other (%)
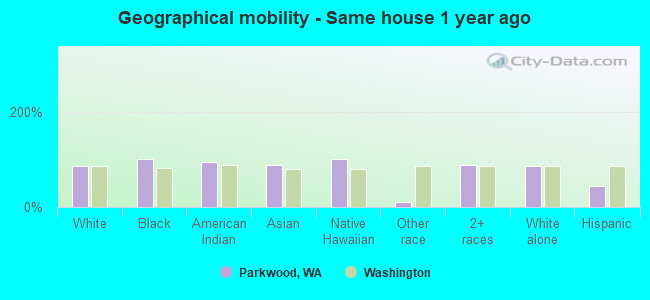
Geographical mobility - Same house 1 year ago (%)
Geographical mobility - Same house 1 year ago (%) - White
Geographical mobility - Same house 1 year ago (%) - Black or African American
Geographical mobility - Same house 1 year ago (%) - Asian
Geographical mobility - Same house 1 year ago (%) - Hispanic or Latino
Geographical mobility - Same house 1 year ago (%) - American Indian and Alaska Native
Geographical mobility - Same house 1 year ago (%) - Multirace
Geographical mobility - Same house 1 year ago (%) - Other Race
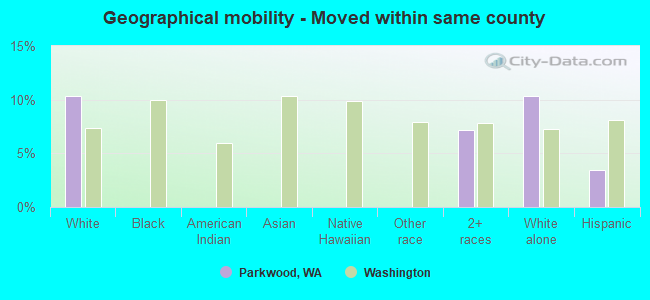
Geographical mobility - Moved within same county (%)
Geographical mobility - Moved within same county (%) - White
Geographical mobility - Moved within same county (%) - Black or African American
Geographical mobility - Moved within same county (%) - Asian
Geographical mobility - Moved within same county (%) - Hispanic or Latino
Geographical mobility - Moved within same county (%) - American Indian and Alaska Native
Geographical mobility - Moved within same county (%) - Multirace
Geographical mobility - Moved within same county (%) - Other Race
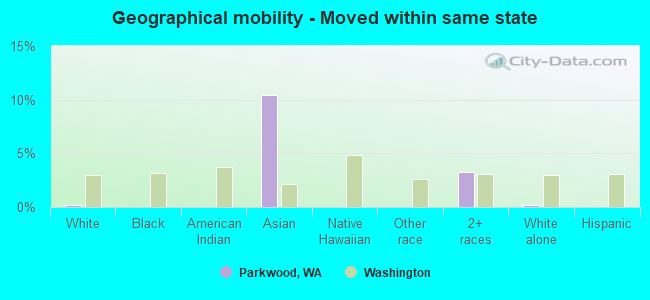
Geographical mobility - Moved from different county within same state (%)
Geographical mobility - Moved from different county within same state (%) - White
Geographical mobility - Moved from different county within same state (%) - Black or African American
Geographical mobility - Moved from different county within same state (%) - Asian
Geographical mobility - Moved from different county within same state (%) - Hispanic or Latino
Geographical mobility - Moved from different county within same state (%) - American Indian and Alaska Native
Geographical mobility - Moved from different county within same state (%) - Multirace
Geographical mobility - Moved from different county within same state (%) - Other Race
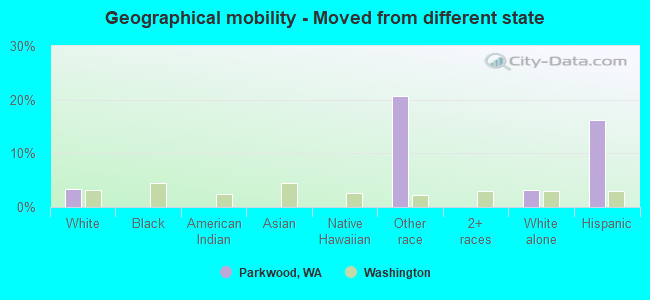
Geographical mobility - Moved from different state (%)
Geographical mobility - Moved from different state (%) - White
Geographical mobility - Moved from different state (%) - Black or African American
Geographical mobility - Moved from different state (%) - Asian
Geographical mobility - Moved from different state (%) - Hispanic or Latino
Geographical mobility - Moved from different state (%) - American Indian and Alaska Native
Geographical mobility - Moved from different state (%) - Multirace
Geographical mobility - Moved from different state (%) - Other Race
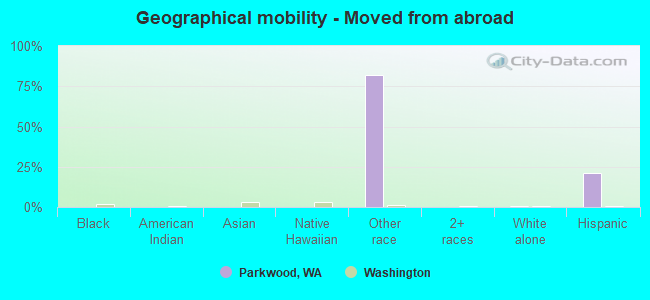
Geographical mobility - Moved from abroad (%)
Geographical mobility - Moved from abroad (%) - White
Geographical mobility - Moved from abroad (%) - Black or African American
Geographical mobility - Moved from abroad (%) - Asian
Geographical mobility - Moved from abroad (%) - Hispanic or Latino
Geographical mobility - Moved from abroad (%) - American Indian and Alaska Native
Geographical mobility - Moved from abroad (%) - Multirace
Geographical mobility - Moved from abroad (%) - Other Race
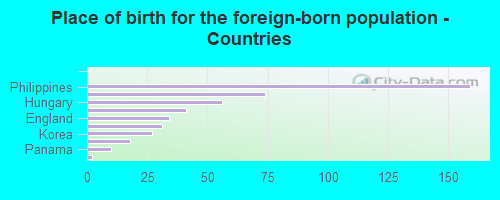
Place of birth for the foreign-born population - Ireland (%)
Place of birth for the foreign-born population - Denmark (%)
Place of birth for the foreign-born population - Norway (%)
Place of birth for the foreign-born population - Sweden (%)
Place of birth for the foreign-born population - United Kingdom (%)
Place of birth for the foreign-born population - England (%)
Place of birth for the foreign-born population - Scotland (%)
Place of birth for the foreign-born population - Other Northern Europe (%)
Place of birth for the foreign-born population - Austria (%)
Place of birth for the foreign-born population - Belgium (%)
Place of birth for the foreign-born population - France (%)
Place of birth for the foreign-born population - Germany (%)
Place of birth for the foreign-born population - Netherlands (%)
Place of birth for the foreign-born population - Switzerland (%)
Place of birth for the foreign-born population - Other Western Europe (%)
Place of birth for the foreign-born population - Greece (%)
Place of birth for the foreign-born population - Italy (%)
Place of birth for the foreign-born population - Portugal (%)
Place of birth for the foreign-born population - Spain (%)
Place of birth for the foreign-born population - Other Southern Europe (%)
Place of birth for the foreign-born population - Albania (%)
Place of birth for the foreign-born population - Belarus (%)
Place of birth for the foreign-born population - Bosnia and Herzegovina (%)
Place of birth for the foreign-born population - Bulgaria (%)
Place of birth for the foreign-born population - Croatia (%)
Place of birth for the foreign-born population - Czechoslovakia (%)
Place of birth for the foreign-born population - Hungary (%)
Place of birth for the foreign-born population - Latvia (%)
Place of birth for the foreign-born population - Lithuania (%)
Place of birth for the foreign-born population - North Macedonia (Macedonia) (%)
Place of birth for the foreign-born population - Moldova (%)
Place of birth for the foreign-born population - Poland (%)
Place of birth for the foreign-born population - Romania (%)
Place of birth for the foreign-born population - Russia (%)
Place of birth for the foreign-born population - Serbia (%)
Place of birth for the foreign-born population - Ukraine (%)
Place of birth for the foreign-born population - Other Eastern Europe (%)
Place of birth for the foreign-born population - China (%)
Place of birth for the foreign-born population - Hong Kong (%)
Place of birth for the foreign-born population - Taiwan (%)
Place of birth for the foreign-born population - Japan (%)
Place of birth for the foreign-born population - Korea (%)
Place of birth for the foreign-born population - Other Eastern Asia (%)
Place of birth for the foreign-born population - Afghanistan (%)
Place of birth for the foreign-born population - Bangladesh (%)
Place of birth for the foreign-born population - India (%)
Place of birth for the foreign-born population - Iran (%)
Place of birth for the foreign-born population - Kazakhstan (%)
Place of birth for the foreign-born population - Nepal (%)
Place of birth for the foreign-born population - Pakistan (%)
Place of birth for the foreign-born population - Sri Lanka (%)
Place of birth for the foreign-born population - Uzbekistan (%)
Place of birth for the foreign-born population - Other South Central Asia (%)
Place of birth for the foreign-born population - Burma (%)
Place of birth for the foreign-born population - Cambodia (%)
Place of birth for the foreign-born population - Indonesia (%)
Place of birth for the foreign-born population - Laos (%)
Place of birth for the foreign-born population - Malaysia (%)
Place of birth for the foreign-born population - Philippines (%)
Place of birth for the foreign-born population - Singapore (%)
Place of birth for the foreign-born population - Thailand (%)
Place of birth for the foreign-born population - Vietnam (%)
Place of birth for the foreign-born population - Other South Eastern Asia (%)
Place of birth for the foreign-born population - Armenia (%)
Place of birth for the foreign-born population - Iraq (%)
Place of birth for the foreign-born population - Israel (%)
Place of birth for the foreign-born population - Jordan (%)
Place of birth for the foreign-born population - Kuwait (%)
Place of birth for the foreign-born population - Lebanon (%)
Place of birth for the foreign-born population - Saudi Arabia (%)
Place of birth for the foreign-born population - Syria (%)
Place of birth for the foreign-born population - Turkey (%)
Place of birth for the foreign-born population - Yemen (%)
Place of birth for the foreign-born population - Other Western Asia (%)
Place of birth for the foreign-born population - Eritrea (%)
Place of birth for the foreign-born population - Ethiopia (%)
Place of birth for the foreign-born population - Kenya (%)
Place of birth for the foreign-born population - Somalia (%)
Place of birth for the foreign-born population - Uganda (%)
Place of birth for the foreign-born population - Zimbabwe (%)
Place of birth for the foreign-born population - Other Eastern Africa (%)
Place of birth for the foreign-born population - Cameroon (%)
Place of birth for the foreign-born population - Congo (%)
Place of birth for the foreign-born population - Democratic Republic of Congo (Zaire) (%)
Place of birth for the foreign-born population - Other Middle Africa (%)
Place of birth for the foreign-born population - Egypt (%)
Place of birth for the foreign-born population - Morocco (%)
Place of birth for the foreign-born population - Sudan (%)
Place of birth for the foreign-born population - Other Northern Africa (%)
Place of birth for the foreign-born population - South Africa (%)
Place of birth for the foreign-born population - Other Southern Africa (%)
Place of birth for the foreign-born population - Cabo Verde (%)
Place of birth for the foreign-born population - Ghana (%)
Place of birth for the foreign-born population - Liberia (%)
Place of birth for the foreign-born population - Nigeria (%)
Place of birth for the foreign-born population - Senegal (%)
Place of birth for the foreign-born population - Sierra Leone (%)
Place of birth for the foreign-born population - Other Western Africa (%)
Place of birth for the foreign-born population - Australia (%)
Place of birth for the foreign-born population - New Zealand (%)
Place of birth for the foreign-born population - Fiji (%)
Place of birth for the foreign-born population - Micronesia (%)
Place of birth for the foreign-born population - Bahamas (%)
Place of birth for the foreign-born population - Barbados (%)
Place of birth for the foreign-born population - Cuba (%)
Place of birth for the foreign-born population - Dominica (%)
Place of birth for the foreign-born population - Dominican Republic (%)
Place of birth for the foreign-born population - Grenada (%)
Place of birth for the foreign-born population - Haiti (%)
Place of birth for the foreign-born population - Jamaica (%)
Place of birth for the foreign-born population - St. Vincent and the Grenadines (%)
Place of birth for the foreign-born population - Trinidad and Tobago (%)
Place of birth for the foreign-born population - West Indies (%)
Place of birth for the foreign-born population - Other Caribbean (%)
Place of birth for the foreign-born population - Belize (%)
Place of birth for the foreign-born population - Costa Rica (%)
Place of birth for the foreign-born population - El Salvador (%)
Place of birth for the foreign-born population - Guatemala (%)
Place of birth for the foreign-born population - Honduras (%)
Place of birth for the foreign-born population - Mexico (%)
Place of birth for the foreign-born population - Nicaragua (%)
Place of birth for the foreign-born population - Panama (%)
Place of birth for the foreign-born population - Other Central America (%)
Place of birth for the foreign-born population - Argentina (%)
Place of birth for the foreign-born population - Bolivia (%)
Place of birth for the foreign-born population - Brazil (%)
Place of birth for the foreign-born population - Chile (%)
Place of birth for the foreign-born population - Colombia (%)
Place of birth for the foreign-born population - Ecuador (%)
Place of birth for the foreign-born population - Guyana (%)
Place of birth for the foreign-born population - Peru (%)
Place of birth for the foreign-born population - Uruguay (%)
Place of birth for the foreign-born population - Venezuela (%)
Place of birth for the foreign-born population - Other South America (%)
Place of birth for the foreign-born population - Canada (%)
Place of birth for the foreign-born population - Other Northern America (%)
Place of birth for the foreign-born population - Other (%)
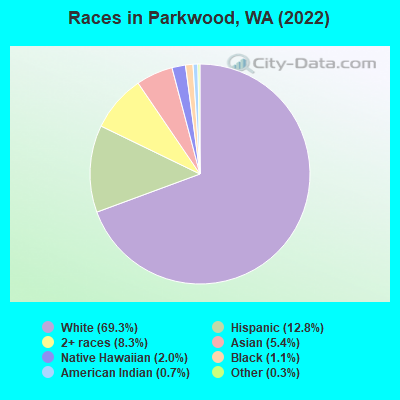
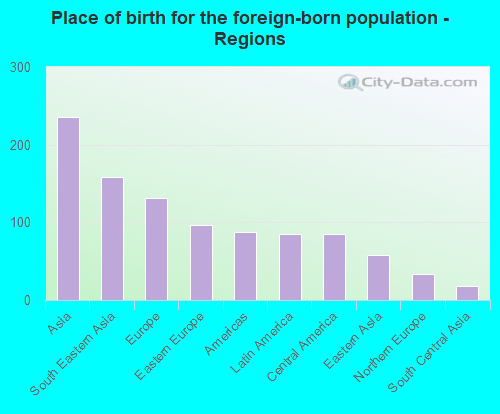
According to 2022 data, the most numerous races in Parkwood, WA are White alone (5,102 residents), Hispanic (941 residents), and Asian alone (397 residents). 87.5% of Parkwood residents speak English at home. 6.2% of Parkwood, WA residents are foreign-born (3.1% born in Asia, 1.7% born in Europe, 1.1% born in Latin America), which is 142.7% less than the foreign-born rate of 15.0% across the entire state of Washington.
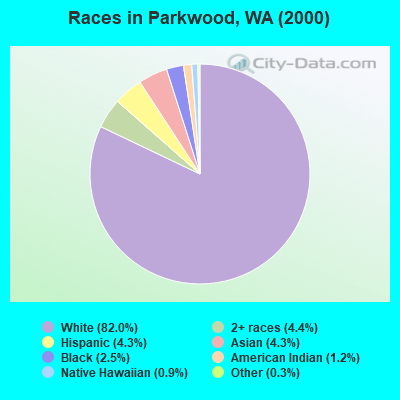
Race distribution in Parkwood
2000 2022
4,652,490 78.9% White alone 441,509 7.5% Hispanic 319,401 5.4% Asian alone 184,631 3.1% Black alone 175,926 3.0% Two or more races 85,396 1.4% American Indian alone 22,779 0.4% Native Hawaiian and Other 11,989 0.2% Other race alone
4,941,456 63.5% White alone 1,093,313 14.0% Hispanic 755,832 9.7% Asian alone 523,448 6.7% Two or more races 299,537 3.8% Black alone 69,024 0.9% American Indian alone 52,231 0.7% Native Hawaiian and Other 50,945 0.7% Other race alone
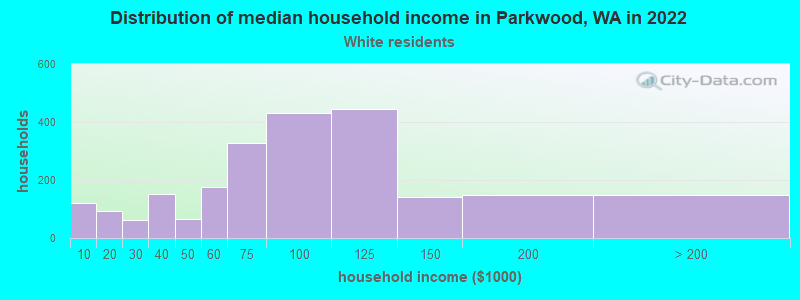
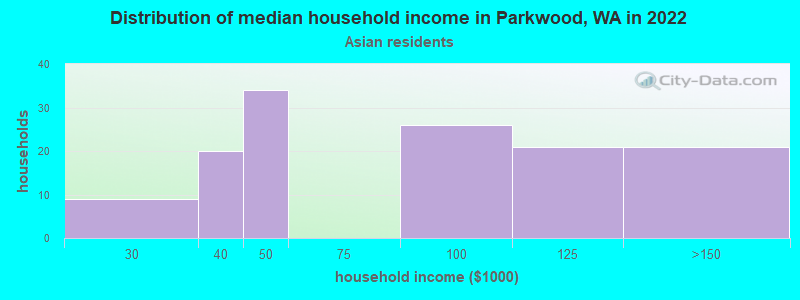
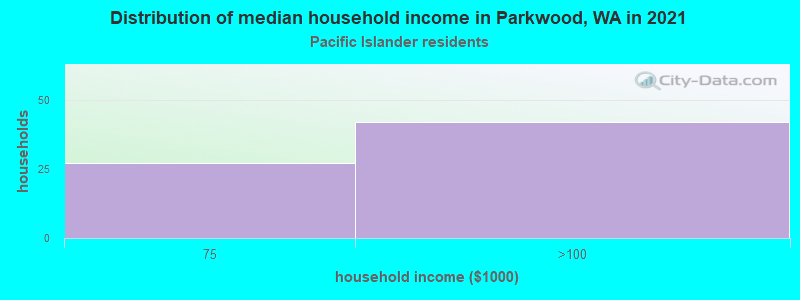
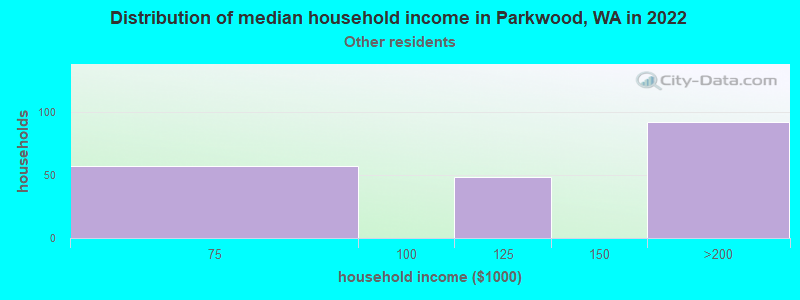
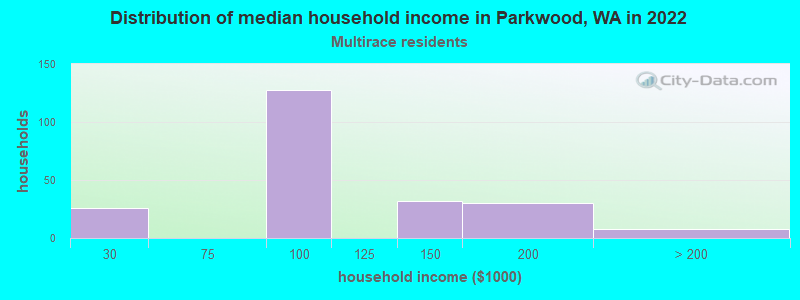
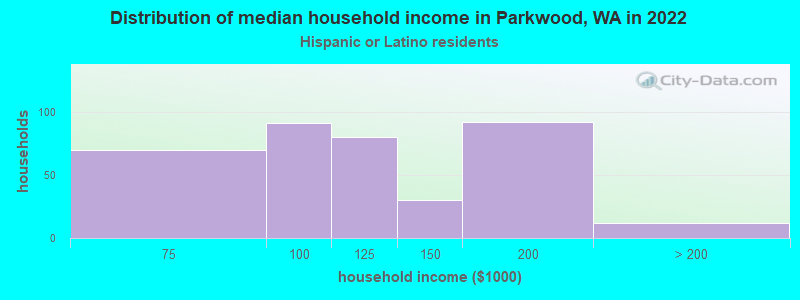
Income and house value in Parkwood Median household income in 2022 $86,797 White non-Hispanic householders$108,132 Asian householders$94,790 Two or more races householders$107,891 Hispanic or Latino race householdersMedian 2022 house value $445,846 White Non-Hispanic householdersover $1,000,000 Black or African American householders$488,171 American Indian or Alaska Native householders $470,954 Asian householders$403,521 Native Hawaiian and other Pacific Islander householders$479,922 Two or more races householders$435,086 Hispanic or Latino householders
Median age by race in Parkwood
40.1 Median age for White residents41.6 37.6 107.8 Median age for Black or African American residents-873,638,343.4 85.8 -749,999,999.2 Median age for American Indian / Alaska Native residents-820,346,319.5 -649,076,516.5 43.8 Median age for Asian residents43.3 45.0 36.0 Median age for Native Hawaiian / Pacific Islander residents-639,639,639.0 40.6 31.8 Median age for Other race residents32.9 28.1 15.7 Median age for Two or more races residents24.9 15.0 40.8 Median age for White alone residents43.7 37.6 30.6 Median age for Hispanic or Latino residents28.5 31.6
Owner/renter occupied households by race in Parkwood
House owners and renters - White residents 1,518 67.0% Owner occupied748 33.0% Renter occupiedHouse owners and renters - Black or African American residents 21 100.0% Owner occupiedHouse owners and renters - American Indian / Alaska Native residents 79 100.0% Renter occupiedHouse owners and renters - Asian residents 90 67.6% Owner occupied43 32.4% Renter occupiedHouse owners and renters - Native Hawaiian / Pacific Islander residents 58 84.2% Owner occupied11 15.8% Renter occupiedHouse owners and renters - Other race residents 98 44.2% Owner occupied124 55.8% Renter occupiedHouse owners and renters - Two or more races residents 136 68.3% Owner occupied63 31.7% Renter occupiedHouse owners and renters - White alone residents 1,526 68.5% Owner occupied700 31.5% Renter occupiedHouse owners and renters - Hispanic or Latino residents 182 50.0% Owner occupied182 50.0% Renter occupied
Language usage in Parkwood
English speakers - Total 87.5% of residents of Parkwood speak English at home.
6.1% of residents speak Spanish at home 319 74.7% Speak English very well108 25.3% Speak English less than very well6.4% of residents speak other language at home 319 70.6% Speak English very well133 29.4% Speak English less than very well
English speakers - Born in the United States 96.0% of residents of Parkwood speak English at home.
4.4% of residents speak Spanish at home 115 83.3% Speak English very well23 16.7% Speak English less than very well
English speakers - Native, born elsewhere 57.4% of residents of Parkwood speak English at home.
34.2% of residents speak Spanish at home 87 62.6% Speak English very well52 37.4% Speak English less than very well4.2% of residents speak other language at home 17 100.0% Speak English very well
English speakers - Foreign-born 12.9% of residents of Parkwood speak English at home.
14.8% of residents speak Spanish at home 69 100.0% Speak English very well65.6% of residents speak other language at home 195 63.9% Speak English very well110 36.1% Speak English less than very well
White (Caucasian) - Speak only English Native:
96.4% (4,845)Foreign-born:
39.0% (39)
White (Caucasian) - Speak another language Native:
3.6% (181)Foreign-born:
64.5% (64)
Asian - Speak only English Native:
94.0% (171)Foreign-born:
7.4% (17)
Asian - Speak another language Native:
9.2% (17)Foreign-born:
91.3% (203)
Other race - Speak another language Native:
76.1% (298)Foreign-born:
100.0% (78)
Two or more races - Speak another language Native:
2.0% (15)Foreign-born:
100.0% (55)
White alone - Speak only English Native:
96.4% (4,703)Foreign-born:
30.2% (29)
White alone - Speak another language Native:
3.5% (173)Foreign-born:
81.3% (78)
Hispanic or Latino - Speak only English Native:
64.5% (431)Foreign-born:
9.6% (11)
Hispanic or Latino - Speak another language Native:
36.1% (241)Foreign-born:
90.0% (105)
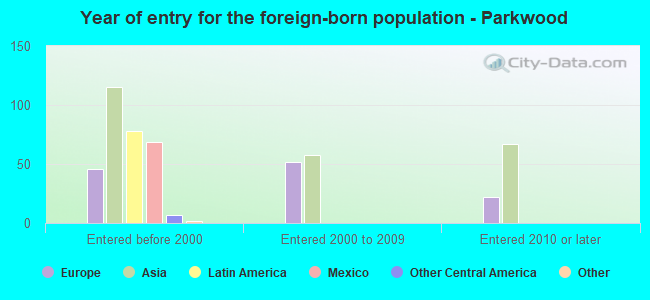
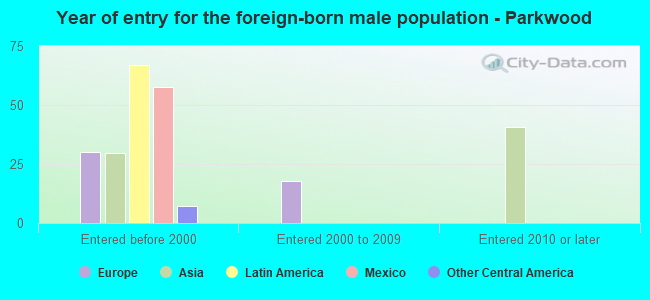
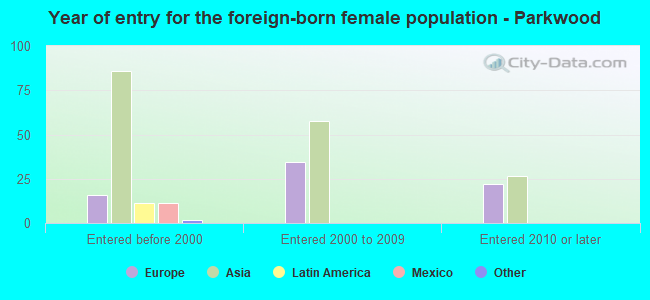
Foreign-born residents in Parkwood 455 residents are foreign born (3.1% Asia , 1.7% Europe , 1.1% Latin America ).
This city:
6.2%Washington:
14.9%
Marital status for residents in Parkwood Marital status - White (Caucasian) population 15 years and over
Males 24.0% Never married58.5% Now married2.0% Separated8.3% Widowed7.1% DivorcedFemales 19.8% Never married55.5% Now married2.6% Separated6.0% Widowed16.0% DivorcedWomen who gave birth in the past 12 months Now married:
100.0% (62)Unmarried:
0.0% (0)
Women who did not give birth in the past 12 months Now married:
45.2% (486)Unmarried:
54.8% (588)
Marital status - Black or African American population 15 years and over
Males 0.0% Never married0.0% Now married0.0% Separated100.0% Widowed0.0% DivorcedFemales 23.5% Never married0.0% Now married0.0% Separated0.0% Widowed76.5% DivorcedWomen who did not give birth in the past 12 months Now married:
0.0% (0)Unmarried:
100.0% (16)
Marital status - Asian population 15 years and over
Males 41.9% Never married36.3% Now married0.0% Separated10.6% Widowed11.2% DivorcedFemales 0.0% Never married85.6% Now married0.0% Separated0.0% Widowed14.4% DivorcedWomen who gave birth in the past 12 months Now married:
100.0% (32)Unmarried:
0.0% (0)
Women who did not give birth in the past 12 months Now married:
70.2% (64)Unmarried:
29.8% (27)
Marital status - Other race population 15 years and over
Males 46.8% Never married53.2% Now married0.0% Separated0.0% Widowed0.0% DivorcedFemales 19.5% Never married80.5% Now married0.0% Separated0.0% Widowed0.0% DivorcedWomen who did not give birth in the past 12 months Now married:
70.9% (97)Unmarried:
29.1% (40)
Marital status - Two or more races population 15 years and over
Males 50.0% Never married33.3% Now married0.0% Separated8.3% Widowed8.3% DivorcedFemales 35.9% Never married46.5% Now married0.0% Separated0.0% Widowed17.6% DivorcedWomen who did not give birth in the past 12 months Now married:
29.6% (40)Unmarried:
70.4% (94)
Marital status - White alone, not Hispanic / Latino population 15 years and over
Males 22.1% Never married59.9% Now married2.1% Separated8.5% Widowed7.4% DivorcedFemales 19.2% Never married55.3% Now married2.7% Separated6.2% Widowed16.6% DivorcedWomen who gave birth in the past 12 months Now married:
100.0% (62)Unmarried:
0.0% (0)
Women who did not give birth in the past 12 months Now married:
44.7% (456)Unmarried:
55.3% (564)
Marital status - Hispanic or Latino population 15 years and over
Males 63.3% Never married34.3% Now married0.0% Separated2.4% Widowed0.0% DivorcedFemales 24.9% Never married75.1% Now married0.0% Separated0.0% Widowed0.0% DivorcedWomen who did not give birth in the past 12 months Now married:
65.6% (122)Unmarried:
34.4% (64)
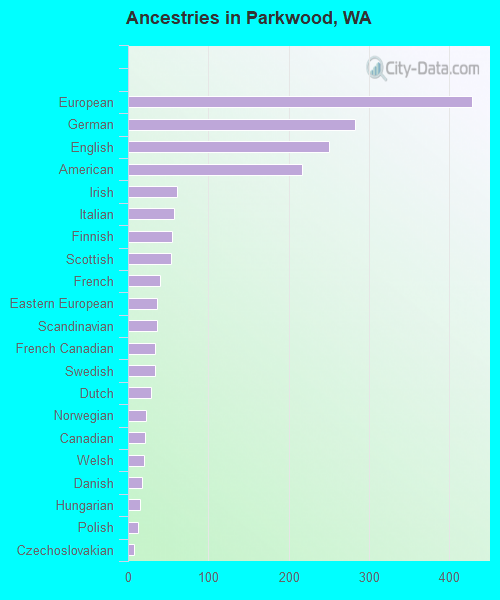
Ancestries in Parkwood
428 16.4% European283 10.9% German250 9.6% English216 8.3% American61 2.3% Irish57 2.2% Italian55 2.1% Finnish54 2.1% Scottish40 1.5% French36 1.4% Eastern European36 1.4% Scandinavian34 1.3% French Canadian33 1.3% Swedish29 1.1% Dutch23 0.9% Norwegian21 0.8% Canadian20 0.8% Welsh18 0.7% Danish15 0.6% Hungarian12 0.5% Polish7 0.3% Czechoslovakian
Children Nativity (place of birth) in Parkwood
Children under 6 years - Living with two parents Both parents native 249 100.0% NativeBoth parents foreign-born 18 31.6% Native38 68.4% Foreign-bornChildren under 6 years - Living with one parent Native parent 85 100.0% NativeChildren 6 to 17 years - Living with two parents Both parents native 657 100.0% NativeOne native, one foreign-born parent 124 100.0% NativeChildren 6 to 17 years - Living with one parent Native parent 286 100.0% NativeForeign-born parent 56 54.3% Native47 45.7% Foreign-born
Grandparents responsible for own grandchildren in Parkwood
Grandparents (30 to 59 years) Asian 10 100.0% Responsible for grandchildren
Grandparents (60 years and over)