Races in Parma Heights, Ohio (OH) Detailed Stats
Data:
Races - White alone (%)
Races - White alone (% change since 2000)
Races - Black alone (%)
Races - Black alone (% change since 2000)
Races - American Indian alone (%)
Races - American Indian alone (% change since 2000)
Races - Asian alone (%)
Races - Asian alone (% change since 2000)
Races - Hispanic (%)
Races - Hispanic (% change since 2000)
Races - Native Hawaiian and Other Pacific Islander alone (%)
Races - Native Hawaiian and Other Pacific Islander alone (% change since 2000)
Races - Two or more races(%)
Races - Two or more races(% change since 2000)
Races - Other race alone (%)
Races - Other race alone (% change since 2000)
Racial diversity
Place of birth - Born in state of residence (%)
Place of birth - Born in state of residence (%) - White
Place of birth - Born in state of residence (%) - Black or African American
Place of birth - Born in state of residence (%) - Asian
Place of birth - Born in state of residence (%) - Hispanic or Latino
Place of birth - Born in state of residence (%) - American Indian and Alaska Native
Place of birth - Born in state of residence (%) - Multirace
Place of birth - Born in state of residence (%) - Other Race
Place of birth - Born in other state (%)
Place of birth - Born in other state (%) - White
Place of birth - Born in other state (%) - Black or African American
Place of birth - Born in other state (%) - Asian
Place of birth - Born in other state (%) - Hispanic or Latino
Place of birth - Born in other state (%) - American Indian and Alaska Native
Place of birth - Born in other state (%) - Multirace
Place of birth - Born in other state (%) - Other Race
Place of birth - Native, outside of US (%)
Place of birth - Native, outside of US (%) - White
Place of birth - Native, outside of US (%) - Black or African American
Place of birth - Native, outside of US (%) - Asian
Place of birth - Native, outside of US (%) - Hispanic or Latino
Place of birth - Native, outside of US (%) - American Indian and Alaska Native
Place of birth - Native, outside of US (%) - Multirace
Place of birth - Native, outside of US (%) - Other Race
Place of birth - Foreign born (%)
Place of birth - Foreign born (%) - White
Place of birth - Foreign born (%) - Black or African American
Place of birth - Foreign born (%) - Asian
Place of birth - Foreign born (%) - Hispanic or Latino
Place of birth - Foreign born (%) - American Indian and Alaska Native
Place of birth - Foreign born (%) - Multirace
Place of birth - Foreign born (%) - Other Race
Residents speaking English at home (%)
Residents speaking English at home - Born in the United States (%)
Residents speaking English at home - Native, born elsewhere (%)
Residents speaking English at home - Foreign born (%)
Residents speaking Spanish at home (%)
Residents speaking Spanish at home - Born in the United States (%)
Residents speaking Spanish at home - Native, born elsewhere (%)
Residents speaking Spanish at home - Foreign born (%)
Residents speaking other language at home (%)
Residents speaking other language at home - Born in the United States (%)
Residents speaking other language at home - Native, born elsewhere (%)
Residents speaking other language at home - Foreign born (%)
Marital status - Never married (%)
Marital status - Now married (%)
Marital status - Separated (%)
Marital status - Widowed (%)
Marital status - Divorced (%)
Ancestries Reported - Arab (%)
Ancestries Reported - Czech (%)
Ancestries Reported - Danish (%)
Ancestries Reported - Dutch (%)
Ancestries Reported - English (%)
Ancestries Reported - French (%)
Ancestries Reported - French Canadian (%)
Ancestries Reported - German (%)
Ancestries Reported - Greek (%)
Ancestries Reported - Hungarian (%)
Ancestries Reported - Irish (%)
Ancestries Reported - Italian (%)
Ancestries Reported - Lithuanian (%)
Ancestries Reported - Norwegian (%)
Ancestries Reported - Polish (%)
Ancestries Reported - Portuguese (%)
Ancestries Reported - Russian (%)
Ancestries Reported - Scotch-Irish (%)
Ancestries Reported - Scottish (%)
Ancestries Reported - Slovak (%)
Ancestries Reported - Subsaharan African (%)
Ancestries Reported - Swedish (%)
Ancestries Reported - Swiss (%)
Ancestries Reported - Ukrainian (%)
Ancestries Reported - United States (%)
Ancestries Reported - Welsh (%)
Ancestries Reported - West Indian (%)
Ancestries Reported - Other (%)
Geographical mobility - Same house 1 year ago (%)
Geographical mobility - Same house 1 year ago (%) - White
Geographical mobility - Same house 1 year ago (%) - Black or African American
Geographical mobility - Same house 1 year ago (%) - Asian
Geographical mobility - Same house 1 year ago (%) - Hispanic or Latino
Geographical mobility - Same house 1 year ago (%) - American Indian and Alaska Native
Geographical mobility - Same house 1 year ago (%) - Multirace
Geographical mobility - Same house 1 year ago (%) - Other Race
Geographical mobility - Moved within same county (%)
Geographical mobility - Moved within same county (%) - White
Geographical mobility - Moved within same county (%) - Black or African American
Geographical mobility - Moved within same county (%) - Asian
Geographical mobility - Moved within same county (%) - Hispanic or Latino
Geographical mobility - Moved within same county (%) - American Indian and Alaska Native
Geographical mobility - Moved within same county (%) - Multirace
Geographical mobility - Moved within same county (%) - Other Race
Geographical mobility - Moved from different county within same state (%)
Geographical mobility - Moved from different county within same state (%) - White
Geographical mobility - Moved from different county within same state (%) - Black or African American
Geographical mobility - Moved from different county within same state (%) - Asian
Geographical mobility - Moved from different county within same state (%) - Hispanic or Latino
Geographical mobility - Moved from different county within same state (%) - American Indian and Alaska Native
Geographical mobility - Moved from different county within same state (%) - Multirace
Geographical mobility - Moved from different county within same state (%) - Other Race
Geographical mobility - Moved from different state (%)
Geographical mobility - Moved from different state (%) - White
Geographical mobility - Moved from different state (%) - Black or African American
Geographical mobility - Moved from different state (%) - Asian
Geographical mobility - Moved from different state (%) - Hispanic or Latino
Geographical mobility - Moved from different state (%) - American Indian and Alaska Native
Geographical mobility - Moved from different state (%) - Multirace
Geographical mobility - Moved from different state (%) - Other Race
Geographical mobility - Moved from abroad (%)
Geographical mobility - Moved from abroad (%) - White
Geographical mobility - Moved from abroad (%) - Black or African American
Geographical mobility - Moved from abroad (%) - Asian
Geographical mobility - Moved from abroad (%) - Hispanic or Latino
Geographical mobility - Moved from abroad (%) - American Indian and Alaska Native
Geographical mobility - Moved from abroad (%) - Multirace
Geographical mobility - Moved from abroad (%) - Other Race
Place of birth for the foreign-born population - Ireland (%)
Place of birth for the foreign-born population - Denmark (%)
Place of birth for the foreign-born population - Norway (%)
Place of birth for the foreign-born population - Sweden (%)
Place of birth for the foreign-born population - United Kingdom (%)
Place of birth for the foreign-born population - England (%)
Place of birth for the foreign-born population - Scotland (%)
Place of birth for the foreign-born population - Other Northern Europe (%)
Place of birth for the foreign-born population - Austria (%)
Place of birth for the foreign-born population - Belgium (%)
Place of birth for the foreign-born population - France (%)
Place of birth for the foreign-born population - Germany (%)
Place of birth for the foreign-born population - Netherlands (%)
Place of birth for the foreign-born population - Switzerland (%)
Place of birth for the foreign-born population - Other Western Europe (%)
Place of birth for the foreign-born population - Greece (%)
Place of birth for the foreign-born population - Italy (%)
Place of birth for the foreign-born population - Portugal (%)
Place of birth for the foreign-born population - Spain (%)
Place of birth for the foreign-born population - Other Southern Europe (%)
Place of birth for the foreign-born population - Albania (%)
Place of birth for the foreign-born population - Belarus (%)
Place of birth for the foreign-born population - Bosnia and Herzegovina (%)
Place of birth for the foreign-born population - Bulgaria (%)
Place of birth for the foreign-born population - Croatia (%)
Place of birth for the foreign-born population - Czechoslovakia (%)
Place of birth for the foreign-born population - Hungary (%)
Place of birth for the foreign-born population - Latvia (%)
Place of birth for the foreign-born population - Lithuania (%)
Place of birth for the foreign-born population - North Macedonia (Macedonia) (%)
Place of birth for the foreign-born population - Moldova (%)
Place of birth for the foreign-born population - Poland (%)
Place of birth for the foreign-born population - Romania (%)
Place of birth for the foreign-born population - Russia (%)
Place of birth for the foreign-born population - Serbia (%)
Place of birth for the foreign-born population - Ukraine (%)
Place of birth for the foreign-born population - Other Eastern Europe (%)
Place of birth for the foreign-born population - China (%)
Place of birth for the foreign-born population - Hong Kong (%)
Place of birth for the foreign-born population - Taiwan (%)
Place of birth for the foreign-born population - Japan (%)
Place of birth for the foreign-born population - Korea (%)
Place of birth for the foreign-born population - Other Eastern Asia (%)
Place of birth for the foreign-born population - Afghanistan (%)
Place of birth for the foreign-born population - Bangladesh (%)
Place of birth for the foreign-born population - India (%)
Place of birth for the foreign-born population - Iran (%)
Place of birth for the foreign-born population - Kazakhstan (%)
Place of birth for the foreign-born population - Nepal (%)
Place of birth for the foreign-born population - Pakistan (%)
Place of birth for the foreign-born population - Sri Lanka (%)
Place of birth for the foreign-born population - Uzbekistan (%)
Place of birth for the foreign-born population - Other South Central Asia (%)
Place of birth for the foreign-born population - Burma (%)
Place of birth for the foreign-born population - Cambodia (%)
Place of birth for the foreign-born population - Indonesia (%)
Place of birth for the foreign-born population - Laos (%)
Place of birth for the foreign-born population - Malaysia (%)
Place of birth for the foreign-born population - Philippines (%)
Place of birth for the foreign-born population - Singapore (%)
Place of birth for the foreign-born population - Thailand (%)
Place of birth for the foreign-born population - Vietnam (%)
Place of birth for the foreign-born population - Other South Eastern Asia (%)
Place of birth for the foreign-born population - Armenia (%)
Place of birth for the foreign-born population - Iraq (%)
Place of birth for the foreign-born population - Israel (%)
Place of birth for the foreign-born population - Jordan (%)
Place of birth for the foreign-born population - Kuwait (%)
Place of birth for the foreign-born population - Lebanon (%)
Place of birth for the foreign-born population - Saudi Arabia (%)
Place of birth for the foreign-born population - Syria (%)
Place of birth for the foreign-born population - Turkey (%)
Place of birth for the foreign-born population - Yemen (%)
Place of birth for the foreign-born population - Other Western Asia (%)
Place of birth for the foreign-born population - Eritrea (%)
Place of birth for the foreign-born population - Ethiopia (%)
Place of birth for the foreign-born population - Kenya (%)
Place of birth for the foreign-born population - Somalia (%)
Place of birth for the foreign-born population - Uganda (%)
Place of birth for the foreign-born population - Zimbabwe (%)
Place of birth for the foreign-born population - Other Eastern Africa (%)
Place of birth for the foreign-born population - Cameroon (%)
Place of birth for the foreign-born population - Congo (%)
Place of birth for the foreign-born population - Democratic Republic of Congo (Zaire) (%)
Place of birth for the foreign-born population - Other Middle Africa (%)
Place of birth for the foreign-born population - Egypt (%)
Place of birth for the foreign-born population - Morocco (%)
Place of birth for the foreign-born population - Sudan (%)
Place of birth for the foreign-born population - Other Northern Africa (%)
Place of birth for the foreign-born population - South Africa (%)
Place of birth for the foreign-born population - Other Southern Africa (%)
Place of birth for the foreign-born population - Cabo Verde (%)
Place of birth for the foreign-born population - Ghana (%)
Place of birth for the foreign-born population - Liberia (%)
Place of birth for the foreign-born population - Nigeria (%)
Place of birth for the foreign-born population - Senegal (%)
Place of birth for the foreign-born population - Sierra Leone (%)
Place of birth for the foreign-born population - Other Western Africa (%)
Place of birth for the foreign-born population - Australia (%)
Place of birth for the foreign-born population - New Zealand (%)
Place of birth for the foreign-born population - Fiji (%)
Place of birth for the foreign-born population - Micronesia (%)
Place of birth for the foreign-born population - Bahamas (%)
Place of birth for the foreign-born population - Barbados (%)
Place of birth for the foreign-born population - Cuba (%)
Place of birth for the foreign-born population - Dominica (%)
Place of birth for the foreign-born population - Dominican Republic (%)
Place of birth for the foreign-born population - Grenada (%)
Place of birth for the foreign-born population - Haiti (%)
Place of birth for the foreign-born population - Jamaica (%)
Place of birth for the foreign-born population - St. Vincent and the Grenadines (%)
Place of birth for the foreign-born population - Trinidad and Tobago (%)
Place of birth for the foreign-born population - West Indies (%)
Place of birth for the foreign-born population - Other Caribbean (%)
Place of birth for the foreign-born population - Belize (%)
Place of birth for the foreign-born population - Costa Rica (%)
Place of birth for the foreign-born population - El Salvador (%)
Place of birth for the foreign-born population - Guatemala (%)
Place of birth for the foreign-born population - Honduras (%)
Place of birth for the foreign-born population - Mexico (%)
Place of birth for the foreign-born population - Nicaragua (%)
Place of birth for the foreign-born population - Panama (%)
Place of birth for the foreign-born population - Other Central America (%)
Place of birth for the foreign-born population - Argentina (%)
Place of birth for the foreign-born population - Bolivia (%)
Place of birth for the foreign-born population - Brazil (%)
Place of birth for the foreign-born population - Chile (%)
Place of birth for the foreign-born population - Colombia (%)
Place of birth for the foreign-born population - Ecuador (%)
Place of birth for the foreign-born population - Guyana (%)
Place of birth for the foreign-born population - Peru (%)
Place of birth for the foreign-born population - Uruguay (%)
Place of birth for the foreign-born population - Venezuela (%)
Place of birth for the foreign-born population - Other South America (%)
Place of birth for the foreign-born population - Canada (%)
Place of birth for the foreign-born population - Other Northern America (%)
Place of birth for the foreign-born population - Other (%)
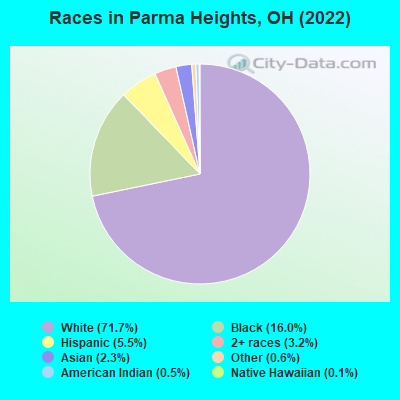
According to 2022 data, the most numerous races in Parma Heights, OH are White alone (14,593 residents), Black alone (3,250 residents), and Two or more races (645 residents). 84.2% of Parma Heights residents speak English at home. 9.6% of Parma Heights, OH residents are foreign-born (5.1% born in Europe, 2.8% born in Asia, 1.1% born in Africa), which is 58.3% greater than the foreign-born rate of 4.0% across the entire state of Ohio.
Race distribution in Parma Heights
2000 2022
9,538,111 84.0% White alone 1,290,662 11.4% Black alone 217,123 1.9% Hispanic 137,770 1.2% Two or more races 131,670 1.2% Asian alone 21,985 0.2% American Indian alone 13,483 0.1% Other race alone 2,336 0.02% Native Hawaiian and Other
8,948,793 76.1% White alone 1,401,403 11.9% Black alone 529,291 4.5% Two or more races 517,232 4.4% Hispanic 293,387 2.5% Asian alone 52,805 0.4% Other race alone 9,785 0.08% American Indian alone 3,362 0.03% Native Hawaiian and Other
Income and house value in Parma Heights Median household income in 2022 $61,217 White non-Hispanic householders$53,120 Black householders$31,228 Asian householders$75,170 Some other race householders$36,483 Two or more races householders$57,873 Hispanic or Latino race householdersMedian 2022 house value $166,214 White Non-Hispanic householders$129,664 Black or African American householders $217,558 Asian householders$178,977 Some other race householders$205,810 Two or more races householders$185,504 Hispanic or Latino householders
Median age by race in Parma Heights
46.0 Median age for White residents45.5 48.1 26.5 Median age for Black or African American residents19.9 29.7 -545,601,290.8 Median age for American Indian / Alaska Native residents-734,374,999.3 -499,999,999.5 40.9 Median age for Asian residents50.9 40.2 -706,093,189.3 Median age for Native Hawaiian / Pacific Islander residents-750,242,953.6 -805,394,989.6 25.1 Median age for Other race residents21.6 26.5 22.6 Median age for Two or more races residents22.6 29.0 46.7 Median age for White alone residents45.8 48.8 32.7 Median age for Hispanic or Latino residents32.0 31.1
Owner/renter occupied households by race in Parma Heights
House owners and renters - White residents 5,184 68.9% Owner occupied2,341 31.1% Renter occupiedHouse owners and renters - Black or African American residents 98 8.7% Owner occupied1,022 91.3% Renter occupiedHouse owners and renters - American Indian / Alaska Native residents 6 6.0% Owner occupied88 94.0% Renter occupiedHouse owners and renters - Asian residents 35 19.8% Owner occupied141 80.2% Renter occupiedHouse owners and renters - Other race residents 41 29.0% Owner occupied101 71.0% Renter occupiedHouse owners and renters - Two or more races residents 41 28.4% Owner occupied104 71.6% Renter occupiedHouse owners and renters - White alone residents 5,072 69.4% Owner occupied2,236 30.6% Renter occupiedHouse owners and renters - Hispanic or Latino residents 194 43.0% Owner occupied258 57.0% Renter occupied
Language usage in Parma Heights
English speakers - Total 84.2% of residents of Parma Heights speak English at home.
4.4% of residents speak Spanish at home 670 78.4% Speak English very well185 21.6% Speak English less than very well11.2% of residents speak other language at home 1,432 66.4% Speak English very well725 33.6% Speak English less than very well
English speakers - Born in the United States 89.1% of residents of Parma Heights speak English at home.
5.1% of residents speak Spanish at home 100 73.5% Speak English very well36 26.5% Speak English less than very well5.7% of residents speak other language at home 151 100.0% Speak English very well
English speakers - Native, born elsewhere 14.0% of residents of Parma Heights speak English at home.
68.7% of residents speak Spanish at home 128 55.7% Speak English very well102 44.3% Speak English less than very well11.0% of residents speak other language at home 37 100.0% Speak English very well
English speakers - Foreign-born 18.8% of residents of Parma Heights speak English at home.
1.0% of residents speak Spanish at home 3 16.7% Speak English very well15 83.3% Speak English less than very well78.5% of residents speak other language at home 821 55.7% Speak English very well653 44.3% Speak English less than very well
White (Caucasian) - Speak only English Native:
93.2% (12,603)Foreign-born:
17.0% (189)
White (Caucasian) - Speak another language Native:
6.3% (849)Foreign-born:
82.8% (925)
Black or African American - Speak only English Native:
89.2% (2,356)Foreign-born:
1.5% (2)
Black or African American - Speak another language Native:
7.7% (203)Foreign-born:
100.0% (152)
Asian - Speak only English Native:
66.5% (50)Foreign-born:
32.6% (121)
Asian - Speak another language Native:
31.2% (23)Foreign-born:
67.7% (251)
Two or more races - Speak only English Native:
94.4% (476)Foreign-born:
36.2% (81)
Two or more races - Speak another language Native:
2.2% (11)Foreign-born:
62.5% (141)
White alone - Speak only English Native:
95.1% (12,360)Foreign-born:
16.7% (192)
White alone - Speak another language Native:
4.9% (641)Foreign-born:
83.4% (962)
Hispanic or Latino - Speak another language Native:
56.2% (567)Foreign-born:
100.0% (20)
Foreign-born residents in Parma Heights 1,953 residents are foreign born (5.1% Europe , 2.8% Asia , 1.1% Africa ).
Marital status for residents in Parma Heights Marital status - White (Caucasian) population 15 years and over
Males 35.8% Never married48.5% Now married1.2% Separated4.2% Widowed10.3% DivorcedFemales 30.0% Never married42.3% Now married1.3% Separated13.2% Widowed13.3% DivorcedWomen who gave birth in the past 12 months Now married:
100.0% (42)Unmarried:
0.0% (0)
Women who did not give birth in the past 12 months Now married:
42.5% (1,326)Unmarried:
57.5% (1,796)
Marital status - Black or African American population 15 years and over
Males 60.8% Never married30.4% Now married0.3% Separated0.0% Widowed8.5% DivorcedFemales 62.6% Never married29.8% Now married2.9% Separated2.8% Widowed1.9% DivorcedWomen who gave birth in the past 12 months Now married:
100.0% (13)Unmarried:
0.0% (0)
Women who did not give birth in the past 12 months Now married:
30.1% (307)Unmarried:
69.9% (711)
Marital status - Asian population 15 years and over
Males 13.4% Never married86.6% Now married0.0% Separated0.0% Widowed0.0% DivorcedFemales 26.9% Never married47.7% Now married0.0% Separated24.6% Widowed0.8% DivorcedWomen who gave birth in the past 12 months Now married:
100.0% (11)Unmarried:
0.0% (0)
Women who did not give birth in the past 12 months Now married:
58.2% (101)Unmarried:
41.8% (73)
Marital status - Other race population 15 years and over
Males 91.4% Never married8.6% Now married0.0% Separated0.0% Widowed0.0% DivorcedFemales 64.7% Never married35.3% Now married0.0% Separated0.0% Widowed0.0% DivorcedWomen who did not give birth in the past 12 months Now married:
0.0% (0)Unmarried:
100.0% (50)
Marital status - Two or more races population 15 years and over
Males 56.5% Never married40.6% Now married0.4% Separated0.0% Widowed2.6% DivorcedFemales 45.3% Never married44.8% Now married0.0% Separated3.8% Widowed6.1% DivorcedWomen who gave birth in the past 12 months Now married:
91.4% (62)Unmarried:
8.6% (6)
Women who did not give birth in the past 12 months Now married:
21.3% (19)Unmarried:
78.7% (69)
Marital status - White alone, not Hispanic / Latino population 15 years and over
Males 35.4% Never married48.9% Now married1.3% Separated4.4% Widowed10.0% DivorcedFemales 29.4% Never married42.6% Now married0.7% Separated13.5% Widowed13.8% DivorcedWomen who gave birth in the past 12 months Now married:
100.0% (43)Unmarried:
0.0% (0)
Women who did not give birth in the past 12 months Now married:
42.2% (1,294)Unmarried:
57.8% (1,770)
Marital status - Hispanic or Latino population 15 years and over
Males 51.3% Never married36.7% Now married0.0% Separated0.0% Widowed12.1% DivorcedFemales 50.8% Never married31.8% Now married11.3% Separated5.5% Widowed0.6% DivorcedWomen who did not give birth in the past 12 months Now married:
34.5% (74)Unmarried:
65.5% (141)
Ancestries in Parma Heights
871 9.0% German672 7.0% Polish577 6.0% Italian434 4.5% American427 4.4% Irish347 3.6% Ukrainian246 2.5% Albanian224 2.3% Palestinian210 2.2% Hungarian160 1.7% African149 1.5% Greek143 1.5% English135 1.4% Slovak107 1.1% Romanian81 0.8% Czech70 0.7% Ghanaian66 0.7% Egyptian65 0.7% Russian61 0.6% Nigerian44 0.5% Lithuanian41 0.4% Slovene39 0.4% French37 0.4% Scottish33 0.3% Austrian31 0.3% Czechoslovakian30 0.3% European28 0.3% Welsh27 0.3% British24 0.2% Slavic19 0.2% Yugoslavian18 0.2% Croatian17 0.2% Eastern European14 0.1% Lebanese12 0.1% Dutch11 0.1% Moroccan10 0.1% Northern European10 0.1% Scotch-Irish5 0.05% Swedish4 0.04% Danish3 0.03% French Canadian2 0.02% Arab1 0.01% Brazilian
Geographical mobility in Parma Heights Same house 1 year ago 13,914 92.2% White (Caucasian)1,968 61.1% Black or African American122 100.0% American Indian / Alaska Native433 96.5% Asian35 100.0% Native Hawaiian / Pacific Islander226 83.8% Other race770 91.6% Two or more races13,337 91.6% White alone, not Hispanic / Latino1,007 90.3% Hispanic or LatinoMoved within same county 676 4.5% White / Caucasian1,096 34.0% Black or African American8 1.7% Asian27 10.0% Other race52 6.2% Two or more races706 4.8% White alone, not Hispanic / Latino55 4.9% Hispanic or LatinoMoved within same state 372 2.5% White / Caucasian3 0.4% Two or more races354 2.4% White alone, not Hispanic / Latino26 2.3% Hispanic or LatinoMoved from different state 100 0.7% White / Caucasian34 1.1% Black or African American2 0.4% Asian13 1.6% Two or more races106 0.7% White alone, not Hispanic / LatinoMoved from abroad 29 0.2% White38 0.3% White alone, not Hispanic / Latino
Children Nativity (place of birth) in Parma Heights
Children under 6 years - Living with two parents Both parents native 320 100.0% NativeBoth parents foreign-born 113 100.0% NativeOne native, one foreign-born parent 87 100.0% NativeChildren under 6 years - Living with one parent Native parent 691 100.0% NativeChildren 6 to 17 years - Living with two parents Both parents native 1,407 99.9% Native1 0.1% Foreign-bornBoth parents foreign-born 130 80.0% Native32 20.0% Foreign-bornOne native, one foreign-born parent 98 100.0% NativeChildren 6 to 17 years - Living with one parent Native parent 663 92.0% Native58 8.0% Foreign-bornForeign-born parent 44 100.0% Native
Grandparents responsible for own grandchildren in Parma Heights
Grandparents (30 to 59 years) White / Caucasian 12 16.4% Responsible for grandchildren61 83.6% Not responsible for grandchildrenTwo or more races 7 100.0% Not responsible for grandchildrenWhite alone, not Hispanic / Latino 13 17.2% Responsible for grandchildren61 82.8% Not responsible for grandchildrenGrandparents (60 years and over) White / Caucasian 110 78.1% Responsible for grandchildren31 21.9% Not responsible for grandchildrenTwo or more races 16 100.0% Responsible for grandchildrenWhite alone, not Hispanic / Latino 111 77.8% Responsible for grandchildren32 22.2% Not responsible for grandchildren