Races in Parma, New York (NY) Detailed Stats
Ancestries, Foreign-born residents, place of birth
2.7% of Parma, NY residents are foreign-born (1.7% born in Europe, 0.5% born in North America, 0.4% born in Asia), which is 723.4% less than the foreign-born rate of 22.0% across the entire state of New York.
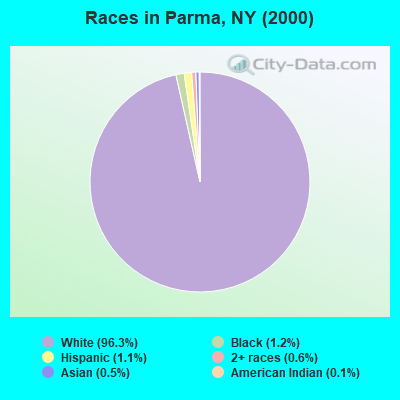
Race distribution in Parma

- 14,27296.3%White alone
- 1821.2%Black alone
- 1661.1%Hispanic
- 930.6%Two or more races
- 770.5%Asian alone
- 200.1%American Indian alone
- 80.05%Other race alone
- 40.03%Native Hawaiian and Other
Pacific Islander alone
2000
2022
-
- 11,760,98162.0%White alone
- 2,867,58315.1%Hispanic
- 2,812,62314.8%Black alone
- 1,035,9265.5%Asian alone
- 366,1161.9%Two or more races
- 75,4990.4%Other race alone
- 52,4990.3%American Indian alone
- 5,2300.03%Native Hawaiian and Other
Pacific Islander alone

-
- 10,408,93352.9%White alone
- 3,867,29919.7%Hispanic
- 2,633,84013.4%Black alone
- 1,776,2869.0%Asian alone
- 732,6703.7%Two or more races
- 216,1101.1%Other race alone
- 35,0820.2%American Indian alone
- 6,9310.04%Native Hawaiian and Other
Pacific Islander alone

Income and house value in Parma
- Median household income in 2022
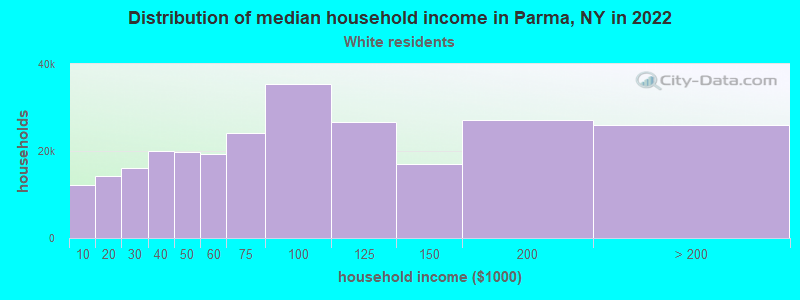
- $82,986White non-Hispanic householders
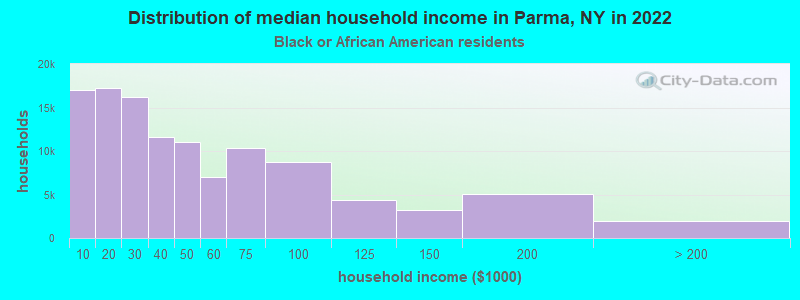
- $92,927Black householders
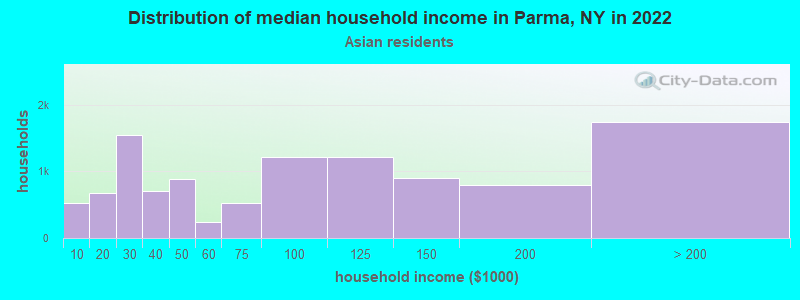
- $99,002Asian householders
- $101,279Two or more races householders
- $82,369Hispanic or Latino race householders
- Median 2022 house value
- $199,692White Non-Hispanic householders
- $331,122Black or African American householders
- $210,084Asian householders
- $173,202Two or more races householders
- $179,315Hispanic or Latino householders
Household income for White non-Hispanic householders
Household income for Black householders
Household income for Asian householders
Household income for Two or more races householders
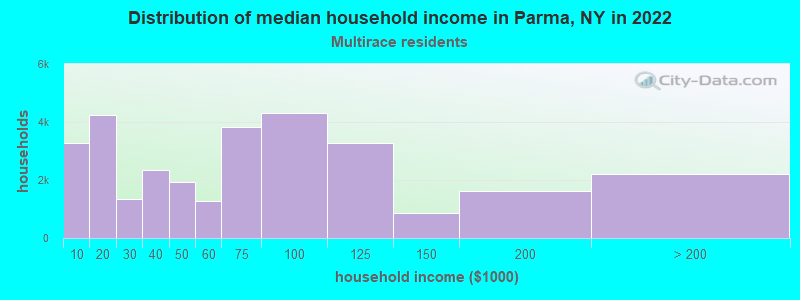
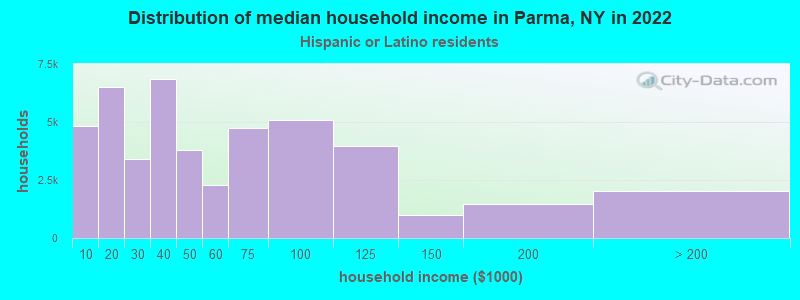
Household income for Hispanic or Latino race householders
Foreign-born residents in Parma
396 residents are foreign born (1.7% Europe, 0.5% North America, 0.4% Asia).
| This city: | 2.7% |
| New York: | 20.4% |
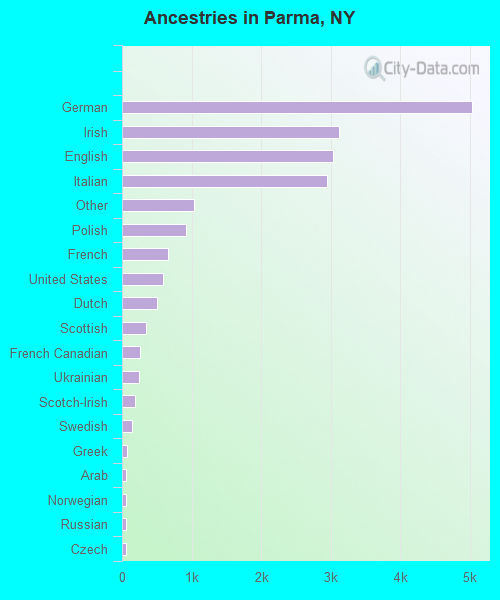
Ancestries in Parma

- 5,02525.8%German
- 3,11416.0%Irish
- 3,02715.5%English
- 2,95015.1%Italian
- 1,0335.3%Other
- 9154.7%Polish
- 6613.4%French
- 5893.0%United States
- 4962.5%Dutch
- 3511.8%Scottish
- 2541.3%French Canadian
- 2411.2%Ukrainian
- 1861.0%Scotch-Irish
- 1500.8%Swedish
- 780.4%Greek
- 570.3%Arab
- 560.3%Norwegian
- 560.3%Russian
- 540.3%Czech
- 430.2%Danish
- 410.2%Welsh
- 350.2%Portuguese
- 310.2%Lithuanian
- 290.1%Subsaharan African
- 210.1%West Indian
- 110.06%Swiss
- 30.02%Slovak
Zip codes: 14468.