Races in Parma, Ohio (OH) Detailed Stats
Data:
Races - White alone (%)
Races - White alone (% change since 2000)
Races - Black alone (%)
Races - Black alone (% change since 2000)
Races - American Indian alone (%)
Races - American Indian alone (% change since 2000)
Races - Asian alone (%)
Races - Asian alone (% change since 2000)
Races - Hispanic (%)
Races - Hispanic (% change since 2000)
Races - Native Hawaiian and Other Pacific Islander alone (%)
Races - Native Hawaiian and Other Pacific Islander alone (% change since 2000)
Races - Two or more races(%)
Races - Two or more races(% change since 2000)
Races - Other race alone (%)
Races - Other race alone (% change since 2000)
Racial diversity
Place of birth - Born in state of residence (%)
Place of birth - Born in state of residence (%) - White
Place of birth - Born in state of residence (%) - Black or African American
Place of birth - Born in state of residence (%) - Asian
Place of birth - Born in state of residence (%) - Hispanic or Latino
Place of birth - Born in state of residence (%) - American Indian and Alaska Native
Place of birth - Born in state of residence (%) - Multirace
Place of birth - Born in state of residence (%) - Other Race
Place of birth - Born in other state (%)
Place of birth - Born in other state (%) - White
Place of birth - Born in other state (%) - Black or African American
Place of birth - Born in other state (%) - Asian
Place of birth - Born in other state (%) - Hispanic or Latino
Place of birth - Born in other state (%) - American Indian and Alaska Native
Place of birth - Born in other state (%) - Multirace
Place of birth - Born in other state (%) - Other Race
Place of birth - Native, outside of US (%)
Place of birth - Native, outside of US (%) - White
Place of birth - Native, outside of US (%) - Black or African American
Place of birth - Native, outside of US (%) - Asian
Place of birth - Native, outside of US (%) - Hispanic or Latino
Place of birth - Native, outside of US (%) - American Indian and Alaska Native
Place of birth - Native, outside of US (%) - Multirace
Place of birth - Native, outside of US (%) - Other Race
Place of birth - Foreign born (%)
Place of birth - Foreign born (%) - White
Place of birth - Foreign born (%) - Black or African American
Place of birth - Foreign born (%) - Asian
Place of birth - Foreign born (%) - Hispanic or Latino
Place of birth - Foreign born (%) - American Indian and Alaska Native
Place of birth - Foreign born (%) - Multirace
Place of birth - Foreign born (%) - Other Race
Residents speaking English at home (%)
Residents speaking English at home - Born in the United States (%)
Residents speaking English at home - Native, born elsewhere (%)
Residents speaking English at home - Foreign born (%)
Residents speaking Spanish at home (%)
Residents speaking Spanish at home - Born in the United States (%)
Residents speaking Spanish at home - Native, born elsewhere (%)
Residents speaking Spanish at home - Foreign born (%)
Residents speaking other language at home (%)
Residents speaking other language at home - Born in the United States (%)
Residents speaking other language at home - Native, born elsewhere (%)
Residents speaking other language at home - Foreign born (%)
Marital status - Never married (%)
Marital status - Now married (%)
Marital status - Separated (%)
Marital status - Widowed (%)
Marital status - Divorced (%)
Ancestries Reported - Arab (%)
Ancestries Reported - Czech (%)
Ancestries Reported - Danish (%)
Ancestries Reported - Dutch (%)
Ancestries Reported - English (%)
Ancestries Reported - French (%)
Ancestries Reported - French Canadian (%)
Ancestries Reported - German (%)
Ancestries Reported - Greek (%)
Ancestries Reported - Hungarian (%)
Ancestries Reported - Irish (%)
Ancestries Reported - Italian (%)
Ancestries Reported - Lithuanian (%)
Ancestries Reported - Norwegian (%)
Ancestries Reported - Polish (%)
Ancestries Reported - Portuguese (%)
Ancestries Reported - Russian (%)
Ancestries Reported - Scotch-Irish (%)
Ancestries Reported - Scottish (%)
Ancestries Reported - Slovak (%)
Ancestries Reported - Subsaharan African (%)
Ancestries Reported - Swedish (%)
Ancestries Reported - Swiss (%)
Ancestries Reported - Ukrainian (%)
Ancestries Reported - United States (%)
Ancestries Reported - Welsh (%)
Ancestries Reported - West Indian (%)
Ancestries Reported - Other (%)
Geographical mobility - Same house 1 year ago (%)
Geographical mobility - Same house 1 year ago (%) - White
Geographical mobility - Same house 1 year ago (%) - Black or African American
Geographical mobility - Same house 1 year ago (%) - Asian
Geographical mobility - Same house 1 year ago (%) - Hispanic or Latino
Geographical mobility - Same house 1 year ago (%) - American Indian and Alaska Native
Geographical mobility - Same house 1 year ago (%) - Multirace
Geographical mobility - Same house 1 year ago (%) - Other Race
Geographical mobility - Moved within same county (%)
Geographical mobility - Moved within same county (%) - White
Geographical mobility - Moved within same county (%) - Black or African American
Geographical mobility - Moved within same county (%) - Asian
Geographical mobility - Moved within same county (%) - Hispanic or Latino
Geographical mobility - Moved within same county (%) - American Indian and Alaska Native
Geographical mobility - Moved within same county (%) - Multirace
Geographical mobility - Moved within same county (%) - Other Race
Geographical mobility - Moved from different county within same state (%)
Geographical mobility - Moved from different county within same state (%) - White
Geographical mobility - Moved from different county within same state (%) - Black or African American
Geographical mobility - Moved from different county within same state (%) - Asian
Geographical mobility - Moved from different county within same state (%) - Hispanic or Latino
Geographical mobility - Moved from different county within same state (%) - American Indian and Alaska Native
Geographical mobility - Moved from different county within same state (%) - Multirace
Geographical mobility - Moved from different county within same state (%) - Other Race
Geographical mobility - Moved from different state (%)
Geographical mobility - Moved from different state (%) - White
Geographical mobility - Moved from different state (%) - Black or African American
Geographical mobility - Moved from different state (%) - Asian
Geographical mobility - Moved from different state (%) - Hispanic or Latino
Geographical mobility - Moved from different state (%) - American Indian and Alaska Native
Geographical mobility - Moved from different state (%) - Multirace
Geographical mobility - Moved from different state (%) - Other Race
Geographical mobility - Moved from abroad (%)
Geographical mobility - Moved from abroad (%) - White
Geographical mobility - Moved from abroad (%) - Black or African American
Geographical mobility - Moved from abroad (%) - Asian
Geographical mobility - Moved from abroad (%) - Hispanic or Latino
Geographical mobility - Moved from abroad (%) - American Indian and Alaska Native
Geographical mobility - Moved from abroad (%) - Multirace
Geographical mobility - Moved from abroad (%) - Other Race
Place of birth for the foreign-born population - Ireland (%)
Place of birth for the foreign-born population - Denmark (%)
Place of birth for the foreign-born population - Norway (%)
Place of birth for the foreign-born population - Sweden (%)
Place of birth for the foreign-born population - United Kingdom (%)
Place of birth for the foreign-born population - England (%)
Place of birth for the foreign-born population - Scotland (%)
Place of birth for the foreign-born population - Other Northern Europe (%)
Place of birth for the foreign-born population - Austria (%)
Place of birth for the foreign-born population - Belgium (%)
Place of birth for the foreign-born population - France (%)
Place of birth for the foreign-born population - Germany (%)
Place of birth for the foreign-born population - Netherlands (%)
Place of birth for the foreign-born population - Switzerland (%)
Place of birth for the foreign-born population - Other Western Europe (%)
Place of birth for the foreign-born population - Greece (%)
Place of birth for the foreign-born population - Italy (%)
Place of birth for the foreign-born population - Portugal (%)
Place of birth for the foreign-born population - Spain (%)
Place of birth for the foreign-born population - Other Southern Europe (%)
Place of birth for the foreign-born population - Albania (%)
Place of birth for the foreign-born population - Belarus (%)
Place of birth for the foreign-born population - Bosnia and Herzegovina (%)
Place of birth for the foreign-born population - Bulgaria (%)
Place of birth for the foreign-born population - Croatia (%)
Place of birth for the foreign-born population - Czechoslovakia (%)
Place of birth for the foreign-born population - Hungary (%)
Place of birth for the foreign-born population - Latvia (%)
Place of birth for the foreign-born population - Lithuania (%)
Place of birth for the foreign-born population - North Macedonia (Macedonia) (%)
Place of birth for the foreign-born population - Moldova (%)
Place of birth for the foreign-born population - Poland (%)
Place of birth for the foreign-born population - Romania (%)
Place of birth for the foreign-born population - Russia (%)
Place of birth for the foreign-born population - Serbia (%)
Place of birth for the foreign-born population - Ukraine (%)
Place of birth for the foreign-born population - Other Eastern Europe (%)
Place of birth for the foreign-born population - China (%)
Place of birth for the foreign-born population - Hong Kong (%)
Place of birth for the foreign-born population - Taiwan (%)
Place of birth for the foreign-born population - Japan (%)
Place of birth for the foreign-born population - Korea (%)
Place of birth for the foreign-born population - Other Eastern Asia (%)
Place of birth for the foreign-born population - Afghanistan (%)
Place of birth for the foreign-born population - Bangladesh (%)
Place of birth for the foreign-born population - India (%)
Place of birth for the foreign-born population - Iran (%)
Place of birth for the foreign-born population - Kazakhstan (%)
Place of birth for the foreign-born population - Nepal (%)
Place of birth for the foreign-born population - Pakistan (%)
Place of birth for the foreign-born population - Sri Lanka (%)
Place of birth for the foreign-born population - Uzbekistan (%)
Place of birth for the foreign-born population - Other South Central Asia (%)
Place of birth for the foreign-born population - Burma (%)
Place of birth for the foreign-born population - Cambodia (%)
Place of birth for the foreign-born population - Indonesia (%)
Place of birth for the foreign-born population - Laos (%)
Place of birth for the foreign-born population - Malaysia (%)
Place of birth for the foreign-born population - Philippines (%)
Place of birth for the foreign-born population - Singapore (%)
Place of birth for the foreign-born population - Thailand (%)
Place of birth for the foreign-born population - Vietnam (%)
Place of birth for the foreign-born population - Other South Eastern Asia (%)
Place of birth for the foreign-born population - Armenia (%)
Place of birth for the foreign-born population - Iraq (%)
Place of birth for the foreign-born population - Israel (%)
Place of birth for the foreign-born population - Jordan (%)
Place of birth for the foreign-born population - Kuwait (%)
Place of birth for the foreign-born population - Lebanon (%)
Place of birth for the foreign-born population - Saudi Arabia (%)
Place of birth for the foreign-born population - Syria (%)
Place of birth for the foreign-born population - Turkey (%)
Place of birth for the foreign-born population - Yemen (%)
Place of birth for the foreign-born population - Other Western Asia (%)
Place of birth for the foreign-born population - Eritrea (%)
Place of birth for the foreign-born population - Ethiopia (%)
Place of birth for the foreign-born population - Kenya (%)
Place of birth for the foreign-born population - Somalia (%)
Place of birth for the foreign-born population - Uganda (%)
Place of birth for the foreign-born population - Zimbabwe (%)
Place of birth for the foreign-born population - Other Eastern Africa (%)
Place of birth for the foreign-born population - Cameroon (%)
Place of birth for the foreign-born population - Congo (%)
Place of birth for the foreign-born population - Democratic Republic of Congo (Zaire) (%)
Place of birth for the foreign-born population - Other Middle Africa (%)
Place of birth for the foreign-born population - Egypt (%)
Place of birth for the foreign-born population - Morocco (%)
Place of birth for the foreign-born population - Sudan (%)
Place of birth for the foreign-born population - Other Northern Africa (%)
Place of birth for the foreign-born population - South Africa (%)
Place of birth for the foreign-born population - Other Southern Africa (%)
Place of birth for the foreign-born population - Cabo Verde (%)
Place of birth for the foreign-born population - Ghana (%)
Place of birth for the foreign-born population - Liberia (%)
Place of birth for the foreign-born population - Nigeria (%)
Place of birth for the foreign-born population - Senegal (%)
Place of birth for the foreign-born population - Sierra Leone (%)
Place of birth for the foreign-born population - Other Western Africa (%)
Place of birth for the foreign-born population - Australia (%)
Place of birth for the foreign-born population - New Zealand (%)
Place of birth for the foreign-born population - Fiji (%)
Place of birth for the foreign-born population - Micronesia (%)
Place of birth for the foreign-born population - Bahamas (%)
Place of birth for the foreign-born population - Barbados (%)
Place of birth for the foreign-born population - Cuba (%)
Place of birth for the foreign-born population - Dominica (%)
Place of birth for the foreign-born population - Dominican Republic (%)
Place of birth for the foreign-born population - Grenada (%)
Place of birth for the foreign-born population - Haiti (%)
Place of birth for the foreign-born population - Jamaica (%)
Place of birth for the foreign-born population - St. Vincent and the Grenadines (%)
Place of birth for the foreign-born population - Trinidad and Tobago (%)
Place of birth for the foreign-born population - West Indies (%)
Place of birth for the foreign-born population - Other Caribbean (%)
Place of birth for the foreign-born population - Belize (%)
Place of birth for the foreign-born population - Costa Rica (%)
Place of birth for the foreign-born population - El Salvador (%)
Place of birth for the foreign-born population - Guatemala (%)
Place of birth for the foreign-born population - Honduras (%)
Place of birth for the foreign-born population - Mexico (%)
Place of birth for the foreign-born population - Nicaragua (%)
Place of birth for the foreign-born population - Panama (%)
Place of birth for the foreign-born population - Other Central America (%)
Place of birth for the foreign-born population - Argentina (%)
Place of birth for the foreign-born population - Bolivia (%)
Place of birth for the foreign-born population - Brazil (%)
Place of birth for the foreign-born population - Chile (%)
Place of birth for the foreign-born population - Colombia (%)
Place of birth for the foreign-born population - Ecuador (%)
Place of birth for the foreign-born population - Guyana (%)
Place of birth for the foreign-born population - Peru (%)
Place of birth for the foreign-born population - Uruguay (%)
Place of birth for the foreign-born population - Venezuela (%)
Place of birth for the foreign-born population - Other South America (%)
Place of birth for the foreign-born population - Canada (%)
Place of birth for the foreign-born population - Other Northern America (%)
Place of birth for the foreign-born population - Other (%)
Latest news about races in Parma, OH collected exclusively by city-data.com from local newspapers, TV, and radio stations
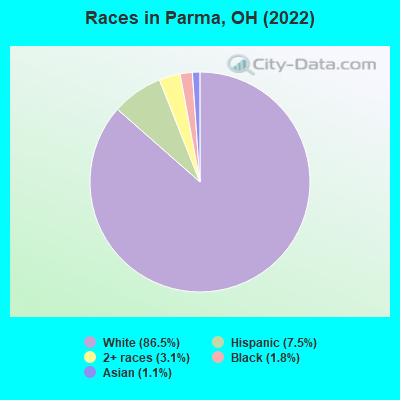
According to 2022 data, the most numerous races in Parma, OH are White alone (68,651 residents), Black alone (1,397 residents), and Two or more races (2,496 residents). 82.4% of Parma residents speak English at home. 9.9% of Parma, OH residents are foreign-born (5.5% born in Europe, 2.2% born in Asia, 1.0% born in Latin America), which is 59.8% greater than the foreign-born rate of 4.0% across the entire state of Ohio.
Race distribution in Parma
2000 2022
9,538,111 84.0% White alone 1,290,662 11.4% Black alone 217,123 1.9% Hispanic 137,770 1.2% Two or more races 131,670 1.2% Asian alone 21,985 0.2% American Indian alone 13,483 0.1% Other race alone 2,336 0.02% Native Hawaiian and Other
8,948,793 76.1% White alone 1,401,403 11.9% Black alone 529,291 4.5% Two or more races 517,232 4.4% Hispanic 293,387 2.5% Asian alone 52,805 0.4% Other race alone 9,785 0.08% American Indian alone 3,362 0.03% Native Hawaiian and Other
Income and house value in Parma Median household income in 2022 $66,197 White non-Hispanic householders$53,984 Black householders$61,461 Asian householders$66,077 Some other race householders$44,254 Two or more races householders$55,847 Hispanic or Latino race householdersMedian 2022 house value $157,322 White Non-Hispanic householders$201,339 Black or African American householders$131,911 American Indian or Alaska Native householders $176,761 Asian householders$225,638 Native Hawaiian and other Pacific Islander householders$197,867 Some other race householders$186,620 Two or more races householders$168,708 Hispanic or Latino householders
Median age by race in Parma
45.0 Median age for White residents42.8 47.8 34.9 Median age for Black or African American residents33.6 49.0 -666,666,666.0 Median age for American Indian / Alaska Native residents-666,666,666.0 -666,666,666.0 37.6 Median age for Asian residents35.8 37.7 -666,666,666.0 Median age for Native Hawaiian / Pacific Islander residents-666,666,666.0 -666,666,666.0 44.6 Median age for Other race residents44.6 57.1 25.1 Median age for Two or more races residents16.2 25.9 45.1 Median age for White alone residents42.8 47.8 26.1 Median age for Hispanic or Latino residents25.8 26.4
Owner/renter occupied households by race in Parma
House owners and renters - White residents 24,389 78.3% Owner occupied6,771 21.7% Renter occupiedHouse owners and renters - Black or African American residents 226 28.0% Owner occupied582 72.0% Renter occupiedHouse owners and renters - American Indian / Alaska Native residents 10 83.5% Owner occupied2 16.5% Renter occupiedHouse owners and renters - Asian residents 198 46.6% Owner occupied227 53.4% Renter occupiedHouse owners and renters - Other race residents 233 52.2% Owner occupied213 47.8% Renter occupiedHouse owners and renters - Two or more races residents 601 25.4% Owner occupied1,764 74.6% Renter occupiedHouse owners and renters - White alone residents 24,093 78.5% Owner occupied6,613 21.5% Renter occupiedHouse owners and renters - Hispanic or Latino residents 710 35.3% Owner occupied1,301 64.7% Renter occupied
Language usage in Parma
English speakers - Total 82.4% of residents of Parma speak English at home.
4.8% of residents speak Spanish at home 3,165 86.4% Speak English very well500 13.6% Speak English less than very well12.9% of residents speak other language at home 5,778 58.6% Speak English very well4,085 41.4% Speak English less than very well
English speakers - Born in the United States 78.6% of residents of Parma speak English at home.
5.8% of residents speak Spanish at home 573 90.4% Speak English very well61 9.6% Speak English less than very well15.5% of residents speak other language at home 1,694 100.0% Speak English very well
English speakers - Native, born elsewhere 24.6% of residents of Parma speak English at home.
63.5% of residents speak Spanish at home 763 72.5% Speak English very well289 27.5% Speak English less than very well11.8% of residents speak other language at home 57 29.1% Speak English very well139 70.9% Speak English less than very well
English speakers - Foreign-born 11.0% of residents of Parma speak English at home.
6.2% of residents speak Spanish at home 430 94.9% Speak English very well23 5.1% Speak English less than very well82.8% of residents speak other language at home 2,401 39.6% Speak English very well3,665 60.4% Speak English less than very well
White (Caucasian) - Speak only English Native:
93.2% (57,883)Foreign-born:
8.9% (525)
White (Caucasian) - Speak another language Native:
6.8% (4,212)Foreign-born:
91.1% (5,374)
Black or African American - Speak only English Native:
96.1% (2,912)Foreign-born:
21.2% (70)
Black or African American - Speak another language Native:
3.2% (96)Foreign-born:
78.5% (260)
American Indian / Alaska Native - Speak only English Native:
86.7% (29)Foreign-born:
100.0% (20)
Asian - Speak only English Native:
51.1% (158)Foreign-born:
12.5% (159)
Asian - Speak another language Native:
48.4% (149)Foreign-born:
87.5% (1,116)
Other race - Speak another language Native:
61.1% (744)Foreign-born:
100.0% (395)
Two or more races - Speak only English Native:
71.0% (3,514)Foreign-born:
7.5% (34)
Two or more races - Speak another language Native:
29.9% (1,481)Foreign-born:
93.1% (420)
White alone - Speak only English Native:
93.6% (57,314)Foreign-born:
8.9% (525)
White alone - Speak another language Native:
6.4% (3,919)Foreign-born:
91.1% (5,374)
Hispanic or Latino - Speak only English Native:
54.3% (2,485)Foreign-born:
2.9% (24)
Hispanic or Latino - Speak another language Native:
45.9% (2,101)Foreign-born:
98.5% (796)
Foreign-born residents in Parma 7,882 residents are foreign born (5.5% Europe , 2.2% Asia , 1.0% Latin America ).
Marital status for residents in Parma Marital status - White (Caucasian) population 15 years and over
Males 41.4% Never married46.7% Now married0.7% Separated2.0% Widowed9.2% DivorcedFemales 27.8% Never married43.8% Now married1.6% Separated11.7% Widowed15.2% DivorcedWomen who gave birth in the past 12 months Now married:
51.4% (107)Unmarried:
48.6% (101)
Women who did not give birth in the past 12 months Now married:
46.9% (6,929)Unmarried:
53.1% (7,851)
Marital status - Black or African American population 15 years and over
Males 56.7% Never married25.4% Now married3.7% Separated2.0% Widowed12.3% DivorcedFemales 53.5% Never married15.4% Now married16.3% Separated2.6% Widowed12.2% DivorcedWomen who gave birth in the past 12 months Now married:
82.4% (28)Unmarried:
17.6% (6)
Women who did not give birth in the past 12 months Now married:
18.7% (209)Unmarried:
81.3% (906)
Marital status - American Indian / Alaska Native population 15 years and over
Males 61.1% Never married16.7% Now married0.0% Separated0.0% Widowed22.2% DivorcedFemales 0.0% Never married100.0% Now married0.0% Separated0.0% Widowed0.0% DivorcedWomen who did not give birth in the past 12 months Now married:
100.0% (2)Unmarried:
0.0% (0)
Marital status - Asian population 15 years and over
Males 32.2% Never married60.3% Now married2.0% Separated2.6% Widowed2.9% DivorcedFemales 25.7% Never married59.4% Now married1.4% Separated3.4% Widowed10.2% DivorcedWomen who gave birth in the past 12 months Now married:
100.0% (76)Unmarried:
0.0% (0)
Women who did not give birth in the past 12 months Now married:
39.6% (150)Unmarried:
60.4% (228)
Marital status - Other race population 15 years and over
Males 23.2% Never married63.2% Now married0.0% Separated1.4% Widowed12.3% DivorcedFemales 42.6% Never married26.2% Now married5.7% Separated0.9% Widowed24.6% DivorcedWomen who gave birth in the past 12 months Now married:
100.0% (26)Unmarried:
0.0% (0)
Women who did not give birth in the past 12 months Now married:
30.8% (170)Unmarried:
69.2% (383)
Marital status - Two or more races population 15 years and over
Males 50.8% Never married41.1% Now married0.0% Separated0.0% Widowed8.1% DivorcedFemales 49.3% Never married18.0% Now married1.4% Separated10.6% Widowed20.8% DivorcedWomen who gave birth in the past 12 months Now married:
18.6% (15)Unmarried:
81.4% (67)
Women who did not give birth in the past 12 months Now married:
26.5% (423)Unmarried:
73.5% (1,169)
Marital status - White alone, not Hispanic / Latino population 15 years and over
Males 41.8% Never married47.4% Now married0.2% Separated2.0% Widowed8.6% DivorcedFemales 28.0% Never married43.5% Now married1.6% Separated11.8% Widowed15.2% DivorcedWomen who gave birth in the past 12 months Now married:
51.4% (107)Unmarried:
48.6% (101)
Women who did not give birth in the past 12 months Now married:
46.6% (6,793)Unmarried:
53.4% (7,793)
Marital status - Hispanic or Latino population 15 years and over
Males 46.6% Never married43.1% Now married2.2% Separated0.0% Widowed8.1% DivorcedFemales 39.8% Never married26.0% Now married4.2% Separated3.5% Widowed26.5% DivorcedWomen who gave birth in the past 12 months Now married:
68.9% (32)Unmarried:
31.1% (15)
Women who did not give birth in the past 12 months Now married:
25.9% (427)Unmarried:
74.1% (1,220)
Ancestries in Parma
3,331 9.8% German3,330 9.8% Polish2,459 7.2% Irish2,320 6.8% Ukrainian2,294 6.7% Italian1,965 5.8% American1,244 3.6% Slovak1,076 3.2% Serbian1,009 3.0% Hungarian915 2.7% English677 2.0% European568 1.7% Romanian373 1.1% Czech313 0.9% Lebanese286 0.8% Scottish242 0.7% Greek236 0.7% Egyptian234 0.7% Russian233 0.7% Slovene160 0.5% Scotch-Irish159 0.5% French140 0.4% Eastern European112 0.3% Jordanian106 0.3% African99 0.3% Croatian98 0.3% Somali93 0.3% Welsh91 0.3% Czechoslovakian81 0.2% Palestinian73 0.2% Albanian66 0.2% Dutch54 0.2% Nigerian52 0.2% Finnish52 0.2% Barbadian51 0.1% Guyanese51 0.1% Yugoslavian49 0.1% Jamaican47 0.1% Northern European45 0.1% Pennsylvania German42 0.1% Bulgarian41 0.1% Arab39 0.1% Austrian34 0.10% Iraqi31 0.09% Latvian29 0.09% Swedish27 0.08% Armenian27 0.08% Moroccan26 0.08% British26 0.08% Macedonian24 0.07% French Canadian21 0.06% Belizean19 0.06% Norwegian14 0.04% Ghanaian10 0.03% Lithuanian9 0.03% Carpatho Rusyn8 0.02% Celtic8 0.02% Afghan4 0.01% Canadian
Geographical mobility in Parma Same house 1 year ago 62,358 90.0% White (Caucasian)2,505 65.7% Black or African American55 100.0% American Indian / Alaska Native1,403 82.4% Asian4 100.0% Native Hawaiian / Pacific Islander1,442 81.9% Other race5,066 81.2% Two or more races62,103 90.8% White alone, not Hispanic / Latino4,736 78.3% Hispanic or LatinoMoved within same county 5,000 7.2% White / Caucasian1,055 27.7% Black or African American245 14.4% Asian207 11.7% Other race782 12.5% Two or more races4,551 6.7% White alone, not Hispanic / Latino877 14.5% Hispanic or LatinoMoved within same state 228 0.3% White / Caucasian15 0.4% Black or African American89 5.2% Asian7 0.4% Other race163 2.6% Two or more races228 0.3% White alone, not Hispanic / Latino63 1.0% Hispanic or LatinoMoved from different state 1,079 1.6% White / Caucasian138 3.6% Black or African American4 0.2% Asian8 0.4% Other race136 2.2% Two or more races921 1.3% White alone, not Hispanic / Latino402 6.7% Hispanic or LatinoMoved from abroad 629 0.9% White58 1.5% Black or African American629 0.9% White alone, not Hispanic / Latino
Children Nativity (place of birth) in Parma
Children under 6 years - Living with two parents Both parents native 1,915 100.0% NativeBoth parents foreign-born 409 91.4% Native39 8.6% Foreign-bornOne native, one foreign-born parent 355 100.0% NativeChildren under 6 years - Living with one parent Native parent 1,626 100.0% NativeForeign-born parent 162 100.0% NativeChildren 6 to 17 years - Living with two parents Both parents native 4,126 100.0% NativeBoth parents foreign-born 535 76.0% Native169 24.0% Foreign-bornOne native, one foreign-born parent 230 100.0% NativeChildren 6 to 17 years - Living with one parent Native parent 3,010 100.0% NativeForeign-born parent 431 57.5% Native318 42.5% Foreign-born
Grandparents responsible for own grandchildren in Parma
Grandparents (30 to 59 years) White / Caucasian 63 32.8% Responsible for grandchildren129 67.2% Not responsible for grandchildrenBlack or African American 5 100.0% Responsible for grandchildrenAsian 6 100.0% Not responsible for grandchildrenTwo or more races 107 94.3% Responsible for grandchildren7 5.7% Not responsible for grandchildrenWhite alone, not Hispanic / Latino 66 35.9% Responsible for grandchildren118 64.1% Not responsible for grandchildrenHispanic or Latino 48 68.6% Responsible for grandchildren22 31.4% Not responsible for grandchildrenGrandparents (60 years and over) White / Caucasian 108 27.9% Responsible for grandchildren280 72.1% Not responsible for grandchildrenBlack or African American 6 100.0% Not responsible for grandchildrenAsian 104 100.0% Not responsible for grandchildrenTwo or more races 29 47.8% Responsible for grandchildren32 52.2% Not responsible for grandchildrenWhite alone, not Hispanic / Latino 110 27.5% Responsible for grandchildren291 72.5% Not responsible for grandchildrenHispanic or Latino 101 100.0% Not responsible for grandchildren