Races in Pascagoula, Mississippi (MS) Detailed Stats
Data:
Races - White alone (%)
Races - White alone (% change since 2000)
Races - Black alone (%)
Races - Black alone (% change since 2000)
Races - American Indian alone (%)
Races - American Indian alone (% change since 2000)
Races - Asian alone (%)
Races - Asian alone (% change since 2000)
Races - Hispanic (%)
Races - Hispanic (% change since 2000)
Races - Native Hawaiian and Other Pacific Islander alone (%)
Races - Native Hawaiian and Other Pacific Islander alone (% change since 2000)
Races - Two or more races(%)
Races - Two or more races(% change since 2000)
Races - Other race alone (%)
Races - Other race alone (% change since 2000)
Racial diversity
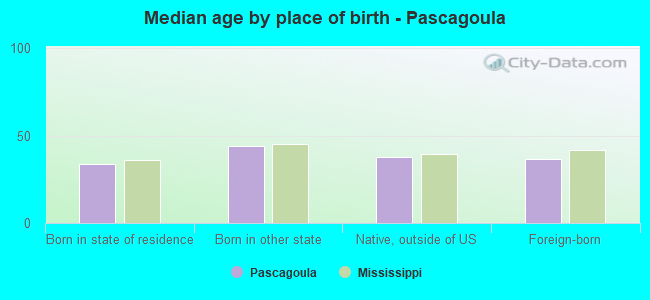
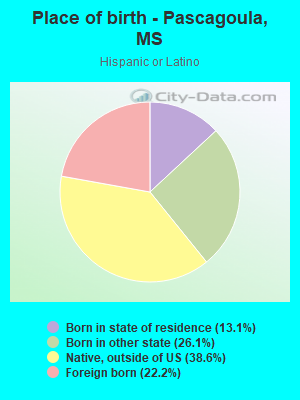
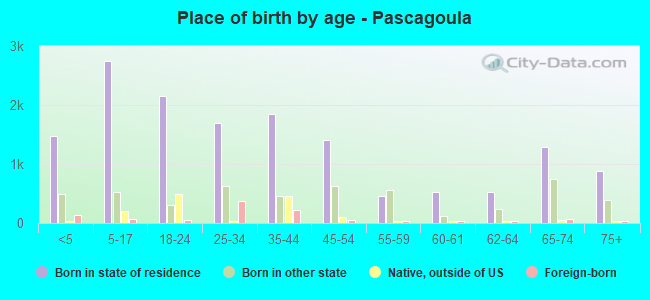
Place of birth - Born in state of residence (%)
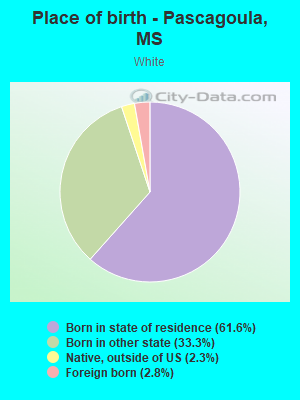
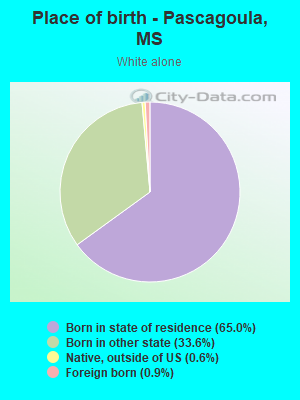
Place of birth - Born in state of residence (%) - White
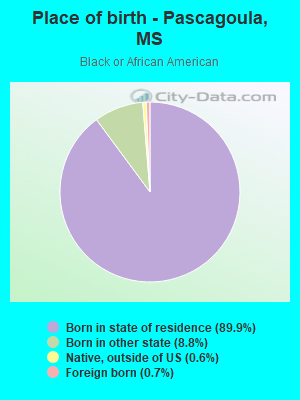
Place of birth - Born in state of residence (%) - Black or African American
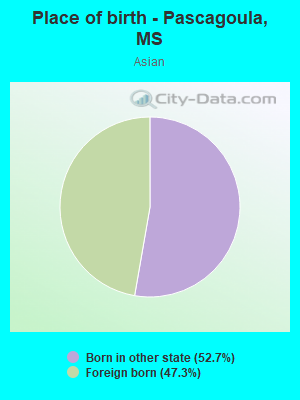
Place of birth - Born in state of residence (%) - Asian
Place of birth - Born in state of residence (%) - Hispanic or Latino
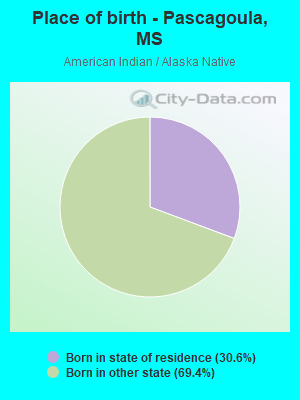
Place of birth - Born in state of residence (%) - American Indian and Alaska Native
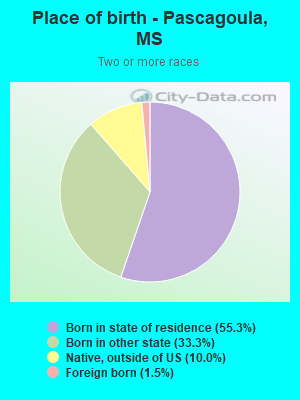
Place of birth - Born in state of residence (%) - Multirace
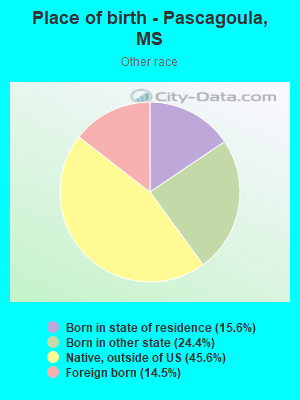
Place of birth - Born in state of residence (%) - Other Race
Place of birth - Born in other state (%)
Place of birth - Born in other state (%) - White
Place of birth - Born in other state (%) - Black or African American
Place of birth - Born in other state (%) - Asian
Place of birth - Born in other state (%) - Hispanic or Latino
Place of birth - Born in other state (%) - American Indian and Alaska Native
Place of birth - Born in other state (%) - Multirace
Place of birth - Born in other state (%) - Other Race
Place of birth - Native, outside of US (%)
Place of birth - Native, outside of US (%) - White
Place of birth - Native, outside of US (%) - Black or African American
Place of birth - Native, outside of US (%) - Asian
Place of birth - Native, outside of US (%) - Hispanic or Latino
Place of birth - Native, outside of US (%) - American Indian and Alaska Native
Place of birth - Native, outside of US (%) - Multirace
Place of birth - Native, outside of US (%) - Other Race
Place of birth - Foreign born (%)
Place of birth - Foreign born (%) - White
Place of birth - Foreign born (%) - Black or African American
Place of birth - Foreign born (%) - Asian
Place of birth - Foreign born (%) - Hispanic or Latino
Place of birth - Foreign born (%) - American Indian and Alaska Native
Place of birth - Foreign born (%) - Multirace
Place of birth - Foreign born (%) - Other Race
Residents speaking English at home (%)
Residents speaking English at home - Born in the United States (%)
Residents speaking English at home - Native, born elsewhere (%)
Residents speaking English at home - Foreign born (%)
Residents speaking Spanish at home (%)
Residents speaking Spanish at home - Born in the United States (%)
Residents speaking Spanish at home - Native, born elsewhere (%)
Residents speaking Spanish at home - Foreign born (%)
Residents speaking other language at home (%)
Residents speaking other language at home - Born in the United States (%)
Residents speaking other language at home - Native, born elsewhere (%)
Residents speaking other language at home - Foreign born (%)
Marital status - Never married (%)
Marital status - Now married (%)
Marital status - Separated (%)
Marital status - Widowed (%)
Marital status - Divorced (%)
Ancestries Reported - Arab (%)
Ancestries Reported - Czech (%)
Ancestries Reported - Danish (%)
Ancestries Reported - Dutch (%)
Ancestries Reported - English (%)
Ancestries Reported - French (%)
Ancestries Reported - French Canadian (%)
Ancestries Reported - German (%)
Ancestries Reported - Greek (%)
Ancestries Reported - Hungarian (%)
Ancestries Reported - Irish (%)
Ancestries Reported - Italian (%)
Ancestries Reported - Lithuanian (%)
Ancestries Reported - Norwegian (%)
Ancestries Reported - Polish (%)
Ancestries Reported - Portuguese (%)
Ancestries Reported - Russian (%)
Ancestries Reported - Scotch-Irish (%)
Ancestries Reported - Scottish (%)
Ancestries Reported - Slovak (%)
Ancestries Reported - Subsaharan African (%)
Ancestries Reported - Swedish (%)
Ancestries Reported - Swiss (%)
Ancestries Reported - Ukrainian (%)
Ancestries Reported - United States (%)
Ancestries Reported - Welsh (%)
Ancestries Reported - West Indian (%)
Ancestries Reported - Other (%)
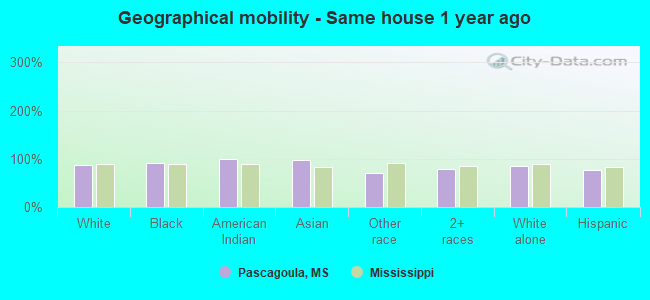
Geographical mobility - Same house 1 year ago (%)
Geographical mobility - Same house 1 year ago (%) - White
Geographical mobility - Same house 1 year ago (%) - Black or African American
Geographical mobility - Same house 1 year ago (%) - Asian
Geographical mobility - Same house 1 year ago (%) - Hispanic or Latino
Geographical mobility - Same house 1 year ago (%) - American Indian and Alaska Native
Geographical mobility - Same house 1 year ago (%) - Multirace
Geographical mobility - Same house 1 year ago (%) - Other Race
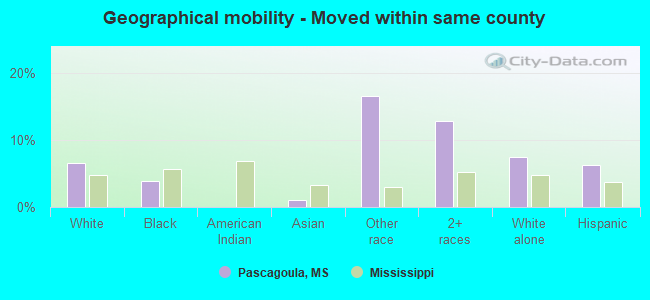
Geographical mobility - Moved within same county (%)
Geographical mobility - Moved within same county (%) - White
Geographical mobility - Moved within same county (%) - Black or African American
Geographical mobility - Moved within same county (%) - Asian
Geographical mobility - Moved within same county (%) - Hispanic or Latino
Geographical mobility - Moved within same county (%) - American Indian and Alaska Native
Geographical mobility - Moved within same county (%) - Multirace
Geographical mobility - Moved within same county (%) - Other Race
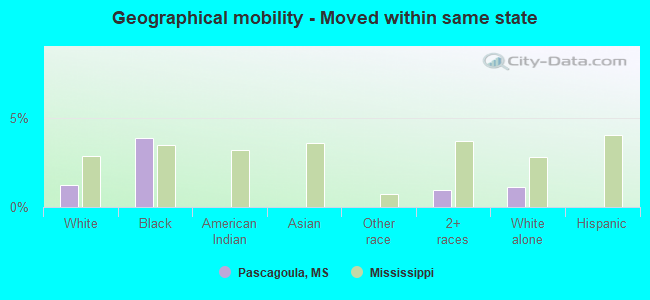
Geographical mobility - Moved from different county within same state (%)
Geographical mobility - Moved from different county within same state (%) - White
Geographical mobility - Moved from different county within same state (%) - Black or African American
Geographical mobility - Moved from different county within same state (%) - Asian
Geographical mobility - Moved from different county within same state (%) - Hispanic or Latino
Geographical mobility - Moved from different county within same state (%) - American Indian and Alaska Native
Geographical mobility - Moved from different county within same state (%) - Multirace
Geographical mobility - Moved from different county within same state (%) - Other Race
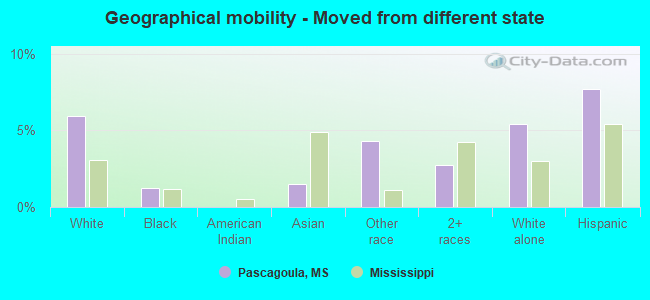
Geographical mobility - Moved from different state (%)
Geographical mobility - Moved from different state (%) - White
Geographical mobility - Moved from different state (%) - Black or African American
Geographical mobility - Moved from different state (%) - Asian
Geographical mobility - Moved from different state (%) - Hispanic or Latino
Geographical mobility - Moved from different state (%) - American Indian and Alaska Native
Geographical mobility - Moved from different state (%) - Multirace
Geographical mobility - Moved from different state (%) - Other Race
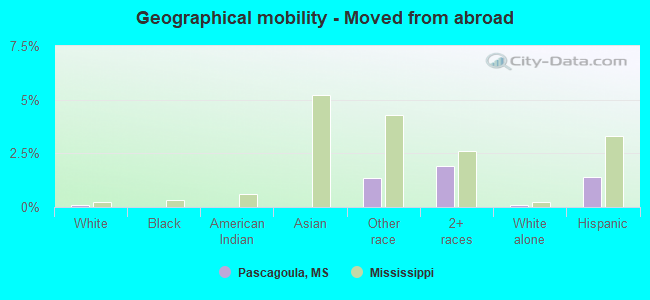
Geographical mobility - Moved from abroad (%)
Geographical mobility - Moved from abroad (%) - White
Geographical mobility - Moved from abroad (%) - Black or African American
Geographical mobility - Moved from abroad (%) - Asian
Geographical mobility - Moved from abroad (%) - Hispanic or Latino
Geographical mobility - Moved from abroad (%) - American Indian and Alaska Native
Geographical mobility - Moved from abroad (%) - Multirace
Geographical mobility - Moved from abroad (%) - Other Race
Place of birth for the foreign-born population - Ireland (%)
Place of birth for the foreign-born population - Denmark (%)
Place of birth for the foreign-born population - Norway (%)
Place of birth for the foreign-born population - Sweden (%)
Place of birth for the foreign-born population - United Kingdom (%)
Place of birth for the foreign-born population - England (%)
Place of birth for the foreign-born population - Scotland (%)
Place of birth for the foreign-born population - Other Northern Europe (%)
Place of birth for the foreign-born population - Austria (%)
Place of birth for the foreign-born population - Belgium (%)
Place of birth for the foreign-born population - France (%)
Place of birth for the foreign-born population - Germany (%)
Place of birth for the foreign-born population - Netherlands (%)
Place of birth for the foreign-born population - Switzerland (%)
Place of birth for the foreign-born population - Other Western Europe (%)
Place of birth for the foreign-born population - Greece (%)
Place of birth for the foreign-born population - Italy (%)
Place of birth for the foreign-born population - Portugal (%)
Place of birth for the foreign-born population - Spain (%)
Place of birth for the foreign-born population - Other Southern Europe (%)
Place of birth for the foreign-born population - Albania (%)
Place of birth for the foreign-born population - Belarus (%)
Place of birth for the foreign-born population - Bosnia and Herzegovina (%)
Place of birth for the foreign-born population - Bulgaria (%)
Place of birth for the foreign-born population - Croatia (%)
Place of birth for the foreign-born population - Czechoslovakia (%)
Place of birth for the foreign-born population - Hungary (%)
Place of birth for the foreign-born population - Latvia (%)
Place of birth for the foreign-born population - Lithuania (%)
Place of birth for the foreign-born population - North Macedonia (Macedonia) (%)
Place of birth for the foreign-born population - Moldova (%)
Place of birth for the foreign-born population - Poland (%)
Place of birth for the foreign-born population - Romania (%)
Place of birth for the foreign-born population - Russia (%)
Place of birth for the foreign-born population - Serbia (%)
Place of birth for the foreign-born population - Ukraine (%)
Place of birth for the foreign-born population - Other Eastern Europe (%)
Place of birth for the foreign-born population - China (%)
Place of birth for the foreign-born population - Hong Kong (%)
Place of birth for the foreign-born population - Taiwan (%)
Place of birth for the foreign-born population - Japan (%)
Place of birth for the foreign-born population - Korea (%)
Place of birth for the foreign-born population - Other Eastern Asia (%)
Place of birth for the foreign-born population - Afghanistan (%)
Place of birth for the foreign-born population - Bangladesh (%)
Place of birth for the foreign-born population - India (%)
Place of birth for the foreign-born population - Iran (%)
Place of birth for the foreign-born population - Kazakhstan (%)
Place of birth for the foreign-born population - Nepal (%)
Place of birth for the foreign-born population - Pakistan (%)
Place of birth for the foreign-born population - Sri Lanka (%)
Place of birth for the foreign-born population - Uzbekistan (%)
Place of birth for the foreign-born population - Other South Central Asia (%)
Place of birth for the foreign-born population - Burma (%)
Place of birth for the foreign-born population - Cambodia (%)
Place of birth for the foreign-born population - Indonesia (%)
Place of birth for the foreign-born population - Laos (%)
Place of birth for the foreign-born population - Malaysia (%)
Place of birth for the foreign-born population - Philippines (%)
Place of birth for the foreign-born population - Singapore (%)
Place of birth for the foreign-born population - Thailand (%)
Place of birth for the foreign-born population - Vietnam (%)
Place of birth for the foreign-born population - Other South Eastern Asia (%)
Place of birth for the foreign-born population - Armenia (%)
Place of birth for the foreign-born population - Iraq (%)
Place of birth for the foreign-born population - Israel (%)
Place of birth for the foreign-born population - Jordan (%)
Place of birth for the foreign-born population - Kuwait (%)
Place of birth for the foreign-born population - Lebanon (%)
Place of birth for the foreign-born population - Saudi Arabia (%)
Place of birth for the foreign-born population - Syria (%)
Place of birth for the foreign-born population - Turkey (%)
Place of birth for the foreign-born population - Yemen (%)
Place of birth for the foreign-born population - Other Western Asia (%)
Place of birth for the foreign-born population - Eritrea (%)
Place of birth for the foreign-born population - Ethiopia (%)
Place of birth for the foreign-born population - Kenya (%)
Place of birth for the foreign-born population - Somalia (%)
Place of birth for the foreign-born population - Uganda (%)
Place of birth for the foreign-born population - Zimbabwe (%)
Place of birth for the foreign-born population - Other Eastern Africa (%)
Place of birth for the foreign-born population - Cameroon (%)
Place of birth for the foreign-born population - Congo (%)
Place of birth for the foreign-born population - Democratic Republic of Congo (Zaire) (%)
Place of birth for the foreign-born population - Other Middle Africa (%)
Place of birth for the foreign-born population - Egypt (%)
Place of birth for the foreign-born population - Morocco (%)
Place of birth for the foreign-born population - Sudan (%)
Place of birth for the foreign-born population - Other Northern Africa (%)
Place of birth for the foreign-born population - South Africa (%)
Place of birth for the foreign-born population - Other Southern Africa (%)
Place of birth for the foreign-born population - Cabo Verde (%)
Place of birth for the foreign-born population - Ghana (%)
Place of birth for the foreign-born population - Liberia (%)
Place of birth for the foreign-born population - Nigeria (%)
Place of birth for the foreign-born population - Senegal (%)
Place of birth for the foreign-born population - Sierra Leone (%)
Place of birth for the foreign-born population - Other Western Africa (%)
Place of birth for the foreign-born population - Australia (%)
Place of birth for the foreign-born population - New Zealand (%)
Place of birth for the foreign-born population - Fiji (%)
Place of birth for the foreign-born population - Micronesia (%)
Place of birth for the foreign-born population - Bahamas (%)
Place of birth for the foreign-born population - Barbados (%)
Place of birth for the foreign-born population - Cuba (%)
Place of birth for the foreign-born population - Dominica (%)
Place of birth for the foreign-born population - Dominican Republic (%)
Place of birth for the foreign-born population - Grenada (%)
Place of birth for the foreign-born population - Haiti (%)
Place of birth for the foreign-born population - Jamaica (%)
Place of birth for the foreign-born population - St. Vincent and the Grenadines (%)
Place of birth for the foreign-born population - Trinidad and Tobago (%)
Place of birth for the foreign-born population - West Indies (%)
Place of birth for the foreign-born population - Other Caribbean (%)
Place of birth for the foreign-born population - Belize (%)
Place of birth for the foreign-born population - Costa Rica (%)
Place of birth for the foreign-born population - El Salvador (%)
Place of birth for the foreign-born population - Guatemala (%)
Place of birth for the foreign-born population - Honduras (%)
Place of birth for the foreign-born population - Mexico (%)
Place of birth for the foreign-born population - Nicaragua (%)
Place of birth for the foreign-born population - Panama (%)
Place of birth for the foreign-born population - Other Central America (%)
Place of birth for the foreign-born population - Argentina (%)
Place of birth for the foreign-born population - Bolivia (%)
Place of birth for the foreign-born population - Brazil (%)
Place of birth for the foreign-born population - Chile (%)
Place of birth for the foreign-born population - Colombia (%)
Place of birth for the foreign-born population - Ecuador (%)
Place of birth for the foreign-born population - Guyana (%)
Place of birth for the foreign-born population - Peru (%)
Place of birth for the foreign-born population - Uruguay (%)
Place of birth for the foreign-born population - Venezuela (%)
Place of birth for the foreign-born population - Other South America (%)
Place of birth for the foreign-born population - Canada (%)
Place of birth for the foreign-born population - Other Northern America (%)
Place of birth for the foreign-born population - Other (%)
Latest news about races in Pascagoula, MS collected exclusively by city-data.com from local newspapers, TV, and radio stations
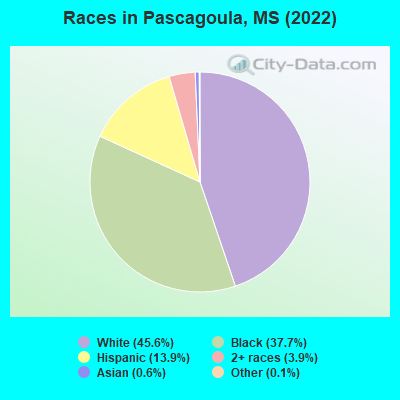
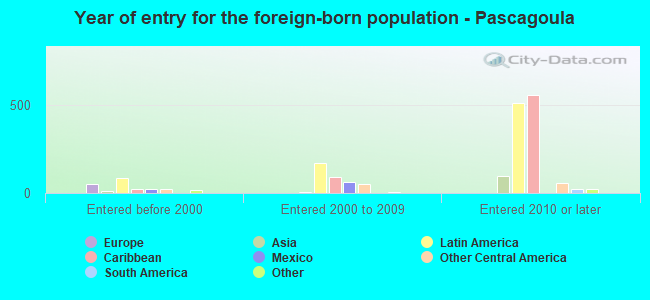
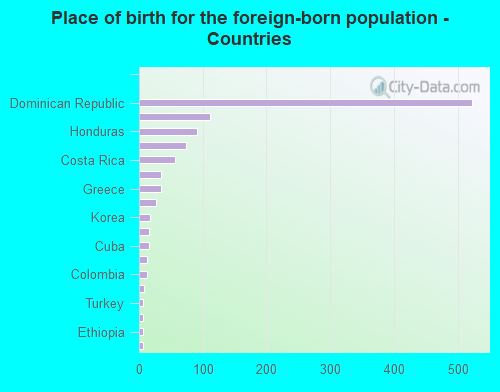
According to 2022 data, the most numerous races in Pascagoula, MS are White alone (10,085 residents), Black alone (8,327 residents), and Hispanic (3,079 residents). 86.6% of Pascagoula residents speak English at home. 4.9% of Pascagoula, MS residents are foreign-born (3.8% born in Latin America), which is 58.8% greater than the foreign-born rate of 2.0% across the entire state of Mississippi.
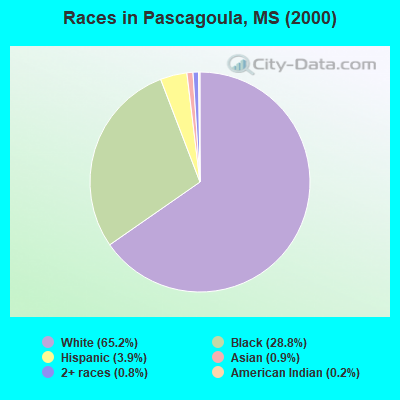
Race distribution in Pascagoula
2000 2022
1,727,908 60.7% White alone 1,028,473 36.2% Black alone 39,569 1.4% Hispanic 17,272 0.6% Two or more races 18,349 0.6% Asian alone 11,224 0.4% American Indian alone 1,294 0.05% Other race alone 569 0.02% Native Hawaiian and Other
1,625,979 55.3% White alone 1,072,962 36.5% Black alone 97,177 3.3% Hispanic 96,367 3.3% Two or more races 25,217 0.9% Asian alone 12,457 0.4% American Indian alone 9,501 0.3% Other race alone 397 0.01% Native Hawaiian and Other
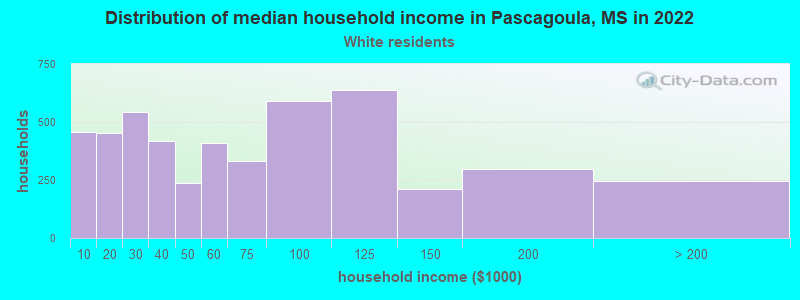
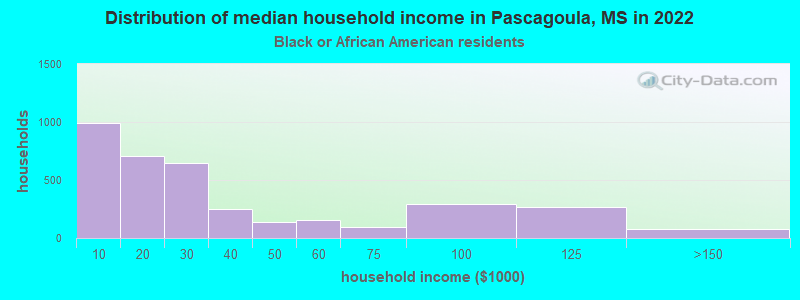
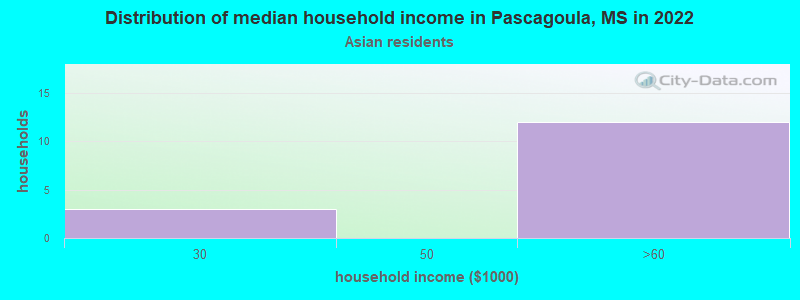
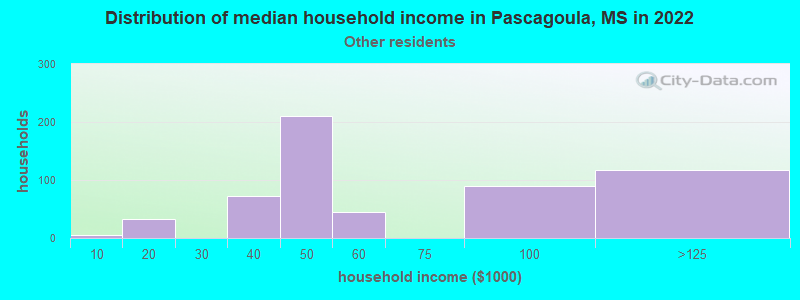
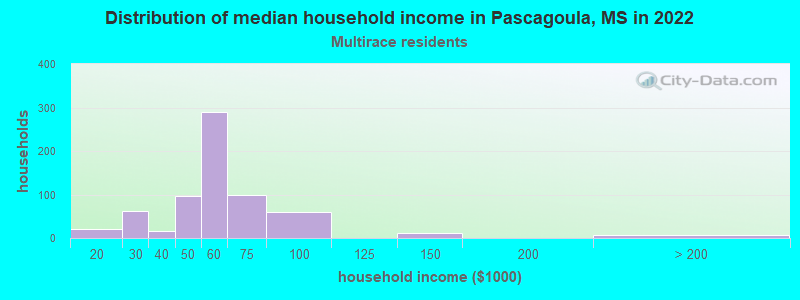
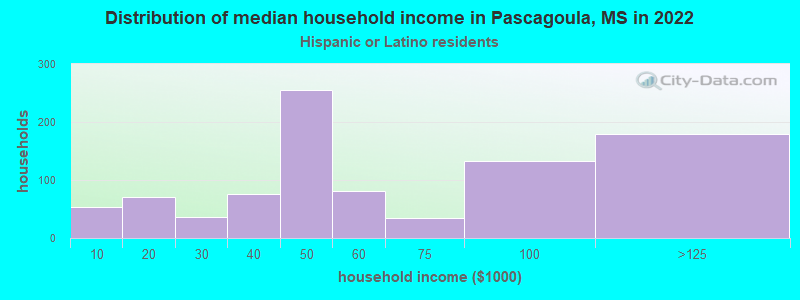
Income and house value in Pascagoula Median household income in 2022 $58,391 White non-Hispanic householders$20,838 Black householders$65,871 Some other race householders$56,335 Two or more races householders$74,818 Hispanic or Latino race householdersMedian 2022 house value $143,030 White Non-Hispanic householders$131,128 Black or African American householders$29,550 American Indian or Alaska Native householders $99,731 Asian householders$118,405 Two or more races householders$173,196 Hispanic or Latino householders
Median age by race in Pascagoula
41.1 Median age for White residents41.4 41.3 27.8 Median age for Black or African American residents23.6 31.2 39.3 Median age for American Indian / Alaska Native residents-433,333,332.9 66.8 4.2 Median age for Asian residents4.6 38.7 -666,666,666.0 Median age for Native Hawaiian / Pacific Islander residents-666,666,666.0 -666,666,666.0 35.1 Median age for Other race residents61.6 23.2 31.4 Median age for Two or more races residents25.4 36.8 45.7 Median age for White alone residents45.2 46.3 22.2 Median age for Hispanic or Latino residents22.1 23.3
Owner/renter occupied households by race in Pascagoula
House owners and renters - White residents 3,216 67.0% Owner occupied1,583 33.0% Renter occupiedHouse owners and renters - Black or African American residents 835 23.7% Owner occupied2,687 76.3% Renter occupiedHouse owners and renters - Asian residents 4 9.7% Owner occupied39 90.3% Renter occupiedHouse owners and renters - Other race residents 128 34.2% Owner occupied247 65.8% Renter occupiedHouse owners and renters - Two or more races residents 431 67.4% Owner occupied209 32.6% Renter occupiedHouse owners and renters - White alone residents 3,047 67.2% Owner occupied1,484 32.8% Renter occupiedHouse owners and renters - Hispanic or Latino residents 344 47.1% Owner occupied387 52.9% Renter occupied
Language usage in Pascagoula
English speakers - Total 86.6% of residents of Pascagoula speak English at home.
11.4% of residents speak Spanish at home 1,100 48.1% Speak English very well1,187 51.9% Speak English less than very well0.7% of residents speak other language at home 134 89.9% Speak English very well15 10.1% Speak English less than very well
English speakers - Born in the United States 89.3% of residents of Pascagoula speak English at home.
6.8% of residents speak Spanish at home 186 58.5% Speak English very well132 41.5% Speak English less than very well0.5% of residents speak other language at home 24 100.0% Speak English very well
English speakers - Native, born elsewhere 8.9% of residents of Pascagoula speak English at home.
69.7% of residents speak Spanish at home 422 51.3% Speak English very well401 48.7% Speak English less than very well2.4% of residents speak other language at home 28 100.0% Speak English very well
English speakers - Foreign-born 17.4% of residents of Pascagoula speak English at home.
90.6% of residents speak Spanish at home 136 21.7% Speak English very well490 78.3% Speak English less than very well15.6% of residents speak other language at home 92 85.2% Speak English very well16 14.8% Speak English less than very well
White (Caucasian) - Speak only English Native:
94.7% (9,098)Foreign-born:
24.4% (59)
White (Caucasian) - Speak another language Native:
5.0% (484)Foreign-born:
90.5% (219)
Black or African American - Speak only English Native:
99.0% (6,899)Foreign-born:
61.5% (38)
Black or African American - Speak another language Native:
1.0% (73)Foreign-born:
35.7% (22)
Asian - Speak only English Native:
95.7% (7)Foreign-born:
6.2% (5)
Other race - Speak another language Native:
100.0% (980)Foreign-born:
76.9% (131)
Two or more races - Speak only English Native:
69.1% (877)Foreign-born:
54.7% (15)
Two or more races - Speak another language Native:
36.1% (458)Foreign-born:
31.4% (9)
White alone - Speak only English Native:
98.4% (9,098)Foreign-born:
72.1% (62)
White alone - Speak another language Native:
2.1% (198)Foreign-born:
24.7% (21)
Hispanic or Latino - Speak another language Native:
82.1% (1,933)Foreign-born:
100.0% (624)
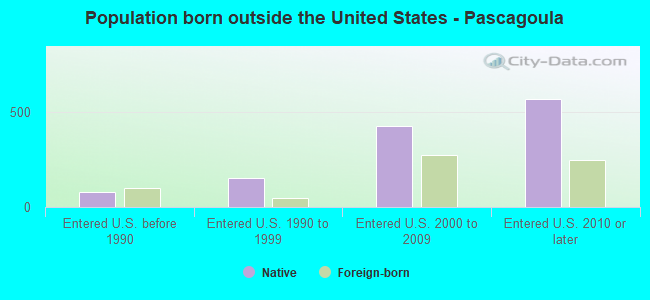
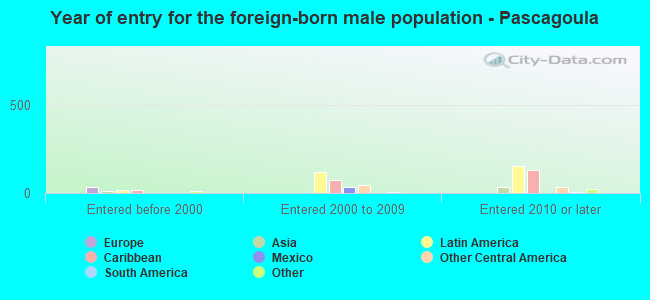
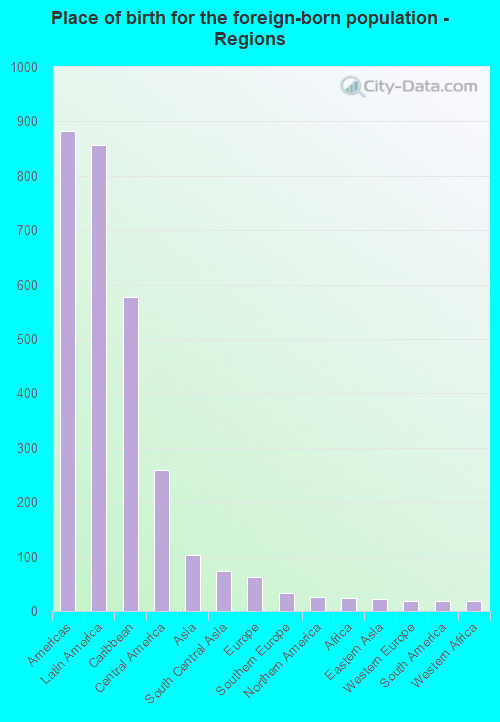
Foreign-born residents in Pascagoula 1,072 residents are foreign born (3.8% Latin America ).
This city:
4.9%Mississippi:
2.3%
Marital status for residents in Pascagoula Marital status - White (Caucasian) population 15 years and over
Males 32.1% Never married46.6% Now married1.3% Separated4.1% Widowed15.9% DivorcedFemales 24.2% Never married43.0% Now married3.1% Separated16.0% Widowed13.7% DivorcedWomen who gave birth in the past 12 months Now married:
70.1% (84)Unmarried:
29.9% (36)
Women who did not give birth in the past 12 months Now married:
47.6% (973)Unmarried:
52.4% (1,071)
Marital status - Black or African American population 15 years and over
Males 62.1% Never married23.1% Now married3.1% Separated1.5% Widowed10.2% DivorcedFemales 63.9% Never married14.8% Now married4.9% Separated5.9% Widowed10.4% DivorcedWomen who gave birth in the past 12 months Now married:
36.8% (26)Unmarried:
63.2% (45)
Women who did not give birth in the past 12 months Now married:
13.0% (335)Unmarried:
87.0% (2,240)
Marital status - American Indian / Alaska Native population 15 years and over
Males 100.0% Never married0.0% Now married0.0% Separated0.0% Widowed0.0% DivorcedFemales 0.0% Never married28.6% Now married0.0% Separated71.4% Widowed0.0% DivorcedMarital status - Asian population 15 years and over
Males 36.0% Never married64.0% Now married0.0% Separated0.0% Widowed0.0% DivorcedFemales 6.2% Never married87.5% Now married0.0% Separated0.0% Widowed6.2% DivorcedWomen who did not give birth in the past 12 months Now married:
93.3% (47)Unmarried:
6.7% (3)
Marital status - Other race population 15 years and over
Males 13.2% Never married50.3% Now married25.2% Separated11.1% Widowed0.2% DivorcedFemales 36.9% Never married57.0% Now married0.8% Separated0.0% Widowed5.3% DivorcedWomen who gave birth in the past 12 months Now married:
89.7% (50)Unmarried:
10.3% (6)
Women who did not give birth in the past 12 months Now married:
53.1% (341)Unmarried:
46.9% (301)
Marital status - Two or more races population 15 years and over
Males 29.8% Never married30.7% Now married0.0% Separated25.8% Widowed13.7% DivorcedFemales 33.9% Never married50.4% Now married0.0% Separated0.0% Widowed15.7% DivorcedWomen who gave birth in the past 12 months Now married:
100.0% (22)Unmarried:
0.0% (0)
Women who did not give birth in the past 12 months Now married:
54.7% (222)Unmarried:
45.3% (184)
Marital status - White alone, not Hispanic / Latino population 15 years and over
Males 31.1% Never married46.4% Now married1.4% Separated4.4% Widowed16.8% DivorcedFemales 23.3% Never married43.2% Now married2.8% Separated15.8% Widowed14.9% DivorcedWomen who gave birth in the past 12 months Now married:
70.1% (85)Unmarried:
29.9% (36)
Women who did not give birth in the past 12 months Now married:
46.0% (831)Unmarried:
54.0% (974)
Marital status - Hispanic or Latino population 15 years and over
Males 28.2% Never married47.9% Now married13.9% Separated6.1% Widowed3.9% DivorcedFemales 34.2% Never married52.3% Now married2.9% Separated6.5% Widowed4.2% DivorcedWomen who gave birth in the past 12 months Now married:
89.7% (46)Unmarried:
10.3% (5)
Women who did not give birth in the past 12 months Now married:
57.0% (646)Unmarried:
43.0% (487)
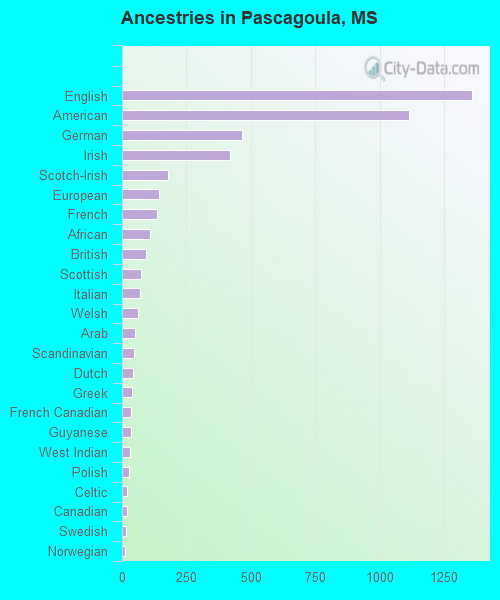
Ancestries in Pascagoula
1,357 9.1% English1,115 7.5% American465 3.1% German418 2.8% Irish178 1.2% Scotch-Irish144 1.0% European135 0.9% French109 0.7% African94 0.6% British73 0.5% Scottish69 0.5% Italian61 0.4% Welsh50 0.3% Arab48 0.3% Scandinavian43 0.3% Dutch37 0.2% Greek34 0.2% French Canadian34 0.2% Guyanese32 0.2% West Indian29 0.2% Polish19 0.1% Celtic18 0.1% Canadian16 0.1% Swedish13 0.09% Norwegian8 0.05% Pennsylvania German7 0.05% Northern European7 0.05% Jamaican6 0.04% Portuguese6 0.04% Russian3 0.02% Belizean
Geographical mobility in Pascagoula Same house 1 year ago 9,287 86.4% White (Caucasian)7,774 90.7% Black or African American9 99.4% American Indian / Alaska Native167 97.3% Asian1,289 71.6% Other race1,255 77.9% Two or more races8,607 86.0% White alone, not Hispanic / Latino2,294 77.7% Hispanic or LatinoMoved within same county 709 6.6% White / Caucasian330 3.8% Black or African American2 1.1% Asian297 16.5% Other race208 12.9% Two or more races745 7.4% White alone, not Hispanic / Latino186 6.3% Hispanic or LatinoMoved within same state 131 1.2% White / Caucasian330 3.9% Black or African American15 0.9% Two or more races114 1.1% White alone, not Hispanic / LatinoMoved from different state 635 5.9% White / Caucasian107 1.2% Black or African American3 1.5% Asian78 4.3% Other race44 2.8% Two or more races539 5.4% White alone, not Hispanic / Latino227 7.7% Hispanic or LatinoMoved from abroad 9 0.1% White25 1.4% Other race31 1.9% Two or more races11 0.1% White alone, not Hispanic / Latino41 1.4% Hispanic or Latino
Children Nativity (place of birth) in Pascagoula
Children under 6 years - Living with two parents Both parents native 620 100.0% NativeBoth parents foreign-born 67 28.2% Native172 71.8% Foreign-bornOne native, one foreign-born parent 14 100.0% NativeChildren under 6 years - Living with one parent Native parent 1,349 100.0% NativeForeign-born parent 17 100.0% NativeChildren 6 to 17 years - Living with two parents Both parents native 900 100.0% NativeBoth parents foreign-born 12 13.1% Native83 86.9% Foreign-bornOne native, one foreign-born parent 40 39.2% Native62 60.8% Foreign-bornChildren 6 to 17 years - Living with one parent Native parent 1,674 100.0% NativeForeign-born parent 182 46.3% Native211 53.7% Foreign-born
Grandparents responsible for own grandchildren in Pascagoula
Grandparents (30 to 59 years) White / Caucasian 38 75.4% Responsible for grandchildren12 24.6% Not responsible for grandchildrenBlack or African American 30 46.9% Responsible for grandchildren34 53.1% Not responsible for grandchildrenWhite alone, not Hispanic / Latino 38 63.0% Responsible for grandchildren23 37.0% Not responsible for grandchildrenGrandparents (60 years and over) White / Caucasian 149 43.1% Responsible for grandchildren197 56.9% Not responsible for grandchildrenBlack or African American 28 12.8% Responsible for grandchildren192 87.2% Not responsible for grandchildrenWhite alone, not Hispanic / Latino 149 41.8% Responsible for grandchildren207 58.2% Not responsible for grandchildren