Races in Pasco, Washington (WA) Detailed Stats
Data:
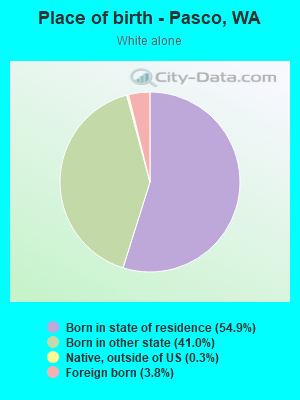
Races - White alone (%)
Races - White alone (% change since 2000)
Races - Black alone (%)
Races - Black alone (% change since 2000)
Races - American Indian alone (%)
Races - American Indian alone (% change since 2000)
Races - Asian alone (%)
Races - Asian alone (% change since 2000)
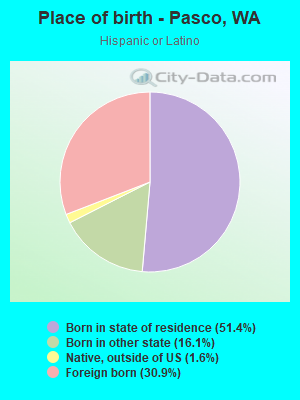
Races - Hispanic (%)
Races - Hispanic (% change since 2000)
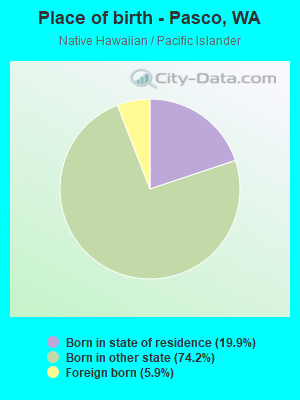
Races - Native Hawaiian and Other Pacific Islander alone (%)
Races - Native Hawaiian and Other Pacific Islander alone (% change since 2000)
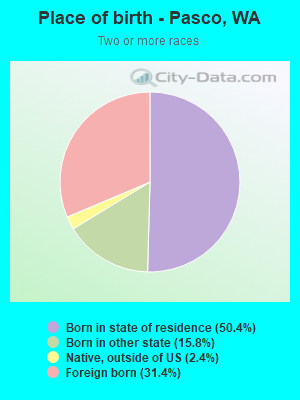
Races - Two or more races(%)
Races - Two or more races(% change since 2000)
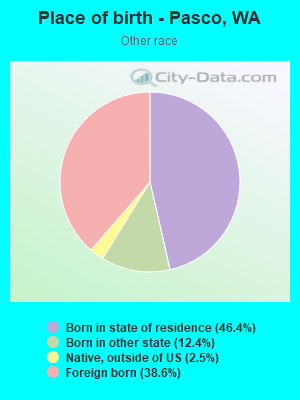
Races - Other race alone (%)
Races - Other race alone (% change since 2000)
Racial diversity
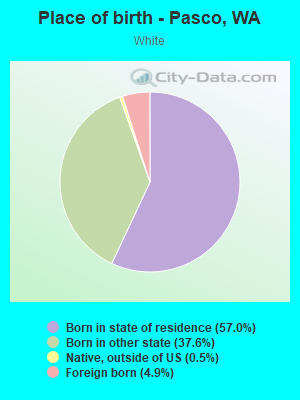
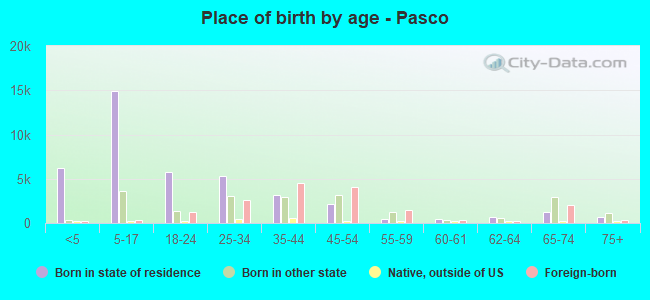
Place of birth - Born in state of residence (%)
Place of birth - Born in state of residence (%) - White
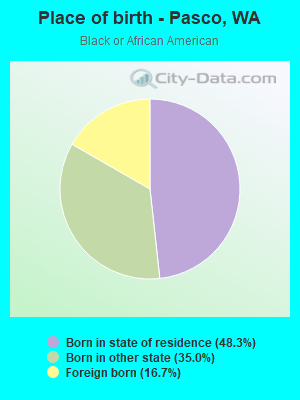
Place of birth - Born in state of residence (%) - Black or African American
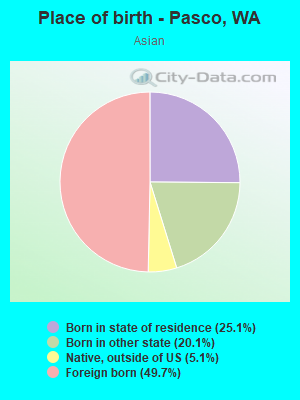
Place of birth - Born in state of residence (%) - Asian
Place of birth - Born in state of residence (%) - Hispanic or Latino
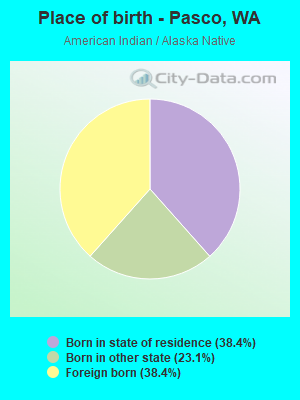
Place of birth - Born in state of residence (%) - American Indian and Alaska Native
Place of birth - Born in state of residence (%) - Multirace
Place of birth - Born in state of residence (%) - Other Race
Place of birth - Born in other state (%)
Place of birth - Born in other state (%) - White
Place of birth - Born in other state (%) - Black or African American
Place of birth - Born in other state (%) - Asian
Place of birth - Born in other state (%) - Hispanic or Latino
Place of birth - Born in other state (%) - American Indian and Alaska Native
Place of birth - Born in other state (%) - Multirace
Place of birth - Born in other state (%) - Other Race
Place of birth - Native, outside of US (%)
Place of birth - Native, outside of US (%) - White
Place of birth - Native, outside of US (%) - Black or African American
Place of birth - Native, outside of US (%) - Asian
Place of birth - Native, outside of US (%) - Hispanic or Latino
Place of birth - Native, outside of US (%) - American Indian and Alaska Native
Place of birth - Native, outside of US (%) - Multirace
Place of birth - Native, outside of US (%) - Other Race
Place of birth - Foreign born (%)
Place of birth - Foreign born (%) - White
Place of birth - Foreign born (%) - Black or African American
Place of birth - Foreign born (%) - Asian
Place of birth - Foreign born (%) - Hispanic or Latino
Place of birth - Foreign born (%) - American Indian and Alaska Native
Place of birth - Foreign born (%) - Multirace
Place of birth - Foreign born (%) - Other Race
Residents speaking English at home (%)
Residents speaking English at home - Born in the United States (%)
Residents speaking English at home - Native, born elsewhere (%)
Residents speaking English at home - Foreign born (%)
Residents speaking Spanish at home (%)
Residents speaking Spanish at home - Born in the United States (%)
Residents speaking Spanish at home - Native, born elsewhere (%)
Residents speaking Spanish at home - Foreign born (%)
Residents speaking other language at home (%)
Residents speaking other language at home - Born in the United States (%)
Residents speaking other language at home - Native, born elsewhere (%)
Residents speaking other language at home - Foreign born (%)
Marital status - Never married (%)
Marital status - Now married (%)
Marital status - Separated (%)
Marital status - Widowed (%)
Marital status - Divorced (%)
Ancestries Reported - Arab (%)
Ancestries Reported - Czech (%)
Ancestries Reported - Danish (%)
Ancestries Reported - Dutch (%)
Ancestries Reported - English (%)
Ancestries Reported - French (%)
Ancestries Reported - French Canadian (%)
Ancestries Reported - German (%)
Ancestries Reported - Greek (%)
Ancestries Reported - Hungarian (%)
Ancestries Reported - Irish (%)
Ancestries Reported - Italian (%)
Ancestries Reported - Lithuanian (%)
Ancestries Reported - Norwegian (%)
Ancestries Reported - Polish (%)
Ancestries Reported - Portuguese (%)
Ancestries Reported - Russian (%)
Ancestries Reported - Scotch-Irish (%)
Ancestries Reported - Scottish (%)
Ancestries Reported - Slovak (%)
Ancestries Reported - Subsaharan African (%)
Ancestries Reported - Swedish (%)
Ancestries Reported - Swiss (%)
Ancestries Reported - Ukrainian (%)
Ancestries Reported - United States (%)
Ancestries Reported - Welsh (%)
Ancestries Reported - West Indian (%)
Ancestries Reported - Other (%)
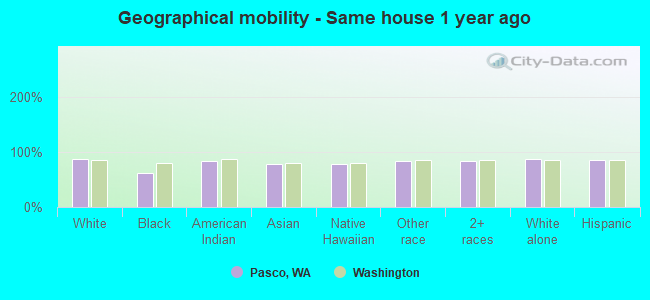
Geographical mobility - Same house 1 year ago (%)
Geographical mobility - Same house 1 year ago (%) - White
Geographical mobility - Same house 1 year ago (%) - Black or African American
Geographical mobility - Same house 1 year ago (%) - Asian
Geographical mobility - Same house 1 year ago (%) - Hispanic or Latino
Geographical mobility - Same house 1 year ago (%) - American Indian and Alaska Native
Geographical mobility - Same house 1 year ago (%) - Multirace
Geographical mobility - Same house 1 year ago (%) - Other Race
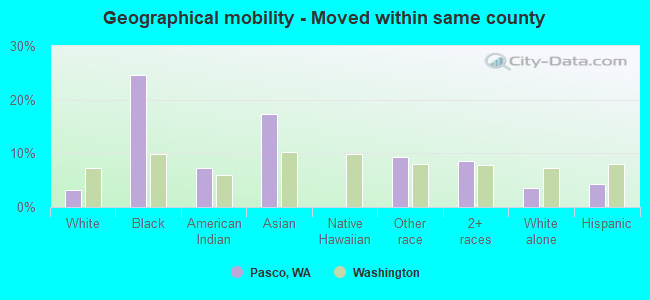
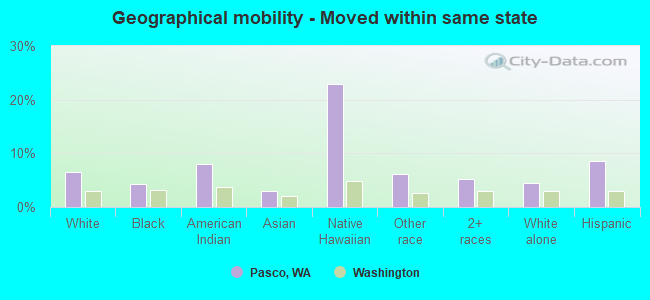
Geographical mobility - Moved within same county (%)
Geographical mobility - Moved within same county (%) - White
Geographical mobility - Moved within same county (%) - Black or African American
Geographical mobility - Moved within same county (%) - Asian
Geographical mobility - Moved within same county (%) - Hispanic or Latino
Geographical mobility - Moved within same county (%) - American Indian and Alaska Native
Geographical mobility - Moved within same county (%) - Multirace
Geographical mobility - Moved within same county (%) - Other Race
Geographical mobility - Moved from different county within same state (%)
Geographical mobility - Moved from different county within same state (%) - White
Geographical mobility - Moved from different county within same state (%) - Black or African American
Geographical mobility - Moved from different county within same state (%) - Asian
Geographical mobility - Moved from different county within same state (%) - Hispanic or Latino
Geographical mobility - Moved from different county within same state (%) - American Indian and Alaska Native
Geographical mobility - Moved from different county within same state (%) - Multirace
Geographical mobility - Moved from different county within same state (%) - Other Race
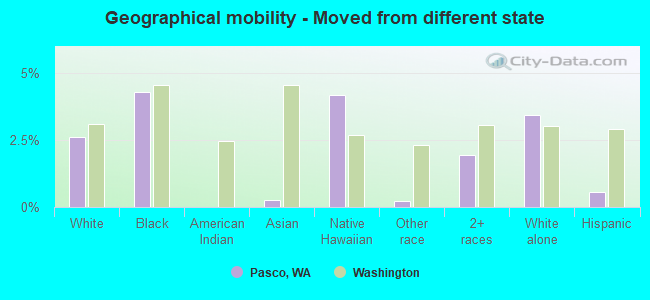
Geographical mobility - Moved from different state (%)
Geographical mobility - Moved from different state (%) - White
Geographical mobility - Moved from different state (%) - Black or African American
Geographical mobility - Moved from different state (%) - Asian
Geographical mobility - Moved from different state (%) - Hispanic or Latino
Geographical mobility - Moved from different state (%) - American Indian and Alaska Native
Geographical mobility - Moved from different state (%) - Multirace
Geographical mobility - Moved from different state (%) - Other Race
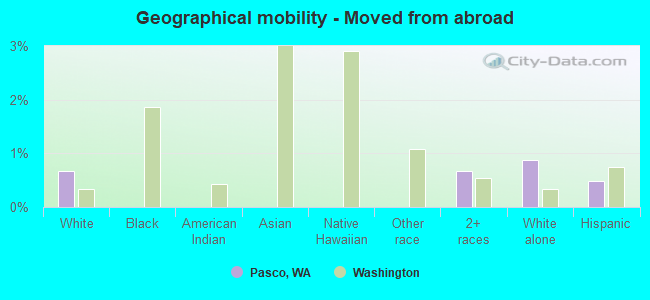
Geographical mobility - Moved from abroad (%)
Geographical mobility - Moved from abroad (%) - White
Geographical mobility - Moved from abroad (%) - Black or African American
Geographical mobility - Moved from abroad (%) - Asian
Geographical mobility - Moved from abroad (%) - Hispanic or Latino
Geographical mobility - Moved from abroad (%) - American Indian and Alaska Native
Geographical mobility - Moved from abroad (%) - Multirace
Geographical mobility - Moved from abroad (%) - Other Race
Place of birth for the foreign-born population - Ireland (%)
Place of birth for the foreign-born population - Denmark (%)
Place of birth for the foreign-born population - Norway (%)
Place of birth for the foreign-born population - Sweden (%)
Place of birth for the foreign-born population - United Kingdom (%)
Place of birth for the foreign-born population - England (%)
Place of birth for the foreign-born population - Scotland (%)
Place of birth for the foreign-born population - Other Northern Europe (%)
Place of birth for the foreign-born population - Austria (%)
Place of birth for the foreign-born population - Belgium (%)
Place of birth for the foreign-born population - France (%)
Place of birth for the foreign-born population - Germany (%)
Place of birth for the foreign-born population - Netherlands (%)
Place of birth for the foreign-born population - Switzerland (%)
Place of birth for the foreign-born population - Other Western Europe (%)
Place of birth for the foreign-born population - Greece (%)
Place of birth for the foreign-born population - Italy (%)
Place of birth for the foreign-born population - Portugal (%)
Place of birth for the foreign-born population - Spain (%)
Place of birth for the foreign-born population - Other Southern Europe (%)
Place of birth for the foreign-born population - Albania (%)
Place of birth for the foreign-born population - Belarus (%)
Place of birth for the foreign-born population - Bosnia and Herzegovina (%)
Place of birth for the foreign-born population - Bulgaria (%)
Place of birth for the foreign-born population - Croatia (%)
Place of birth for the foreign-born population - Czechoslovakia (%)
Place of birth for the foreign-born population - Hungary (%)
Place of birth for the foreign-born population - Latvia (%)
Place of birth for the foreign-born population - Lithuania (%)
Place of birth for the foreign-born population - North Macedonia (Macedonia) (%)
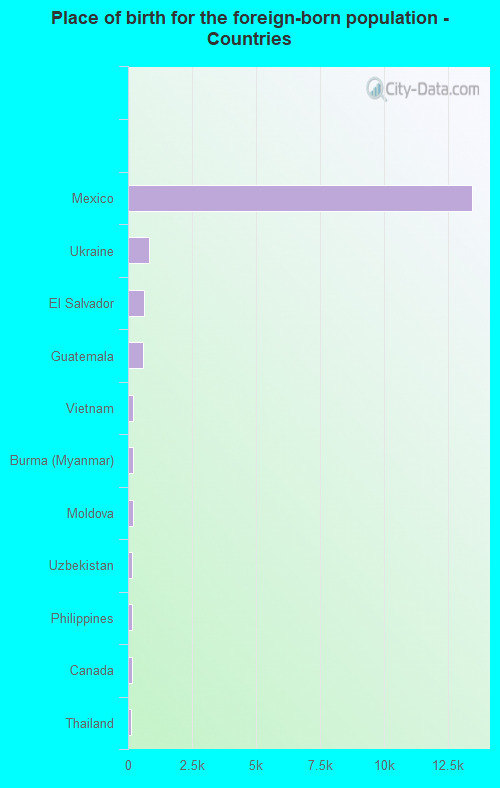
Place of birth for the foreign-born population - Moldova (%)
Place of birth for the foreign-born population - Poland (%)
Place of birth for the foreign-born population - Romania (%)
Place of birth for the foreign-born population - Russia (%)
Place of birth for the foreign-born population - Serbia (%)
Place of birth for the foreign-born population - Ukraine (%)
Place of birth for the foreign-born population - Other Eastern Europe (%)
Place of birth for the foreign-born population - China (%)
Place of birth for the foreign-born population - Hong Kong (%)
Place of birth for the foreign-born population - Taiwan (%)
Place of birth for the foreign-born population - Japan (%)
Place of birth for the foreign-born population - Korea (%)
Place of birth for the foreign-born population - Other Eastern Asia (%)
Place of birth for the foreign-born population - Afghanistan (%)
Place of birth for the foreign-born population - Bangladesh (%)
Place of birth for the foreign-born population - India (%)
Place of birth for the foreign-born population - Iran (%)
Place of birth for the foreign-born population - Kazakhstan (%)
Place of birth for the foreign-born population - Nepal (%)
Place of birth for the foreign-born population - Pakistan (%)
Place of birth for the foreign-born population - Sri Lanka (%)
Place of birth for the foreign-born population - Uzbekistan (%)
Place of birth for the foreign-born population - Other South Central Asia (%)
Place of birth for the foreign-born population - Burma (%)
Place of birth for the foreign-born population - Cambodia (%)
Place of birth for the foreign-born population - Indonesia (%)
Place of birth for the foreign-born population - Laos (%)
Place of birth for the foreign-born population - Malaysia (%)
Place of birth for the foreign-born population - Philippines (%)
Place of birth for the foreign-born population - Singapore (%)
Place of birth for the foreign-born population - Thailand (%)
Place of birth for the foreign-born population - Vietnam (%)
Place of birth for the foreign-born population - Other South Eastern Asia (%)
Place of birth for the foreign-born population - Armenia (%)
Place of birth for the foreign-born population - Iraq (%)
Place of birth for the foreign-born population - Israel (%)
Place of birth for the foreign-born population - Jordan (%)
Place of birth for the foreign-born population - Kuwait (%)
Place of birth for the foreign-born population - Lebanon (%)
Place of birth for the foreign-born population - Saudi Arabia (%)
Place of birth for the foreign-born population - Syria (%)
Place of birth for the foreign-born population - Turkey (%)
Place of birth for the foreign-born population - Yemen (%)
Place of birth for the foreign-born population - Other Western Asia (%)
Place of birth for the foreign-born population - Eritrea (%)
Place of birth for the foreign-born population - Ethiopia (%)
Place of birth for the foreign-born population - Kenya (%)
Place of birth for the foreign-born population - Somalia (%)
Place of birth for the foreign-born population - Uganda (%)
Place of birth for the foreign-born population - Zimbabwe (%)
Place of birth for the foreign-born population - Other Eastern Africa (%)
Place of birth for the foreign-born population - Cameroon (%)
Place of birth for the foreign-born population - Congo (%)
Place of birth for the foreign-born population - Democratic Republic of Congo (Zaire) (%)
Place of birth for the foreign-born population - Other Middle Africa (%)
Place of birth for the foreign-born population - Egypt (%)
Place of birth for the foreign-born population - Morocco (%)
Place of birth for the foreign-born population - Sudan (%)
Place of birth for the foreign-born population - Other Northern Africa (%)
Place of birth for the foreign-born population - South Africa (%)
Place of birth for the foreign-born population - Other Southern Africa (%)
Place of birth for the foreign-born population - Cabo Verde (%)
Place of birth for the foreign-born population - Ghana (%)
Place of birth for the foreign-born population - Liberia (%)
Place of birth for the foreign-born population - Nigeria (%)
Place of birth for the foreign-born population - Senegal (%)
Place of birth for the foreign-born population - Sierra Leone (%)
Place of birth for the foreign-born population - Other Western Africa (%)
Place of birth for the foreign-born population - Australia (%)
Place of birth for the foreign-born population - New Zealand (%)
Place of birth for the foreign-born population - Fiji (%)
Place of birth for the foreign-born population - Micronesia (%)
Place of birth for the foreign-born population - Bahamas (%)
Place of birth for the foreign-born population - Barbados (%)
Place of birth for the foreign-born population - Cuba (%)
Place of birth for the foreign-born population - Dominica (%)
Place of birth for the foreign-born population - Dominican Republic (%)
Place of birth for the foreign-born population - Grenada (%)
Place of birth for the foreign-born population - Haiti (%)
Place of birth for the foreign-born population - Jamaica (%)
Place of birth for the foreign-born population - St. Vincent and the Grenadines (%)
Place of birth for the foreign-born population - Trinidad and Tobago (%)
Place of birth for the foreign-born population - West Indies (%)
Place of birth for the foreign-born population - Other Caribbean (%)
Place of birth for the foreign-born population - Belize (%)
Place of birth for the foreign-born population - Costa Rica (%)
Place of birth for the foreign-born population - El Salvador (%)
Place of birth for the foreign-born population - Guatemala (%)
Place of birth for the foreign-born population - Honduras (%)
Place of birth for the foreign-born population - Mexico (%)
Place of birth for the foreign-born population - Nicaragua (%)
Place of birth for the foreign-born population - Panama (%)
Place of birth for the foreign-born population - Other Central America (%)
Place of birth for the foreign-born population - Argentina (%)
Place of birth for the foreign-born population - Bolivia (%)
Place of birth for the foreign-born population - Brazil (%)
Place of birth for the foreign-born population - Chile (%)
Place of birth for the foreign-born population - Colombia (%)
Place of birth for the foreign-born population - Ecuador (%)
Place of birth for the foreign-born population - Guyana (%)
Place of birth for the foreign-born population - Peru (%)
Place of birth for the foreign-born population - Uruguay (%)
Place of birth for the foreign-born population - Venezuela (%)
Place of birth for the foreign-born population - Other South America (%)
Place of birth for the foreign-born population - Canada (%)
Place of birth for the foreign-born population - Other Northern America (%)
Place of birth for the foreign-born population - Other (%)
Latest news about races in Pasco, WA collected exclusively by city-data.com from local newspapers, TV, and radio stations
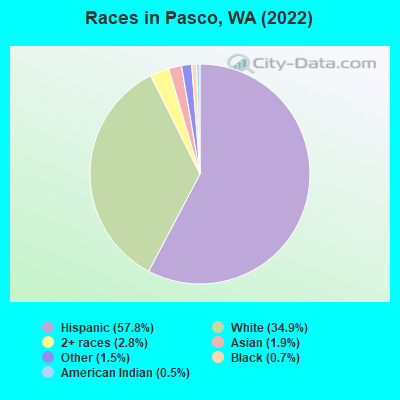
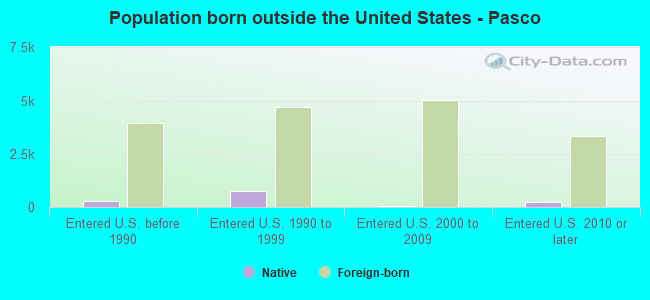
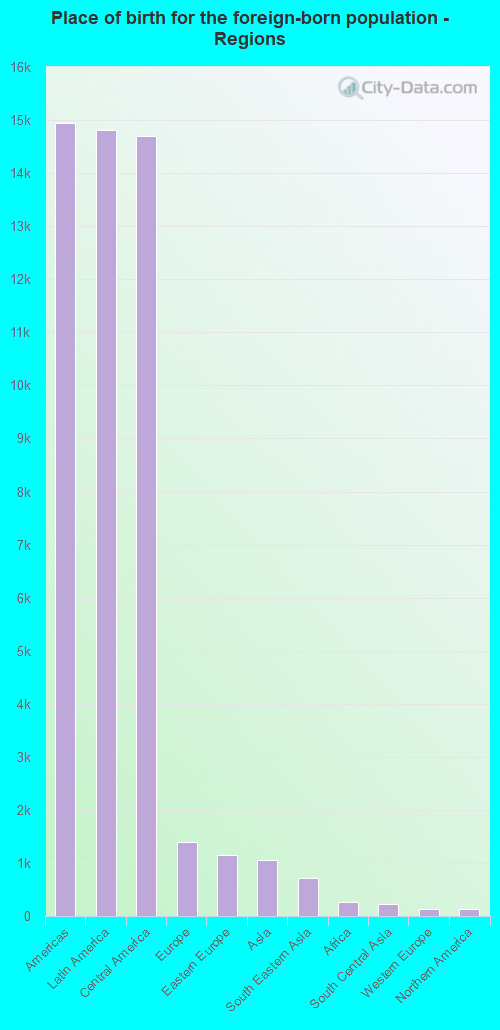
According to 2022 data, the most numerous races in Pasco, WA are White alone (27,955 residents), Hispanic (46,356 residents), and Asian alone (1,497 residents). 48.1% of Pasco residents speak English at home. 22.4% of Pasco, WA residents are foreign-born (18.4% born in Latin America), which is 33.1% greater than the foreign-born rate of 15.0% across the entire state of Washington.
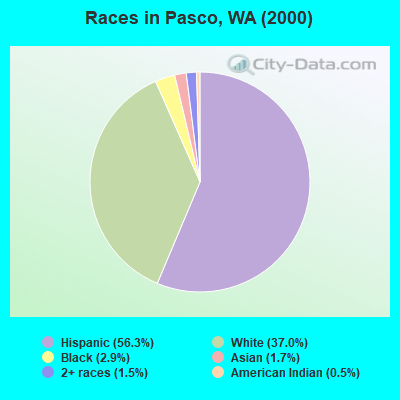
Race distribution in Pasco
2000 2022
4,652,490 78.9% White alone 441,509 7.5% Hispanic 319,401 5.4% Asian alone 184,631 3.1% Black alone 175,926 3.0% Two or more races 85,396 1.4% American Indian alone 22,779 0.4% Native Hawaiian and Other 11,989 0.2% Other race alone
4,941,456 63.5% White alone 1,093,313 14.0% Hispanic 755,832 9.7% Asian alone 523,448 6.7% Two or more races 299,537 3.8% Black alone 69,024 0.9% American Indian alone 52,231 0.7% Native Hawaiian and Other 50,945 0.7% Other race alone
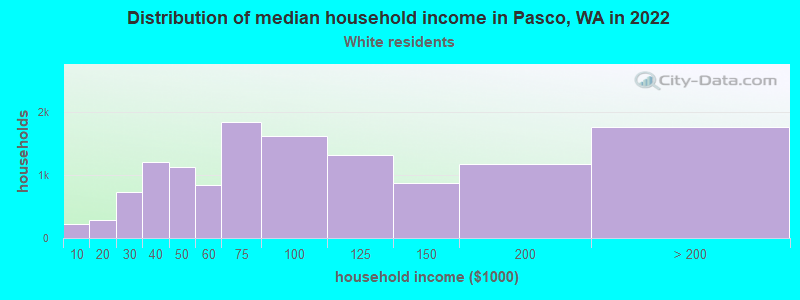
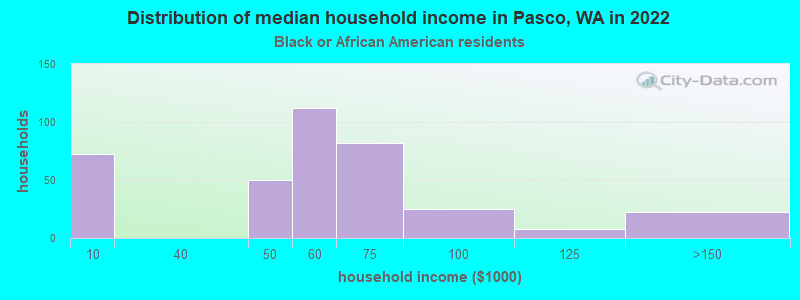
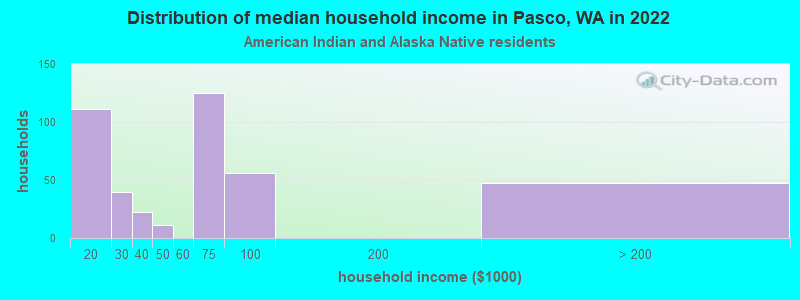
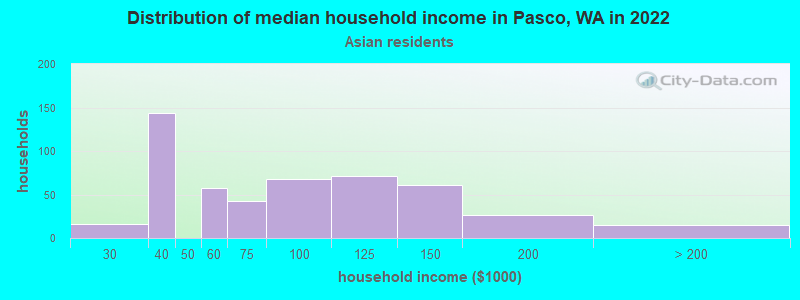
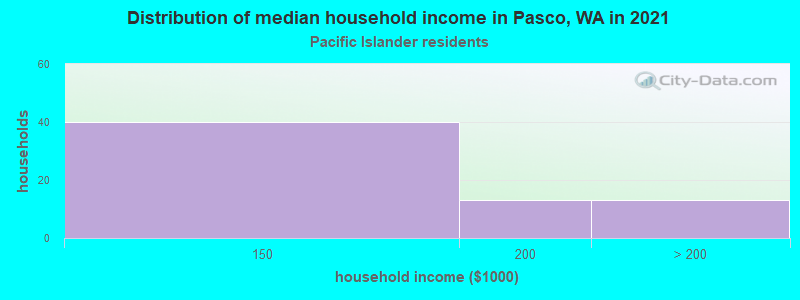
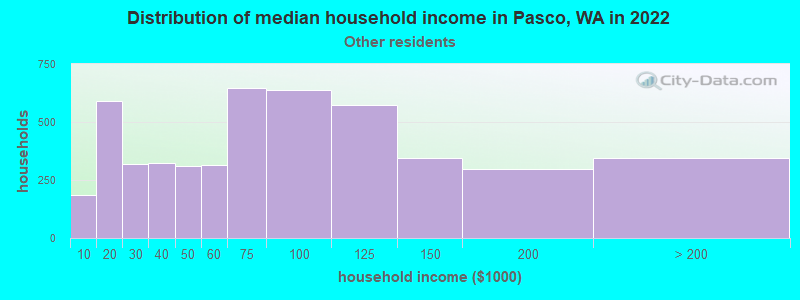
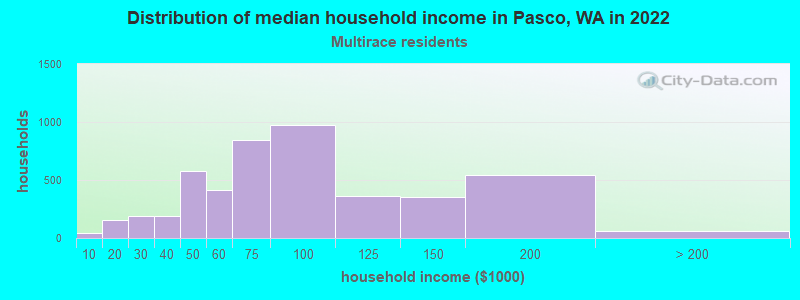
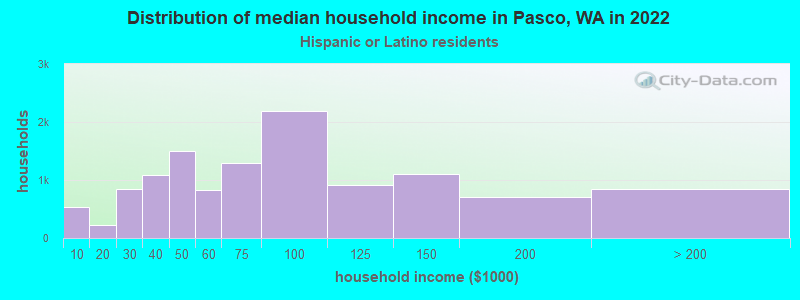
Income and house value in Pasco Median household income in 2022 $87,225 White non-Hispanic householders$75,315 Asian householders$78,609 Some other race householders$74,775 Two or more races householders$72,949 Hispanic or Latino race householdersMedian 2022 house value $438,277 White Non-Hispanic householders$350,098 Black or African American householders$283,745 American Indian or Alaska Native householders $383,274 Asian householders$337,875 Some other race householders$361,011 Two or more races householders$333,946 Hispanic or Latino householders
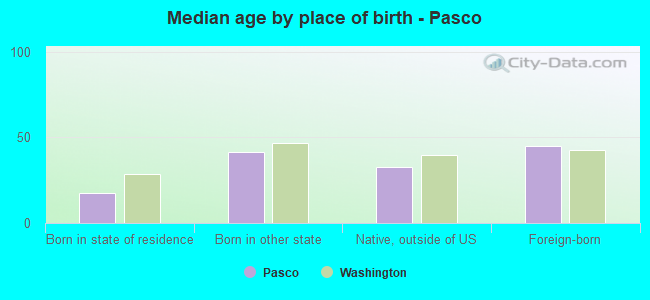
Median age by race in Pasco
33.1 Median age for White residents30.9 35.2 49.1 Median age for Black or African American residents44.7 -666,666,666.0 15.8 Median age for American Indian / Alaska Native residents17.2 12.6 44.6 Median age for Asian residents29.3 44.8 -666,666,666.0 Median age for Native Hawaiian / Pacific Islander residents-666,666,666.0 -666,666,666.0 29.3 Median age for Other race residents29.5 27.5 27.1 Median age for Two or more races residents32.2 23.1 38.1 Median age for White alone residents36.0 41.2 23.9 Median age for Hispanic or Latino residents24.8 23.2
Owner/renter occupied households by race in Pasco
House owners and renters - White residents 9,413 72.7% Owner occupied3,529 27.3% Renter occupiedHouse owners and renters - Black or African American residents 198 54.8% Owner occupied163 45.2% Renter occupiedHouse owners and renters - American Indian / Alaska Native residents 215 49.6% Owner occupied218 50.4% Renter occupiedHouse owners and renters - Asian residents 406 80.4% Owner occupied99 19.6% Renter occupiedHouse owners and renters - Native Hawaiian / Pacific Islander residents 50 77.2% Owner occupied15 22.8% Renter occupiedHouse owners and renters - Other race residents 3,079 58.7% Owner occupied2,168 41.3% Renter occupiedHouse owners and renters - Two or more races residents 4,444 75.8% Owner occupied1,416 24.2% Renter occupiedHouse owners and renters - White alone residents 8,061 74.5% Owner occupied2,762 25.5% Renter occupiedHouse owners and renters - Hispanic or Latino residents 8,092 66.9% Owner occupied4,008 33.1% Renter occupied
Language usage in Pasco
English speakers - Total 48.1% of residents of Pasco speak English at home.
46.8% of residents speak Spanish at home 19,620 57.0% Speak English very well14,811 43.0% Speak English less than very well5.1% of residents speak other language at home 2,404 64.5% Speak English very well1,325 35.5% Speak English less than very well
English speakers - Born in the United States 74.1% of residents of Pasco speak English at home.
25.5% of residents speak Spanish at home 4,274 81.9% Speak English very well946 18.1% Speak English less than very well0.4% of residents speak other language at home 81 100.0% Speak English very well
English speakers - Native, born elsewhere 27.5% of residents of Pasco speak English at home.
44.8% of residents speak Spanish at home 572 100.0% Speak English very well27.8% of residents speak other language at home 355 100.0% Speak English very well
English speakers - Foreign-born 4.8% of residents of Pasco speak English at home.
81.3% of residents speak Spanish at home 4,213 30.4% Speak English very well9,633 69.6% Speak English less than very well13.9% of residents speak other language at home 1,088 45.8% Speak English very well1,285 54.2% Speak English less than very well
White (Caucasian) - Speak only English Native:
81.5% (25,921)Foreign-born:
19.8% (356)
White (Caucasian) - Speak another language Native:
18.5% (5,895)Foreign-born:
80.2% (1,446)
Black or African American - Speak another language Native:
24.6% (365)Foreign-born:
97.1% (314)
American Indian / Alaska Native - Speak another language Native:
76.2% (859)Foreign-born:
100.0% (767)
Asian - Speak only English Native:
91.2% (712)Foreign-born:
7.5% (64)
Asian - Speak another language Native:
7.5% (58)Foreign-born:
92.1% (791)
Native Hawaiian / Pacific Islander - Speak another language Native:
5.4% (8)Foreign-born:
96.0% (9)
Other race - Speak only English Native:
26.0% (2,520)Foreign-born:
4.7% (333)
Other race - Speak another language Native:
74.0% (7,167)Foreign-born:
95.3% (6,757)
Two or more races - Speak only English Native:
33.9% (4,151)Foreign-born:
2.0% (130)
Two or more races - Speak another language Native:
66.1% (8,077)Foreign-born:
98.0% (6,263)
White alone - Speak only English Native:
93.2% (23,462)Foreign-born:
33.2% (356)
White alone - Speak another language Native:
6.8% (1,718)Foreign-born:
66.8% (717)
Hispanic or Latino - Speak only English Native:
28.5% (7,854)Foreign-born:
3.2% (463)
Hispanic or Latino - Speak another language Native:
71.5% (19,718)Foreign-born:
96.8% (13,846)
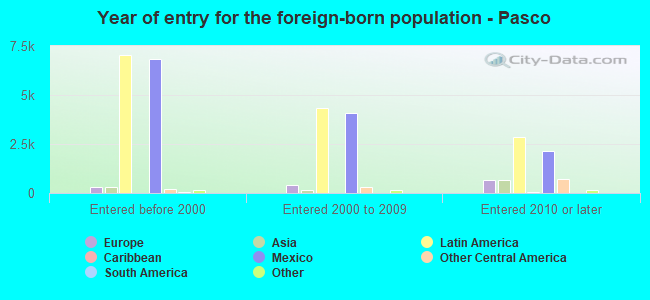
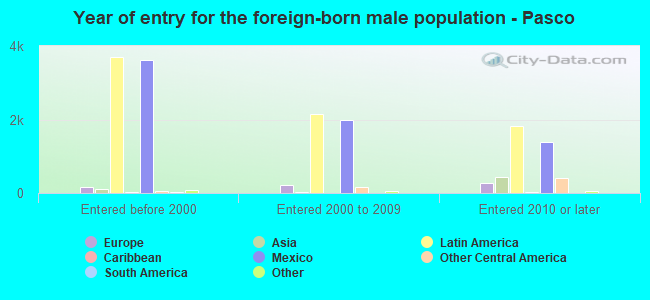
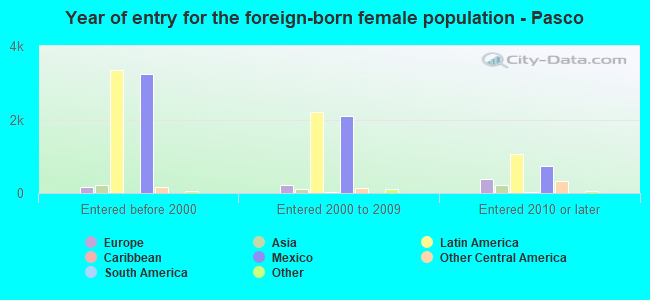
Foreign-born residents in Pasco 17,693 residents are foreign born (18.4% Latin America ).
This city:
22.4%Washington:
14.9%
Marital status for residents in Pasco Marital status - White (Caucasian) population 15 years and over
Males 40.3% Never married48.9% Now married0.4% Separated2.0% Widowed8.4% DivorcedFemales 28.1% Never married57.4% Now married1.1% Separated3.7% Widowed9.7% DivorcedWomen who gave birth in the past 12 months Now married:
92.4% (376)Unmarried:
7.6% (31)
Women who did not give birth in the past 12 months Now married:
48.6% (4,057)Unmarried:
51.4% (4,291)
Marital status - Black or African American population 15 years and over
Males 60.7% Never married32.7% Now married2.3% Separated0.0% Widowed4.3% DivorcedFemales 74.4% Never married16.9% Now married0.0% Separated0.0% Widowed8.8% DivorcedWomen who did not give birth in the past 12 months Now married:
10.6% (50)Unmarried:
89.4% (424)
Marital status - American Indian / Alaska Native population 15 years and over
Males 72.3% Never married24.8% Now married0.0% Separated0.0% Widowed2.9% DivorcedFemales 51.3% Never married30.7% Now married0.0% Separated9.4% Widowed8.6% DivorcedWomen who gave birth in the past 12 months Now married:
100.0% (61)Unmarried:
0.0% (0)
Women who did not give birth in the past 12 months Now married:
10.8% (32)Unmarried:
89.2% (265)
Marital status - Asian population 15 years and over
Males 40.0% Never married53.6% Now married0.0% Separated0.0% Widowed6.4% DivorcedFemales 2.7% Never married76.2% Now married6.5% Separated11.2% Widowed3.4% DivorcedWomen who did not give birth in the past 12 months Now married:
91.2% (540)Unmarried:
8.8% (52)
Marital status - Native Hawaiian / Pacific Islander population 15 years and over
Males 37.5% Never married62.5% Now married0.0% Separated0.0% Widowed0.0% DivorcedFemales 8.6% Never married91.4% Now married0.0% Separated0.0% Widowed0.0% DivorcedWomen who did not give birth in the past 12 months Now married:
0.0% (0)Unmarried:
100.0% (5)
Marital status - Other race population 15 years and over
Males 39.1% Never married55.1% Now married0.3% Separated0.3% Widowed5.2% DivorcedFemales 44.1% Never married49.4% Now married0.6% Separated0.3% Widowed5.7% DivorcedWomen who gave birth in the past 12 months Now married:
48.2% (308)Unmarried:
51.8% (331)
Women who did not give birth in the past 12 months Now married:
46.8% (2,090)Unmarried:
53.2% (2,376)
Marital status - Two or more races population 15 years and over
Males 28.1% Never married63.7% Now married0.0% Separated0.8% Widowed7.4% DivorcedFemales 38.5% Never married45.7% Now married2.4% Separated3.8% Widowed9.6% DivorcedWomen who gave birth in the past 12 months Now married:
60.6% (322)Unmarried:
39.4% (209)
Women who did not give birth in the past 12 months Now married:
38.4% (2,081)Unmarried:
61.6% (3,337)
Marital status - White alone, not Hispanic / Latino population 15 years and over
Males 30.0% Never married56.4% Now married0.5% Separated2.6% Widowed10.5% DivorcedFemales 23.2% Never married61.0% Now married1.3% Separated4.0% Widowed10.5% DivorcedWomen who gave birth in the past 12 months Now married:
90.8% (306)Unmarried:
9.2% (31)
Women who did not give birth in the past 12 months Now married:
52.4% (3,355)Unmarried:
47.6% (3,053)
Marital status - Hispanic or Latino population 15 years and over
Males 46.5% Never married48.3% Now married0.1% Separated0.5% Widowed4.7% DivorcedFemales 45.1% Never married45.1% Now married1.4% Separated1.8% Widowed6.6% DivorcedWomen who gave birth in the past 12 months Now married:
59.9% (807)Unmarried:
40.1% (540)
Women who did not give birth in the past 12 months Now married:
39.9% (4,551)Unmarried:
60.1% (6,860)
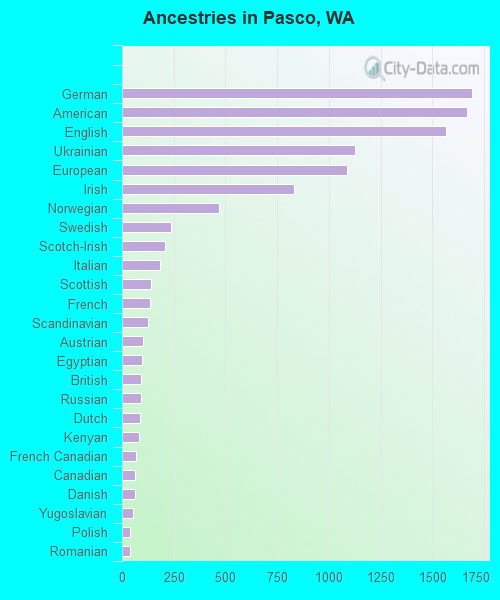
Ancestries in Pasco
1,690 3.8% German1,670 3.8% American1,569 3.5% English1,126 2.5% Ukrainian1,087 2.4% European832 1.9% Irish470 1.1% Norwegian235 0.5% Swedish210 0.5% Scotch-Irish182 0.4% Italian142 0.3% Scottish136 0.3% French124 0.3% Scandinavian100 0.2% Austrian99 0.2% Egyptian94 0.2% British90 0.2% Russian85 0.2% Dutch83 0.2% Kenyan67 0.2% French Canadian62 0.1% Canadian61 0.1% Danish55 0.1% Yugoslavian41 0.09% Polish38 0.09% Romanian31 0.07% Northern European27 0.06% Czech25 0.06% Czechoslovakian21 0.05% Finnish19 0.04% Brazilian19 0.04% Slovak19 0.04% Welsh16 0.04% Iraqi16 0.04% Lebanese14 0.03% Swiss13 0.03% Pennsylvania German10 0.02% Celtic7 0.02% Portuguese7 0.02% Eastern European7 0.02% Slovene
Geographical mobility in Pasco Same house 1 year ago 31,456 87.2% White (Caucasian)1,188 62.1% Black or African American1,554 83.6% American Indian / Alaska Native1,358 79.0% Asian137 78.6% Native Hawaiian / Pacific Islander15,325 84.4% Other race14,207 83.2% Two or more races24,258 87.7% White alone, not Hispanic / Latino39,201 86.2% Hispanic or LatinoMoved within same county 1,112 3.1% White / Caucasian471 24.6% Black or African American134 7.2% American Indian / Alaska Native300 17.4% Asian1,681 9.3% Other race1,475 8.6% Two or more races963 3.5% White alone, not Hispanic / Latino1,923 4.2% Hispanic or LatinoMoved within same state 2,319 6.4% White / Caucasian84 4.4% Black or African American148 8.0% American Indian / Alaska Native52 3.1% Asian40 22.9% Native Hawaiian / Pacific Islander1,108 6.1% Other race887 5.2% Two or more races1,250 4.5% White alone, not Hispanic / Latino3,854 8.5% Hispanic or LatinoMoved from different state 945 2.6% White / Caucasian82 4.3% Black or African American5 0.3% Asian7 4.2% Native Hawaiian / Pacific Islander39 0.2% Other race330 1.9% Two or more races945 3.4% White alone, not Hispanic / Latino250 0.6% Hispanic or LatinoMoved from abroad 243 0.7% White116 0.7% Two or more races243 0.9% White alone, not Hispanic / Latino224 0.5% Hispanic or Latino
Children Nativity (place of birth) in Pasco
Children under 6 years - Living with two parents Both parents native 2,402 100.0% NativeBoth parents foreign-born 2,332 100.0% NativeOne native, one foreign-born parent 953 100.0% NativeChildren under 6 years - Living with one parent Native parent 2,019 100.0% NativeForeign-born parent 755 100.0% NativeChildren 6 to 17 years - Living with two parents Both parents native 4,014 100.0% NativeBoth parents foreign-born 4,471 94.5% Native258 5.5% Foreign-bornOne native, one foreign-born parent 2,189 100.0% NativeChildren 6 to 17 years - Living with one parent Native parent 3,899 100.0% NativeForeign-born parent 1,698 50.9% Native1,637 49.1% Foreign-born
Grandparents responsible for own grandchildren in Pasco
Grandparents (30 to 59 years) White / Caucasian 99 20.7% Responsible for grandchildren381 79.3% Not responsible for grandchildrenBlack or African American 53 100.0% Responsible for grandchildrenAmerican Indian / Alaska Native 6 35.4% Responsible for grandchildren12 64.6% Not responsible for grandchildrenOther race 35 12.7% Responsible for grandchildren237 87.3% Not responsible for grandchildrenTwo or more races 13 3.8% Responsible for grandchildren324 96.2% Not responsible for grandchildrenWhite alone, not Hispanic / Latino 43 13.8% Responsible for grandchildren269 86.2% Not responsible for grandchildrenHispanic or Latino 154 24.1% Responsible for grandchildren484 75.9% Not responsible for grandchildrenGrandparents (60 years and over) White / Caucasian 158 41.5% Responsible for grandchildren223 58.5% Not responsible for grandchildrenBlack or African American 21 100.0% Not responsible for grandchildrenOther race 79 18.4% Responsible for grandchildren351 81.6% Not responsible for grandchildrenTwo or more races 84 41.7% Responsible for grandchildren117 58.3% Not responsible for grandchildrenWhite alone, not Hispanic / Latino 149 56.7% Responsible for grandchildren114 43.3% Not responsible for grandchildrenHispanic or Latino 193 18.8% Responsible for grandchildren832 81.2% Not responsible for grandchildren