Races in Passaic, New Jersey (NJ) Detailed Stats
Data:
Races - White alone (%)
Races - White alone (% change since 2000)
Races - Black alone (%)
Races - Black alone (% change since 2000)
Races - American Indian alone (%)
Races - American Indian alone (% change since 2000)
Races - Asian alone (%)
Races - Asian alone (% change since 2000)
Races - Hispanic (%)
Races - Hispanic (% change since 2000)
Races - Native Hawaiian and Other Pacific Islander alone (%)
Races - Native Hawaiian and Other Pacific Islander alone (% change since 2000)
Races - Two or more races(%)
Races - Two or more races(% change since 2000)
Races - Other race alone (%)
Races - Other race alone (% change since 2000)
Racial diversity
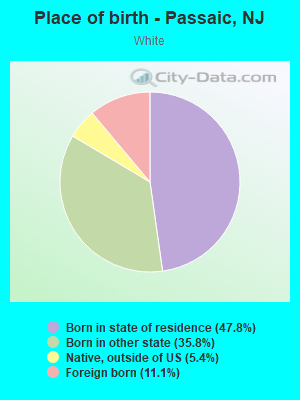
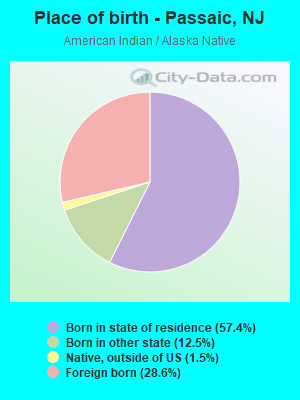
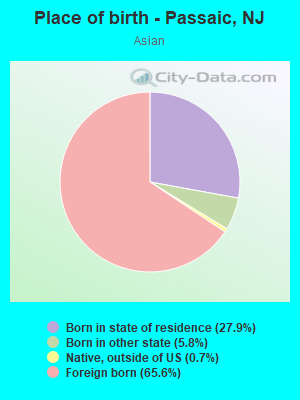
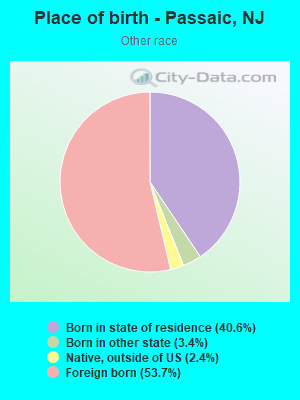
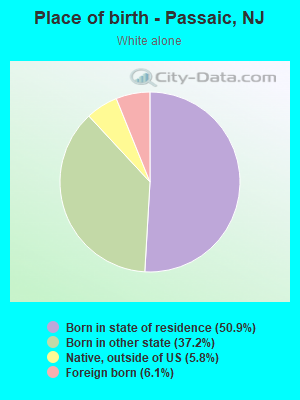
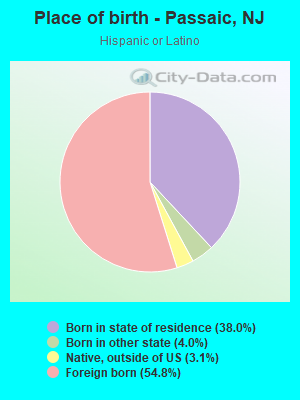
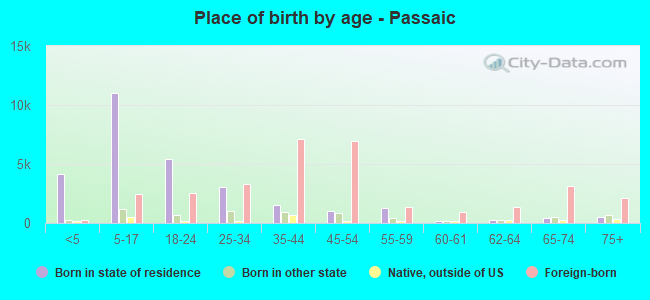
Place of birth - Born in state of residence (%)
Place of birth - Born in state of residence (%) - White
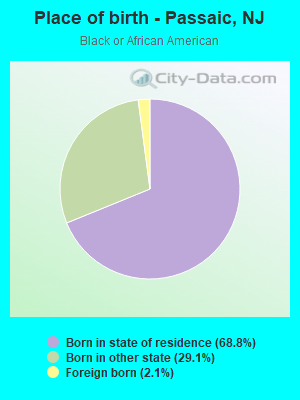
Place of birth - Born in state of residence (%) - Black or African American
Place of birth - Born in state of residence (%) - Asian
Place of birth - Born in state of residence (%) - Hispanic or Latino
Place of birth - Born in state of residence (%) - American Indian and Alaska Native
Place of birth - Born in state of residence (%) - Multirace
Place of birth - Born in state of residence (%) - Other Race
Place of birth - Born in other state (%)
Place of birth - Born in other state (%) - White
Place of birth - Born in other state (%) - Black or African American
Place of birth - Born in other state (%) - Asian
Place of birth - Born in other state (%) - Hispanic or Latino
Place of birth - Born in other state (%) - American Indian and Alaska Native
Place of birth - Born in other state (%) - Multirace
Place of birth - Born in other state (%) - Other Race
Place of birth - Native, outside of US (%)
Place of birth - Native, outside of US (%) - White
Place of birth - Native, outside of US (%) - Black or African American
Place of birth - Native, outside of US (%) - Asian
Place of birth - Native, outside of US (%) - Hispanic or Latino
Place of birth - Native, outside of US (%) - American Indian and Alaska Native
Place of birth - Native, outside of US (%) - Multirace
Place of birth - Native, outside of US (%) - Other Race
Place of birth - Foreign born (%)
Place of birth - Foreign born (%) - White
Place of birth - Foreign born (%) - Black or African American
Place of birth - Foreign born (%) - Asian
Place of birth - Foreign born (%) - Hispanic or Latino
Place of birth - Foreign born (%) - American Indian and Alaska Native
Place of birth - Foreign born (%) - Multirace
Place of birth - Foreign born (%) - Other Race
Residents speaking English at home (%)
Residents speaking English at home - Born in the United States (%)
Residents speaking English at home - Native, born elsewhere (%)
Residents speaking English at home - Foreign born (%)
Residents speaking Spanish at home (%)
Residents speaking Spanish at home - Born in the United States (%)
Residents speaking Spanish at home - Native, born elsewhere (%)
Residents speaking Spanish at home - Foreign born (%)
Residents speaking other language at home (%)
Residents speaking other language at home - Born in the United States (%)
Residents speaking other language at home - Native, born elsewhere (%)
Residents speaking other language at home - Foreign born (%)
Marital status - Never married (%)
Marital status - Now married (%)
Marital status - Separated (%)
Marital status - Widowed (%)
Marital status - Divorced (%)
Ancestries Reported - Arab (%)
Ancestries Reported - Czech (%)
Ancestries Reported - Danish (%)
Ancestries Reported - Dutch (%)
Ancestries Reported - English (%)
Ancestries Reported - French (%)
Ancestries Reported - French Canadian (%)
Ancestries Reported - German (%)
Ancestries Reported - Greek (%)
Ancestries Reported - Hungarian (%)
Ancestries Reported - Irish (%)
Ancestries Reported - Italian (%)
Ancestries Reported - Lithuanian (%)
Ancestries Reported - Norwegian (%)
Ancestries Reported - Polish (%)
Ancestries Reported - Portuguese (%)
Ancestries Reported - Russian (%)
Ancestries Reported - Scotch-Irish (%)
Ancestries Reported - Scottish (%)
Ancestries Reported - Slovak (%)
Ancestries Reported - Subsaharan African (%)
Ancestries Reported - Swedish (%)
Ancestries Reported - Swiss (%)
Ancestries Reported - Ukrainian (%)
Ancestries Reported - United States (%)
Ancestries Reported - Welsh (%)
Ancestries Reported - West Indian (%)
Ancestries Reported - Other (%)
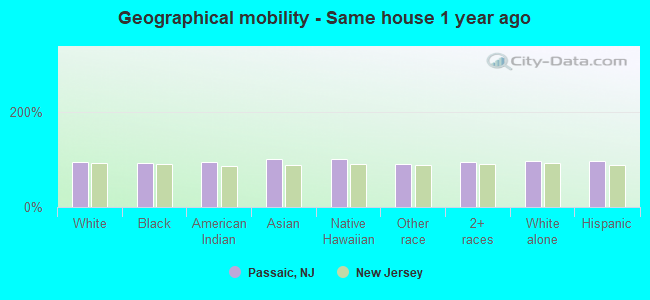
Geographical mobility - Same house 1 year ago (%)
Geographical mobility - Same house 1 year ago (%) - White
Geographical mobility - Same house 1 year ago (%) - Black or African American
Geographical mobility - Same house 1 year ago (%) - Asian
Geographical mobility - Same house 1 year ago (%) - Hispanic or Latino
Geographical mobility - Same house 1 year ago (%) - American Indian and Alaska Native
Geographical mobility - Same house 1 year ago (%) - Multirace
Geographical mobility - Same house 1 year ago (%) - Other Race
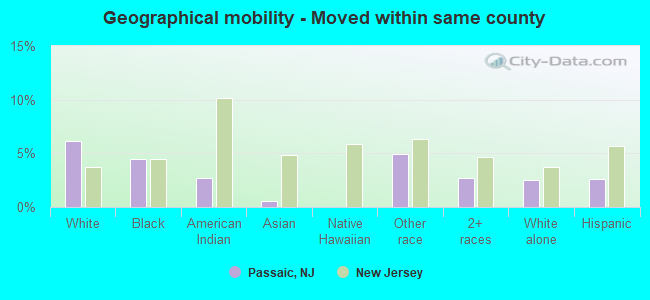
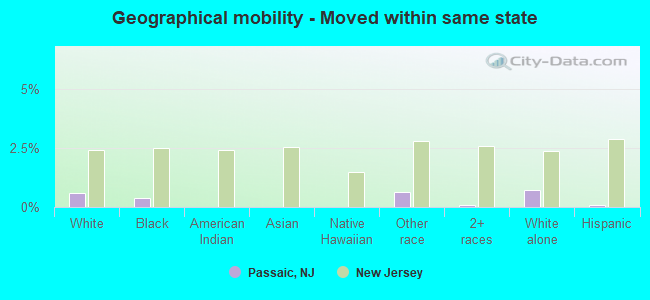
Geographical mobility - Moved within same county (%)
Geographical mobility - Moved within same county (%) - White
Geographical mobility - Moved within same county (%) - Black or African American
Geographical mobility - Moved within same county (%) - Asian
Geographical mobility - Moved within same county (%) - Hispanic or Latino
Geographical mobility - Moved within same county (%) - American Indian and Alaska Native
Geographical mobility - Moved within same county (%) - Multirace
Geographical mobility - Moved within same county (%) - Other Race
Geographical mobility - Moved from different county within same state (%)
Geographical mobility - Moved from different county within same state (%) - White
Geographical mobility - Moved from different county within same state (%) - Black or African American
Geographical mobility - Moved from different county within same state (%) - Asian
Geographical mobility - Moved from different county within same state (%) - Hispanic or Latino
Geographical mobility - Moved from different county within same state (%) - American Indian and Alaska Native
Geographical mobility - Moved from different county within same state (%) - Multirace
Geographical mobility - Moved from different county within same state (%) - Other Race
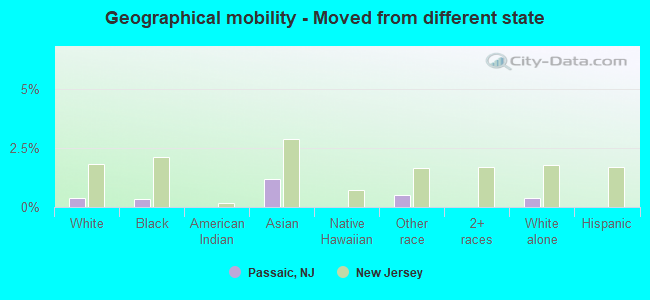
Geographical mobility - Moved from different state (%)
Geographical mobility - Moved from different state (%) - White
Geographical mobility - Moved from different state (%) - Black or African American
Geographical mobility - Moved from different state (%) - Asian
Geographical mobility - Moved from different state (%) - Hispanic or Latino
Geographical mobility - Moved from different state (%) - American Indian and Alaska Native
Geographical mobility - Moved from different state (%) - Multirace
Geographical mobility - Moved from different state (%) - Other Race
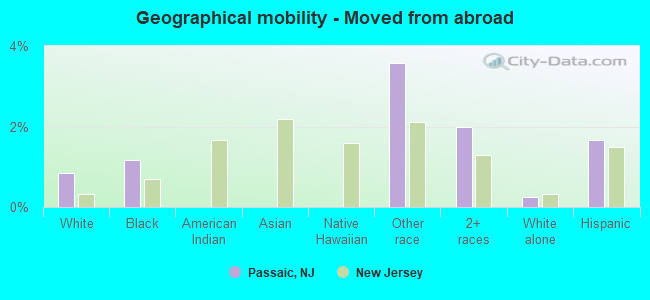
Geographical mobility - Moved from abroad (%)
Geographical mobility - Moved from abroad (%) - White
Geographical mobility - Moved from abroad (%) - Black or African American
Geographical mobility - Moved from abroad (%) - Asian
Geographical mobility - Moved from abroad (%) - Hispanic or Latino
Geographical mobility - Moved from abroad (%) - American Indian and Alaska Native
Geographical mobility - Moved from abroad (%) - Multirace
Geographical mobility - Moved from abroad (%) - Other Race
Place of birth for the foreign-born population - Ireland (%)
Place of birth for the foreign-born population - Denmark (%)
Place of birth for the foreign-born population - Norway (%)
Place of birth for the foreign-born population - Sweden (%)
Place of birth for the foreign-born population - United Kingdom (%)
Place of birth for the foreign-born population - England (%)
Place of birth for the foreign-born population - Scotland (%)
Place of birth for the foreign-born population - Other Northern Europe (%)
Place of birth for the foreign-born population - Austria (%)
Place of birth for the foreign-born population - Belgium (%)
Place of birth for the foreign-born population - France (%)
Place of birth for the foreign-born population - Germany (%)
Place of birth for the foreign-born population - Netherlands (%)
Place of birth for the foreign-born population - Switzerland (%)
Place of birth for the foreign-born population - Other Western Europe (%)
Place of birth for the foreign-born population - Greece (%)
Place of birth for the foreign-born population - Italy (%)
Place of birth for the foreign-born population - Portugal (%)
Place of birth for the foreign-born population - Spain (%)
Place of birth for the foreign-born population - Other Southern Europe (%)
Place of birth for the foreign-born population - Albania (%)
Place of birth for the foreign-born population - Belarus (%)
Place of birth for the foreign-born population - Bosnia and Herzegovina (%)
Place of birth for the foreign-born population - Bulgaria (%)
Place of birth for the foreign-born population - Croatia (%)
Place of birth for the foreign-born population - Czechoslovakia (%)
Place of birth for the foreign-born population - Hungary (%)
Place of birth for the foreign-born population - Latvia (%)
Place of birth for the foreign-born population - Lithuania (%)
Place of birth for the foreign-born population - North Macedonia (Macedonia) (%)
Place of birth for the foreign-born population - Moldova (%)
Place of birth for the foreign-born population - Poland (%)
Place of birth for the foreign-born population - Romania (%)
Place of birth for the foreign-born population - Russia (%)
Place of birth for the foreign-born population - Serbia (%)
Place of birth for the foreign-born population - Ukraine (%)
Place of birth for the foreign-born population - Other Eastern Europe (%)
Place of birth for the foreign-born population - China (%)
Place of birth for the foreign-born population - Hong Kong (%)
Place of birth for the foreign-born population - Taiwan (%)
Place of birth for the foreign-born population - Japan (%)
Place of birth for the foreign-born population - Korea (%)
Place of birth for the foreign-born population - Other Eastern Asia (%)
Place of birth for the foreign-born population - Afghanistan (%)
Place of birth for the foreign-born population - Bangladesh (%)
Place of birth for the foreign-born population - India (%)
Place of birth for the foreign-born population - Iran (%)
Place of birth for the foreign-born population - Kazakhstan (%)
Place of birth for the foreign-born population - Nepal (%)
Place of birth for the foreign-born population - Pakistan (%)
Place of birth for the foreign-born population - Sri Lanka (%)
Place of birth for the foreign-born population - Uzbekistan (%)
Place of birth for the foreign-born population - Other South Central Asia (%)
Place of birth for the foreign-born population - Burma (%)
Place of birth for the foreign-born population - Cambodia (%)
Place of birth for the foreign-born population - Indonesia (%)
Place of birth for the foreign-born population - Laos (%)
Place of birth for the foreign-born population - Malaysia (%)
Place of birth for the foreign-born population - Philippines (%)
Place of birth for the foreign-born population - Singapore (%)
Place of birth for the foreign-born population - Thailand (%)
Place of birth for the foreign-born population - Vietnam (%)
Place of birth for the foreign-born population - Other South Eastern Asia (%)
Place of birth for the foreign-born population - Armenia (%)
Place of birth for the foreign-born population - Iraq (%)
Place of birth for the foreign-born population - Israel (%)
Place of birth for the foreign-born population - Jordan (%)
Place of birth for the foreign-born population - Kuwait (%)
Place of birth for the foreign-born population - Lebanon (%)
Place of birth for the foreign-born population - Saudi Arabia (%)
Place of birth for the foreign-born population - Syria (%)
Place of birth for the foreign-born population - Turkey (%)
Place of birth for the foreign-born population - Yemen (%)
Place of birth for the foreign-born population - Other Western Asia (%)
Place of birth for the foreign-born population - Eritrea (%)
Place of birth for the foreign-born population - Ethiopia (%)
Place of birth for the foreign-born population - Kenya (%)
Place of birth for the foreign-born population - Somalia (%)
Place of birth for the foreign-born population - Uganda (%)
Place of birth for the foreign-born population - Zimbabwe (%)
Place of birth for the foreign-born population - Other Eastern Africa (%)
Place of birth for the foreign-born population - Cameroon (%)
Place of birth for the foreign-born population - Congo (%)
Place of birth for the foreign-born population - Democratic Republic of Congo (Zaire) (%)
Place of birth for the foreign-born population - Other Middle Africa (%)
Place of birth for the foreign-born population - Egypt (%)
Place of birth for the foreign-born population - Morocco (%)
Place of birth for the foreign-born population - Sudan (%)
Place of birth for the foreign-born population - Other Northern Africa (%)
Place of birth for the foreign-born population - South Africa (%)
Place of birth for the foreign-born population - Other Southern Africa (%)
Place of birth for the foreign-born population - Cabo Verde (%)
Place of birth for the foreign-born population - Ghana (%)
Place of birth for the foreign-born population - Liberia (%)
Place of birth for the foreign-born population - Nigeria (%)
Place of birth for the foreign-born population - Senegal (%)
Place of birth for the foreign-born population - Sierra Leone (%)
Place of birth for the foreign-born population - Other Western Africa (%)
Place of birth for the foreign-born population - Australia (%)
Place of birth for the foreign-born population - New Zealand (%)
Place of birth for the foreign-born population - Fiji (%)
Place of birth for the foreign-born population - Micronesia (%)
Place of birth for the foreign-born population - Bahamas (%)
Place of birth for the foreign-born population - Barbados (%)
Place of birth for the foreign-born population - Cuba (%)
Place of birth for the foreign-born population - Dominica (%)
Place of birth for the foreign-born population - Dominican Republic (%)
Place of birth for the foreign-born population - Grenada (%)
Place of birth for the foreign-born population - Haiti (%)
Place of birth for the foreign-born population - Jamaica (%)
Place of birth for the foreign-born population - St. Vincent and the Grenadines (%)
Place of birth for the foreign-born population - Trinidad and Tobago (%)
Place of birth for the foreign-born population - West Indies (%)
Place of birth for the foreign-born population - Other Caribbean (%)
Place of birth for the foreign-born population - Belize (%)
Place of birth for the foreign-born population - Costa Rica (%)
Place of birth for the foreign-born population - El Salvador (%)
Place of birth for the foreign-born population - Guatemala (%)
Place of birth for the foreign-born population - Honduras (%)
Place of birth for the foreign-born population - Mexico (%)
Place of birth for the foreign-born population - Nicaragua (%)
Place of birth for the foreign-born population - Panama (%)
Place of birth for the foreign-born population - Other Central America (%)
Place of birth for the foreign-born population - Argentina (%)
Place of birth for the foreign-born population - Bolivia (%)
Place of birth for the foreign-born population - Brazil (%)
Place of birth for the foreign-born population - Chile (%)
Place of birth for the foreign-born population - Colombia (%)
Place of birth for the foreign-born population - Ecuador (%)
Place of birth for the foreign-born population - Guyana (%)
Place of birth for the foreign-born population - Peru (%)
Place of birth for the foreign-born population - Uruguay (%)
Place of birth for the foreign-born population - Venezuela (%)
Place of birth for the foreign-born population - Other South America (%)
Place of birth for the foreign-born population - Canada (%)
Place of birth for the foreign-born population - Other Northern America (%)
Place of birth for the foreign-born population - Other (%)
Latest news about races in Passaic, NJ collected exclusively by city-data.com from local newspapers, TV, and radio stations
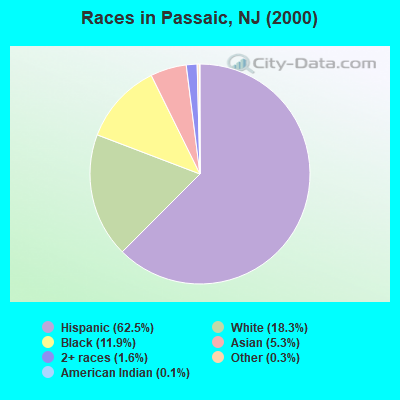
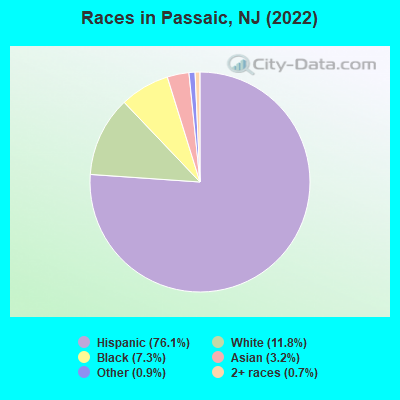
According to 2022 data, the most numerous races in Passaic, NJ are White alone (8,150 residents), Hispanic (52,593 residents), and Black alone (5,045 residents). 25.7% of Passaic residents speak English at home. 43.5% of Passaic, NJ residents are foreign-born (37.7% born in Latin America), which is 47.1% greater than the foreign-born rate of 23.0% across the entire state of New Jersey.
Race distribution in Passaic
2000 2022
5,557,209 66.0% White alone 1,117,191 13.3% Hispanic 1,096,171 13.0% Black alone 477,012 5.7% Asian alone 133,689 1.6% Two or more races 19,565 0.2% Other race alone 11,338 0.1% American Indian alone 2,175 0.03% Native Hawaiian and Other
4,766,476 51.5% White alone 2,028,470 21.9% Hispanic 1,111,632 12.0% Black alone 923,546 10.0% Asian alone 332,237 3.6% Two or more races 89,847 1.0% Other race alone 8,557 0.09% American Indian alone 934 0.01% Native Hawaiian and Other
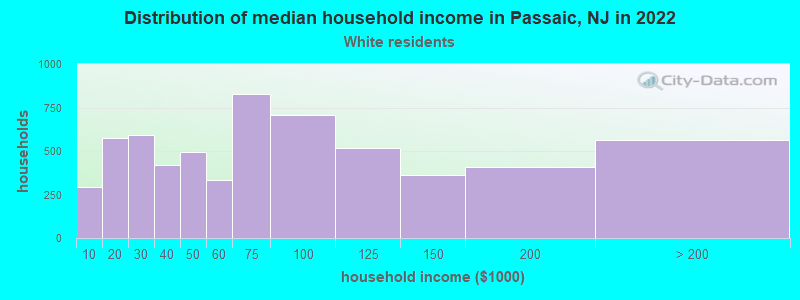
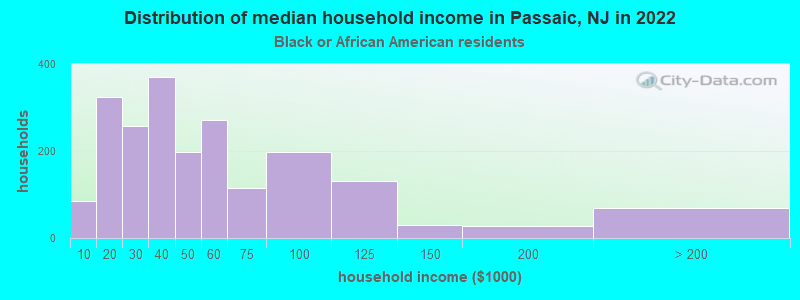
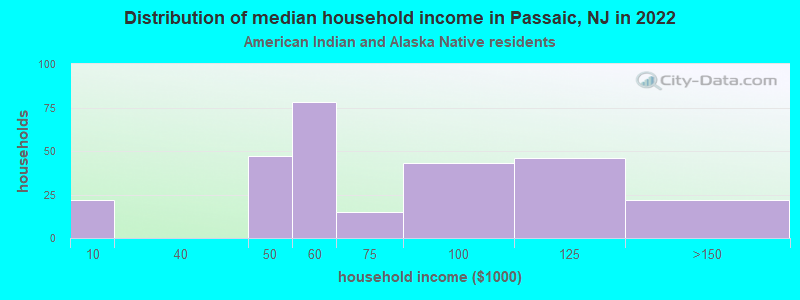
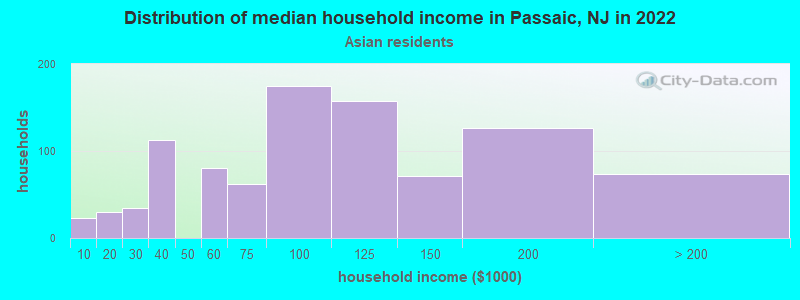
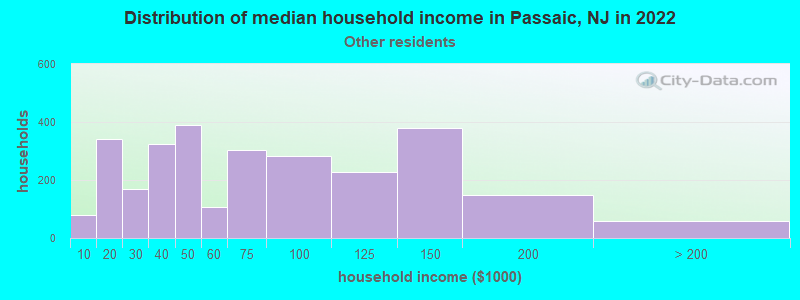
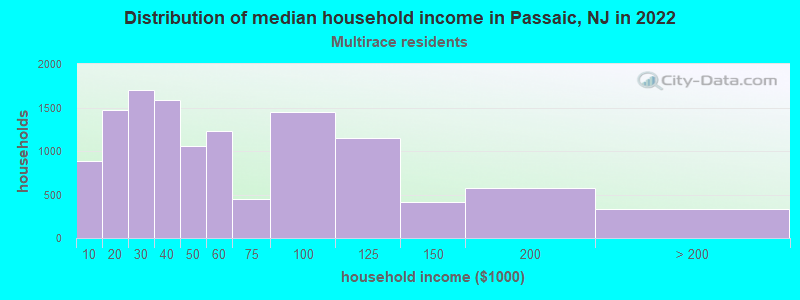
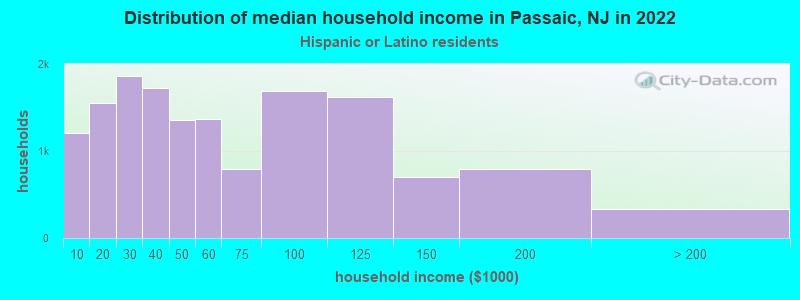
Income and house value in Passaic Median household income in 2022 $125,262 White non-Hispanic householders$36,166 Black householders$102,773 American Indian and Alaska Native householders$82,893 Asian householders$68,431 Some other race householders$44,438 Two or more races householders$49,049 Hispanic or Latino race householdersMedian 2022 house value $435,348 White Non-Hispanic householders$343,667 Black or African American householders $436,152 Asian householders$397,818 Some other race householders$402,107 Two or more races householders$385,754 Hispanic or Latino householders
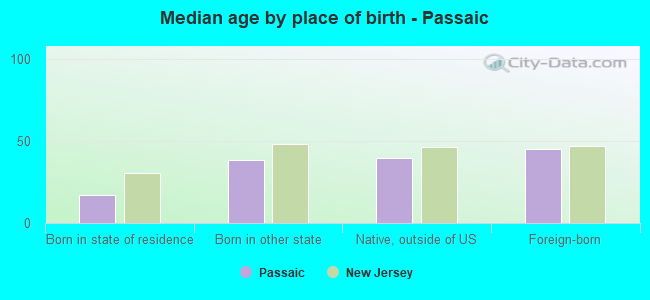
Median age by race in Passaic
22.7 Median age for White residents22.5 22.8 44.1 Median age for Black or African American residents32.9 55.4 24.2 Median age for American Indian / Alaska Native residents50.3 23.6 49.6 Median age for Asian residents38.7 59.6 -666,666,666.0 Median age for Native Hawaiian / Pacific Islander residents-666,666,666.0 -666,666,666.0 31.7 Median age for Other race residents31.1 34.4 31.7 Median age for Two or more races residents30.7 32.6 22.5 Median age for White alone residents20.9 22.7 31.6 Median age for Hispanic or Latino residents30.8 33.1
Owner/renter occupied households by race in Passaic
House owners and renters - White residents 1,343 57.5% Owner occupied992 42.5% Renter occupiedHouse owners and renters - Black or African American residents 487 23.0% Owner occupied1,632 77.0% Renter occupiedHouse owners and renters - American Indian / Alaska Native residents 40 21.9% Owner occupied143 78.1% Renter occupiedHouse owners and renters - Asian residents 182 20.3% Owner occupied716 79.7% Renter occupiedHouse owners and renters - Native Hawaiian / Pacific Islander residents 11 100.0% Renter occupiedHouse owners and renters - Other race residents 757 30.8% Owner occupied1,699 69.2% Renter occupiedHouse owners and renters - Two or more races residents 1,542 12.5% Owner occupied10,775 87.5% Renter occupiedHouse owners and renters - White alone residents 1,287 63.3% Owner occupied745 36.7% Renter occupiedHouse owners and renters - Hispanic or Latino residents 2,400 16.0% Owner occupied12,581 84.0% Renter occupied
Language usage in Passaic
English speakers - Total 25.7% of residents of Passaic speak English at home.
70.3% of residents speak Spanish at home 20,172 44.5% Speak English very well25,199 55.5% Speak English less than very well4.0% of residents speak other language at home 1,071 41.7% Speak English very well1,495 58.3% Speak English less than very well
English speakers - Born in the United States 68.8% of residents of Passaic speak English at home.
28.1% of residents speak Spanish at home 1,446 78.1% Speak English very well406 21.9% Speak English less than very well3.1% of residents speak other language at home 91 44.0% Speak English very well116 56.0% Speak English less than very well
English speakers - Native, born elsewhere 27.5% of residents of Passaic speak English at home.
72.5% of residents speak Spanish at home 650 42.8% Speak English very well867 57.2% Speak English less than very well
English speakers - Foreign-born 3.1% of residents of Passaic speak English at home.
90.4% of residents speak Spanish at home 5,234 18.6% Speak English very well22,906 81.4% Speak English less than very well6.5% of residents speak other language at home 760 37.3% Speak English very well1,276 62.7% Speak English less than very well
White (Caucasian) - Speak only English Native:
95.2% (6,653)Foreign-born:
17.9% (175)
White (Caucasian) - Speak another language Native:
4.8% (336)Foreign-born:
82.1% (804)
Black or African American - Speak only English Native:
97.7% (4,019)Foreign-born:
28.1% (117)
Black or African American - Speak another language Native:
2.4% (97)Foreign-born:
81.6% (340)
American Indian / Alaska Native - Speak only English Native:
30.1% (168)Foreign-born:
30.4% (105)
American Indian / Alaska Native - Speak another language Native:
76.8% (429)Foreign-born:
74.2% (257)
Asian - Speak only English Native:
51.5% (393)Foreign-born:
6.0% (110)
Asian - Speak another language Native:
47.0% (359)Foreign-born:
94.5% (1,730)
Other race - Speak only English Native:
27.4% (1,137)Foreign-born:
4.0% (204)
Other race - Speak another language Native:
72.6% (3,007)Foreign-born:
96.0% (4,928)
Two or more races - Speak only English Native:
15.7% (2,603)Foreign-born:
1.3% (294)
Two or more races - Speak another language Native:
84.3% (13,925)Foreign-born:
98.7% (22,445)
White alone - Speak only English Native:
91.6% (7,046)Foreign-born:
24.2% (267)
White alone - Speak another language Native:
8.2% (631)Foreign-born:
70.4% (778)
Hispanic or Latino - Speak only English Native:
15.8% (3,259)Foreign-born:
1.6% (448)
Hispanic or Latino - Speak another language Native:
84.2% (17,313)Foreign-born:
98.4% (28,140)
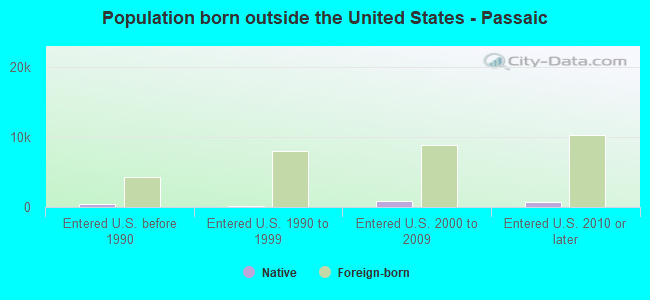
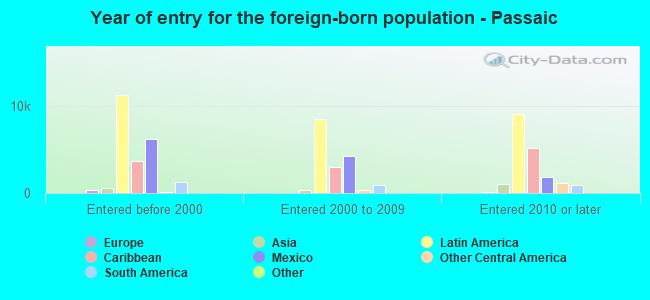
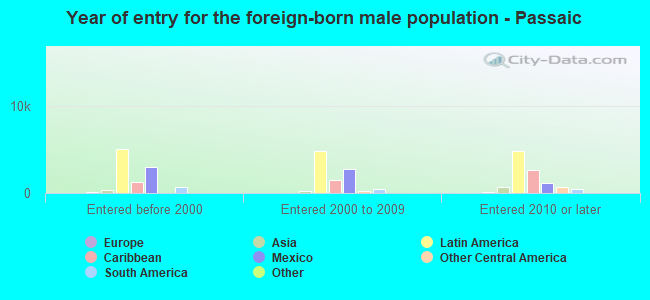
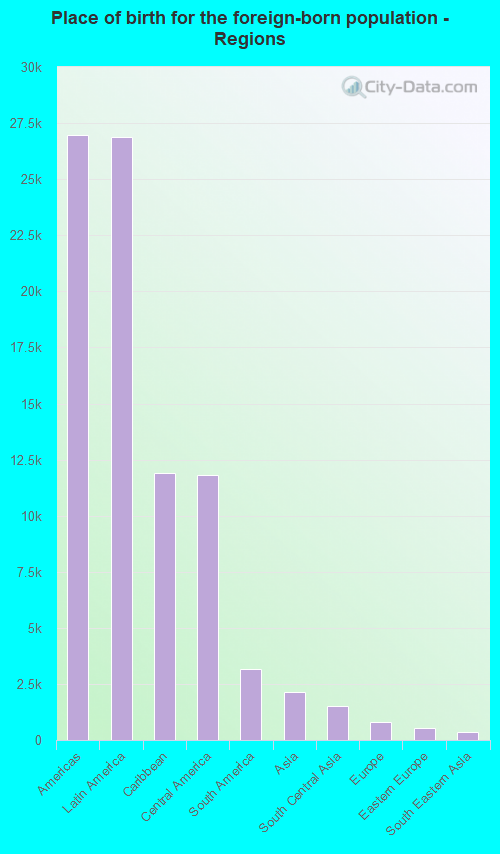
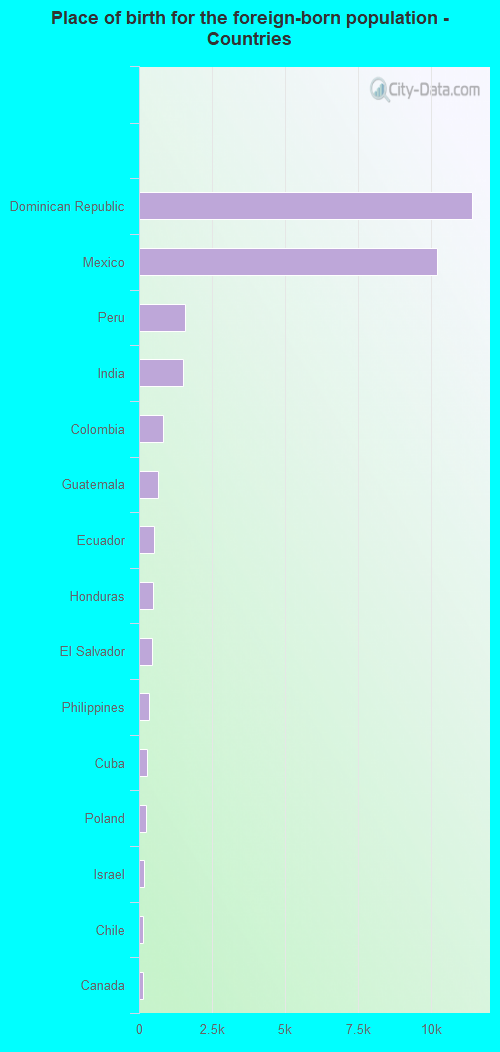
Foreign-born residents in Passaic 30,084 residents are foreign born (37.7% Latin America ).
This city:
43.5%New Jersey:
23.2%
Marital status for residents in Passaic Marital status - White (Caucasian) population 15 years and over
Males 33.1% Never married53.8% Now married1.6% Separated3.3% Widowed8.2% DivorcedFemales 45.1% Never married40.2% Now married1.7% Separated11.9% Widowed1.1% DivorcedWomen who gave birth in the past 12 months Now married:
100.0% (93)Unmarried:
0.0% (0)
Women who did not give birth in the past 12 months Now married:
30.0% (514)Unmarried:
70.0% (1,202)
Marital status - Black or African American population 15 years and over
Males 69.5% Never married19.4% Now married0.0% Separated0.0% Widowed11.1% DivorcedFemales 60.4% Never married13.8% Now married0.0% Separated10.7% Widowed15.1% DivorcedWomen who gave birth in the past 12 months Now married:
6.6% (4)Unmarried:
93.4% (54)
Women who did not give birth in the past 12 months Now married:
10.4% (114)Unmarried:
89.6% (986)
Marital status - American Indian / Alaska Native population 15 years and over
Males 31.9% Never married52.1% Now married0.0% Separated0.0% Widowed16.0% DivorcedFemales 62.4% Never married25.8% Now married6.3% Separated0.0% Widowed5.4% DivorcedWomen who did not give birth in the past 12 months Now married:
27.8% (76)Unmarried:
72.2% (196)
Marital status - Asian population 15 years and over
Males 35.7% Never married60.5% Now married0.9% Separated1.8% Widowed1.1% DivorcedFemales 31.4% Never married49.9% Now married0.3% Separated12.4% Widowed6.0% DivorcedWomen who gave birth in the past 12 months Now married:
100.0% (15)Unmarried:
0.0% (0)
Women who did not give birth in the past 12 months Now married:
52.8% (314)Unmarried:
47.2% (281)
Marital status - Other race population 15 years and over
Males 53.3% Never married38.9% Now married0.0% Separated2.4% Widowed5.5% DivorcedFemales 42.1% Never married35.7% Now married4.0% Separated6.0% Widowed12.2% DivorcedWomen who gave birth in the past 12 months Now married:
25.8% (33)Unmarried:
74.2% (95)
Women who did not give birth in the past 12 months Now married:
38.5% (1,032)Unmarried:
61.5% (1,651)
Marital status - Two or more races population 15 years and over
Males 61.3% Never married28.8% Now married2.8% Separated1.6% Widowed5.4% DivorcedFemales 53.7% Never married23.6% Now married6.9% Separated5.2% Widowed10.7% DivorcedWomen who gave birth in the past 12 months Now married:
76.4% (516)Unmarried:
23.6% (159)
Women who did not give birth in the past 12 months Now married:
18.8% (2,008)Unmarried:
81.2% (8,693)
Marital status - White alone, not Hispanic / Latino population 15 years and over
Males 30.7% Never married56.2% Now married1.8% Separated2.0% Widowed9.3% DivorcedFemales 42.0% Never married43.1% Now married1.9% Separated11.8% Widowed1.2% DivorcedWomen who gave birth in the past 12 months Now married:
100.0% (93)Unmarried:
0.0% (0)
Women who did not give birth in the past 12 months Now married:
32.5% (514)Unmarried:
67.5% (1,068)
Marital status - Hispanic or Latino population 15 years and over
Males 60.1% Never married30.4% Now married2.2% Separated2.0% Widowed5.3% DivorcedFemales 52.1% Never married25.7% Now married6.2% Separated5.0% Widowed11.1% DivorcedWomen who gave birth in the past 12 months Now married:
76.4% (516)Unmarried:
23.6% (159)
Women who did not give birth in the past 12 months Now married:
22.2% (3,008)Unmarried:
77.8% (10,560)
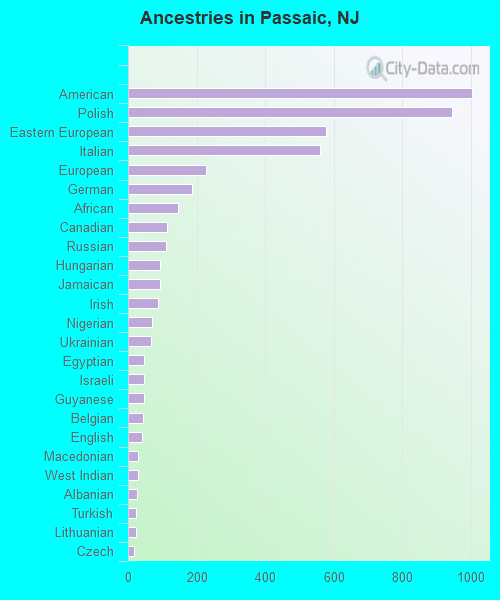
Ancestries in Passaic
1,003 1.8% American945 1.7% Polish577 1.1% Eastern European561 1.0% Italian229 0.4% European188 0.3% German146 0.3% African113 0.2% Canadian112 0.2% Russian92 0.2% Hungarian92 0.2% Jamaican88 0.2% Irish70 0.1% Nigerian67 0.1% Ukrainian48 0.09% Egyptian48 0.09% Israeli48 0.09% Guyanese44 0.08% Belgian40 0.07% English30 0.05% Macedonian29 0.05% West Indian25 0.05% Albanian23 0.04% Turkish22 0.04% Lithuanian17 0.03% Czech17 0.03% Austrian17 0.03% Haitian16 0.03% Romanian15 0.03% Trinidadian and Tobagonian11 0.02% Scotch-Irish10 0.02% French Canadian8 0.01% Moroccan7 0.01% Yugoslavian6 0.01% British5 0.01% Syrian4 0.01% Greek
Geographical mobility in Passaic Same house 1 year ago 18,730 94.9% White (Caucasian)4,434 92.6% Black or African American888 94.8% American Indian / Alaska Native2,844 99.8% Asian10 100.0% Native Hawaiian / Pacific Islander9,128 89.7% Other race40,013 95.2% Two or more races9,145 96.4% White alone, not Hispanic / Latino50,127 95.7% Hispanic or LatinoMoved within same county 1,205 6.1% White / Caucasian212 4.4% Black or African American26 2.7% American Indian / Alaska Native16 0.5% Asian500 4.9% Other race1,152 2.7% Two or more races239 2.5% White alone, not Hispanic / Latino1,358 2.6% Hispanic or LatinoMoved within same state 120 0.6% White / Caucasian19 0.4% Black or African American64 0.6% Other race43 0.1% Two or more races68 0.7% White alone, not Hispanic / Latino43 0.1% Hispanic or LatinoMoved from different state 72 0.4% White / Caucasian15 0.3% Black or African American33 1.2% Asian50 0.5% Other race37 0.4% White alone, not Hispanic / LatinoMoved from abroad 167 0.8% White55 1.2% Black or African American364 3.6% Other race832 2.0% Two or more races24 0.3% White alone, not Hispanic / Latino876 1.7% Hispanic or Latino
Children Nativity (place of birth) in Passaic
Children under 6 years - Living with two parents Both parents native 1,095 100.0% NativeBoth parents foreign-born 827 93.1% Native61 6.9% Foreign-bornOne native, one foreign-born parent 332 100.0% NativeChildren under 6 years - Living with one parent Native parent 1,626 100.0% NativeForeign-born parent 1,113 76.3% Native345 23.7% Foreign-bornChildren 6 to 17 years - Living with two parents Both parents native 2,642 100.0% NativeBoth parents foreign-born 2,125 85.9% Native348 14.1% Foreign-bornOne native, one foreign-born parent 526 100.0% NativeChildren 6 to 17 years - Living with one parent Native parent 738 100.0% NativeForeign-born parent 5,630 60.1% Native3,745 39.9% Foreign-born
Place of birth for residents in Passaic 26,985 Americas26,864 Latin America11,904 Caribbean11,814 Central America3,145 South America2,126 Asia1,527 South Central Asia797 Europe556 Eastern Europe345 South Eastern Asia202 Western Asia174 Africa120 Northern America115 Southern Europe63 Western Europe62 Northern Europe58 Northern Africa53 Southern Africa51 Eastern Asia51 China41 Western Africa11,419 Dominican Republic10,205 Mexico1,576 Peru1,510 India820 Colombia644 Guatemala499 Ecuador480 Honduras429 El Salvador345 Philippines259 Cuba247 Poland159 Israel134 Chile120 Canada101 Trinidad and Tobago92 Italy76 Jamaica75 Guyana73 Ukraine72 North Macedonia (Macedonia)56 Germany56 Russia53 South Africa51 China48 Egypt43 Costa Rica39 England36 Argentina35 Haiti31 Nigeria22 Turkey19 Spain17 Czechoslovakia16 Iran15 Hungary13 Albania13 Latvia12 Dominica11 United Kingdom11 Ireland10 Kuwait10 Syria10 Morocco10 Ghana10 Panama6 Romania6 Belgium6 Lithuania4 Greece3 Bolivia
Grandparents responsible for own grandchildren in Passaic
Grandparents (30 to 59 years) White / Caucasian 84 49.4% Responsible for grandchildren85 50.6% Not responsible for grandchildrenBlack or African American 23 42.6% Responsible for grandchildren31 57.4% Not responsible for grandchildrenAmerican Indian / Alaska Native 22 100.0% Responsible for grandchildrenOther race 114 41.1% Responsible for grandchildren164 58.9% Not responsible for grandchildrenTwo or more races 227 37.2% Responsible for grandchildren383 62.8% Not responsible for grandchildrenWhite alone, not Hispanic / Latino 5 100.0% Not responsible for grandchildrenHispanic or Latino 492 52.3% Responsible for grandchildren448 47.7% Not responsible for grandchildrenGrandparents (60 years and over) White / Caucasian 49 20.8% Responsible for grandchildren185 79.2% Not responsible for grandchildrenBlack or African American 81 88.8% Responsible for grandchildren10 11.2% Not responsible for grandchildrenOther race 80 100.0% Not responsible for grandchildrenTwo or more races 14 3.1% Responsible for grandchildren433 96.9% Not responsible for grandchildrenWhite alone, not Hispanic / Latino 6 100.0% Not responsible for grandchildrenHispanic or Latino 840 100.0% Not responsible for grandchildren