Races in Pearl River, New York (NY) Detailed Stats
Data:
Races - White alone (%)
Races - White alone (% change since 2000)
Races - Black alone (%)
Races - Black alone (% change since 2000)
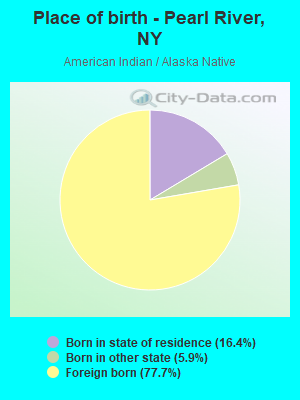
Races - American Indian alone (%)
Races - American Indian alone (% change since 2000)
Races - Asian alone (%)
Races - Asian alone (% change since 2000)
Races - Hispanic (%)
Races - Hispanic (% change since 2000)
Races - Native Hawaiian and Other Pacific Islander alone (%)
Races - Native Hawaiian and Other Pacific Islander alone (% change since 2000)
Races - Two or more races(%)
Races - Two or more races(% change since 2000)
Races - Other race alone (%)
Races - Other race alone (% change since 2000)
Racial diversity
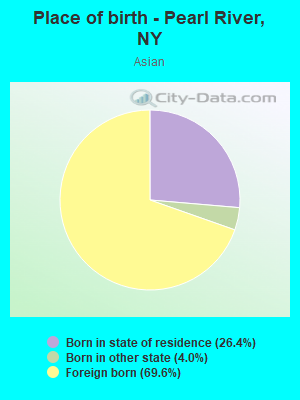
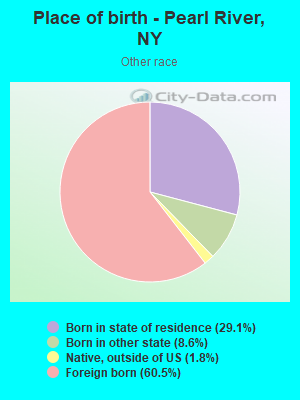
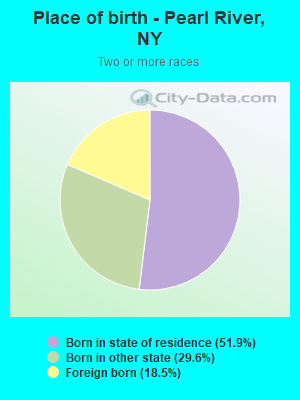
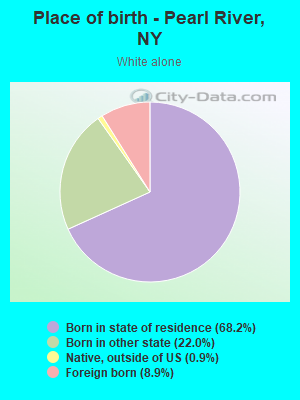
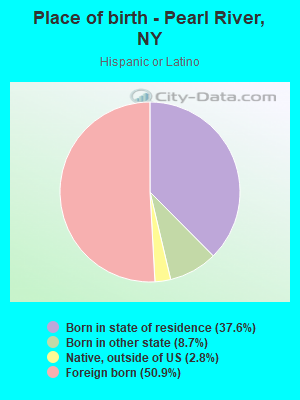
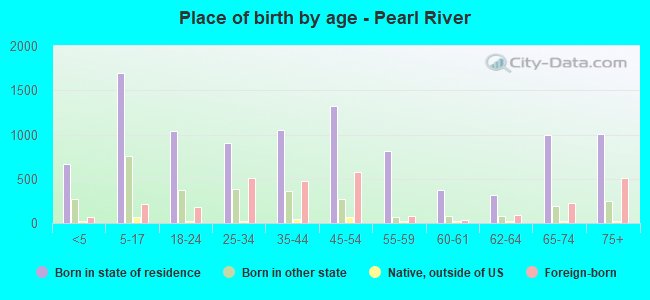
Place of birth - Born in state of residence (%)
Place of birth - Born in state of residence (%) - White
Place of birth - Born in state of residence (%) - Black or African American
Place of birth - Born in state of residence (%) - Asian
Place of birth - Born in state of residence (%) - Hispanic or Latino
Place of birth - Born in state of residence (%) - American Indian and Alaska Native
Place of birth - Born in state of residence (%) - Multirace
Place of birth - Born in state of residence (%) - Other Race
Place of birth - Born in other state (%)
Place of birth - Born in other state (%) - White
Place of birth - Born in other state (%) - Black or African American
Place of birth - Born in other state (%) - Asian
Place of birth - Born in other state (%) - Hispanic or Latino
Place of birth - Born in other state (%) - American Indian and Alaska Native
Place of birth - Born in other state (%) - Multirace
Place of birth - Born in other state (%) - Other Race
Place of birth - Native, outside of US (%)
Place of birth - Native, outside of US (%) - White
Place of birth - Native, outside of US (%) - Black or African American
Place of birth - Native, outside of US (%) - Asian
Place of birth - Native, outside of US (%) - Hispanic or Latino
Place of birth - Native, outside of US (%) - American Indian and Alaska Native
Place of birth - Native, outside of US (%) - Multirace
Place of birth - Native, outside of US (%) - Other Race
Place of birth - Foreign born (%)
Place of birth - Foreign born (%) - White
Place of birth - Foreign born (%) - Black or African American
Place of birth - Foreign born (%) - Asian
Place of birth - Foreign born (%) - Hispanic or Latino
Place of birth - Foreign born (%) - American Indian and Alaska Native
Place of birth - Foreign born (%) - Multirace
Place of birth - Foreign born (%) - Other Race
Residents speaking English at home (%)
Residents speaking English at home - Born in the United States (%)
Residents speaking English at home - Native, born elsewhere (%)
Residents speaking English at home - Foreign born (%)
Residents speaking Spanish at home (%)
Residents speaking Spanish at home - Born in the United States (%)
Residents speaking Spanish at home - Native, born elsewhere (%)
Residents speaking Spanish at home - Foreign born (%)
Residents speaking other language at home (%)
Residents speaking other language at home - Born in the United States (%)
Residents speaking other language at home - Native, born elsewhere (%)
Residents speaking other language at home - Foreign born (%)
Marital status - Never married (%)
Marital status - Now married (%)
Marital status - Separated (%)
Marital status - Widowed (%)
Marital status - Divorced (%)
Ancestries Reported - Arab (%)
Ancestries Reported - Czech (%)
Ancestries Reported - Danish (%)
Ancestries Reported - Dutch (%)
Ancestries Reported - English (%)
Ancestries Reported - French (%)
Ancestries Reported - French Canadian (%)
Ancestries Reported - German (%)
Ancestries Reported - Greek (%)
Ancestries Reported - Hungarian (%)
Ancestries Reported - Irish (%)
Ancestries Reported - Italian (%)
Ancestries Reported - Lithuanian (%)
Ancestries Reported - Norwegian (%)
Ancestries Reported - Polish (%)
Ancestries Reported - Portuguese (%)
Ancestries Reported - Russian (%)
Ancestries Reported - Scotch-Irish (%)
Ancestries Reported - Scottish (%)
Ancestries Reported - Slovak (%)
Ancestries Reported - Subsaharan African (%)
Ancestries Reported - Swedish (%)
Ancestries Reported - Swiss (%)
Ancestries Reported - Ukrainian (%)
Ancestries Reported - United States (%)
Ancestries Reported - Welsh (%)
Ancestries Reported - West Indian (%)
Ancestries Reported - Other (%)
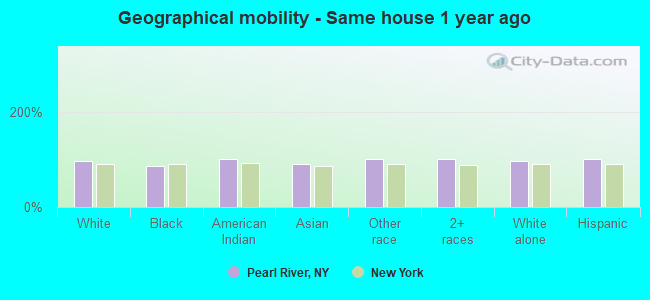
Geographical mobility - Same house 1 year ago (%)
Geographical mobility - Same house 1 year ago (%) - White
Geographical mobility - Same house 1 year ago (%) - Black or African American
Geographical mobility - Same house 1 year ago (%) - Asian
Geographical mobility - Same house 1 year ago (%) - Hispanic or Latino
Geographical mobility - Same house 1 year ago (%) - American Indian and Alaska Native
Geographical mobility - Same house 1 year ago (%) - Multirace
Geographical mobility - Same house 1 year ago (%) - Other Race
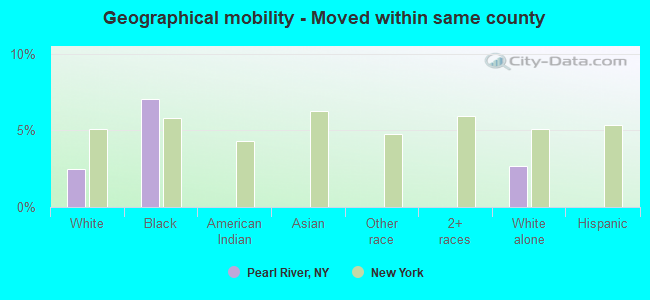
Geographical mobility - Moved within same county (%)
Geographical mobility - Moved within same county (%) - White
Geographical mobility - Moved within same county (%) - Black or African American
Geographical mobility - Moved within same county (%) - Asian
Geographical mobility - Moved within same county (%) - Hispanic or Latino
Geographical mobility - Moved within same county (%) - American Indian and Alaska Native
Geographical mobility - Moved within same county (%) - Multirace
Geographical mobility - Moved within same county (%) - Other Race
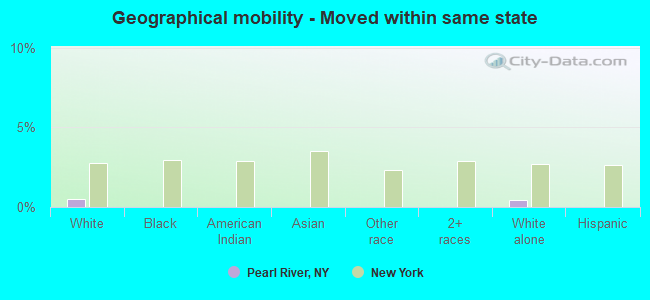
Geographical mobility - Moved from different county within same state (%)
Geographical mobility - Moved from different county within same state (%) - White
Geographical mobility - Moved from different county within same state (%) - Black or African American
Geographical mobility - Moved from different county within same state (%) - Asian
Geographical mobility - Moved from different county within same state (%) - Hispanic or Latino
Geographical mobility - Moved from different county within same state (%) - American Indian and Alaska Native
Geographical mobility - Moved from different county within same state (%) - Multirace
Geographical mobility - Moved from different county within same state (%) - Other Race
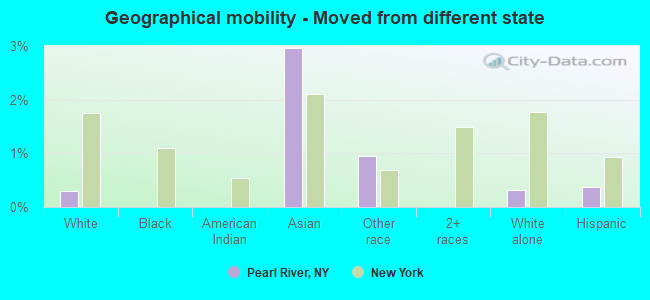
Geographical mobility - Moved from different state (%)
Geographical mobility - Moved from different state (%) - White
Geographical mobility - Moved from different state (%) - Black or African American
Geographical mobility - Moved from different state (%) - Asian
Geographical mobility - Moved from different state (%) - Hispanic or Latino
Geographical mobility - Moved from different state (%) - American Indian and Alaska Native
Geographical mobility - Moved from different state (%) - Multirace
Geographical mobility - Moved from different state (%) - Other Race
Geographical mobility - Moved from abroad (%)
Geographical mobility - Moved from abroad (%) - White
Geographical mobility - Moved from abroad (%) - Black or African American
Geographical mobility - Moved from abroad (%) - Asian
Geographical mobility - Moved from abroad (%) - Hispanic or Latino
Geographical mobility - Moved from abroad (%) - American Indian and Alaska Native
Geographical mobility - Moved from abroad (%) - Multirace
Geographical mobility - Moved from abroad (%) - Other Race
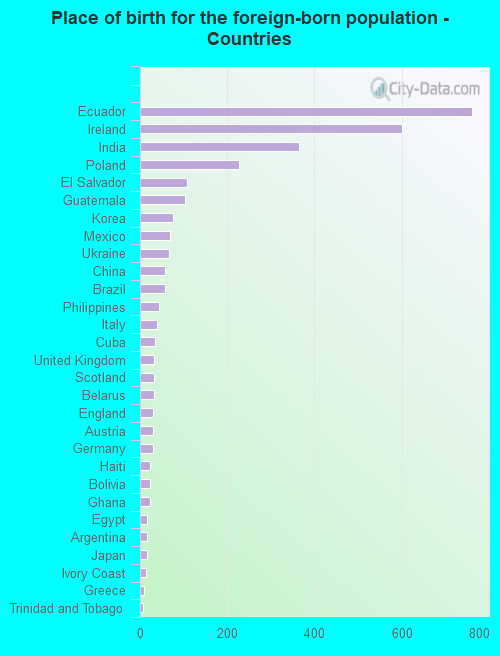
Place of birth for the foreign-born population - Ireland (%)
Place of birth for the foreign-born population - Denmark (%)
Place of birth for the foreign-born population - Norway (%)
Place of birth for the foreign-born population - Sweden (%)
Place of birth for the foreign-born population - United Kingdom (%)
Place of birth for the foreign-born population - England (%)
Place of birth for the foreign-born population - Scotland (%)
Place of birth for the foreign-born population - Other Northern Europe (%)
Place of birth for the foreign-born population - Austria (%)
Place of birth for the foreign-born population - Belgium (%)
Place of birth for the foreign-born population - France (%)
Place of birth for the foreign-born population - Germany (%)
Place of birth for the foreign-born population - Netherlands (%)
Place of birth for the foreign-born population - Switzerland (%)
Place of birth for the foreign-born population - Other Western Europe (%)
Place of birth for the foreign-born population - Greece (%)
Place of birth for the foreign-born population - Italy (%)
Place of birth for the foreign-born population - Portugal (%)
Place of birth for the foreign-born population - Spain (%)
Place of birth for the foreign-born population - Other Southern Europe (%)
Place of birth for the foreign-born population - Albania (%)
Place of birth for the foreign-born population - Belarus (%)
Place of birth for the foreign-born population - Bosnia and Herzegovina (%)
Place of birth for the foreign-born population - Bulgaria (%)
Place of birth for the foreign-born population - Croatia (%)
Place of birth for the foreign-born population - Czechoslovakia (%)
Place of birth for the foreign-born population - Hungary (%)
Place of birth for the foreign-born population - Latvia (%)
Place of birth for the foreign-born population - Lithuania (%)
Place of birth for the foreign-born population - North Macedonia (Macedonia) (%)
Place of birth for the foreign-born population - Moldova (%)
Place of birth for the foreign-born population - Poland (%)
Place of birth for the foreign-born population - Romania (%)
Place of birth for the foreign-born population - Russia (%)
Place of birth for the foreign-born population - Serbia (%)
Place of birth for the foreign-born population - Ukraine (%)
Place of birth for the foreign-born population - Other Eastern Europe (%)
Place of birth for the foreign-born population - China (%)
Place of birth for the foreign-born population - Hong Kong (%)
Place of birth for the foreign-born population - Taiwan (%)
Place of birth for the foreign-born population - Japan (%)
Place of birth for the foreign-born population - Korea (%)
Place of birth for the foreign-born population - Other Eastern Asia (%)
Place of birth for the foreign-born population - Afghanistan (%)
Place of birth for the foreign-born population - Bangladesh (%)
Place of birth for the foreign-born population - India (%)
Place of birth for the foreign-born population - Iran (%)
Place of birth for the foreign-born population - Kazakhstan (%)
Place of birth for the foreign-born population - Nepal (%)
Place of birth for the foreign-born population - Pakistan (%)
Place of birth for the foreign-born population - Sri Lanka (%)
Place of birth for the foreign-born population - Uzbekistan (%)
Place of birth for the foreign-born population - Other South Central Asia (%)
Place of birth for the foreign-born population - Burma (%)
Place of birth for the foreign-born population - Cambodia (%)
Place of birth for the foreign-born population - Indonesia (%)
Place of birth for the foreign-born population - Laos (%)
Place of birth for the foreign-born population - Malaysia (%)
Place of birth for the foreign-born population - Philippines (%)
Place of birth for the foreign-born population - Singapore (%)
Place of birth for the foreign-born population - Thailand (%)
Place of birth for the foreign-born population - Vietnam (%)
Place of birth for the foreign-born population - Other South Eastern Asia (%)
Place of birth for the foreign-born population - Armenia (%)
Place of birth for the foreign-born population - Iraq (%)
Place of birth for the foreign-born population - Israel (%)
Place of birth for the foreign-born population - Jordan (%)
Place of birth for the foreign-born population - Kuwait (%)
Place of birth for the foreign-born population - Lebanon (%)
Place of birth for the foreign-born population - Saudi Arabia (%)
Place of birth for the foreign-born population - Syria (%)
Place of birth for the foreign-born population - Turkey (%)
Place of birth for the foreign-born population - Yemen (%)
Place of birth for the foreign-born population - Other Western Asia (%)
Place of birth for the foreign-born population - Eritrea (%)
Place of birth for the foreign-born population - Ethiopia (%)
Place of birth for the foreign-born population - Kenya (%)
Place of birth for the foreign-born population - Somalia (%)
Place of birth for the foreign-born population - Uganda (%)
Place of birth for the foreign-born population - Zimbabwe (%)
Place of birth for the foreign-born population - Other Eastern Africa (%)
Place of birth for the foreign-born population - Cameroon (%)
Place of birth for the foreign-born population - Congo (%)
Place of birth for the foreign-born population - Democratic Republic of Congo (Zaire) (%)
Place of birth for the foreign-born population - Other Middle Africa (%)
Place of birth for the foreign-born population - Egypt (%)
Place of birth for the foreign-born population - Morocco (%)
Place of birth for the foreign-born population - Sudan (%)
Place of birth for the foreign-born population - Other Northern Africa (%)
Place of birth for the foreign-born population - South Africa (%)
Place of birth for the foreign-born population - Other Southern Africa (%)
Place of birth for the foreign-born population - Cabo Verde (%)
Place of birth for the foreign-born population - Ghana (%)
Place of birth for the foreign-born population - Liberia (%)
Place of birth for the foreign-born population - Nigeria (%)
Place of birth for the foreign-born population - Senegal (%)
Place of birth for the foreign-born population - Sierra Leone (%)
Place of birth for the foreign-born population - Other Western Africa (%)
Place of birth for the foreign-born population - Australia (%)
Place of birth for the foreign-born population - New Zealand (%)
Place of birth for the foreign-born population - Fiji (%)
Place of birth for the foreign-born population - Micronesia (%)
Place of birth for the foreign-born population - Bahamas (%)
Place of birth for the foreign-born population - Barbados (%)
Place of birth for the foreign-born population - Cuba (%)
Place of birth for the foreign-born population - Dominica (%)
Place of birth for the foreign-born population - Dominican Republic (%)
Place of birth for the foreign-born population - Grenada (%)
Place of birth for the foreign-born population - Haiti (%)
Place of birth for the foreign-born population - Jamaica (%)
Place of birth for the foreign-born population - St. Vincent and the Grenadines (%)
Place of birth for the foreign-born population - Trinidad and Tobago (%)
Place of birth for the foreign-born population - West Indies (%)
Place of birth for the foreign-born population - Other Caribbean (%)
Place of birth for the foreign-born population - Belize (%)
Place of birth for the foreign-born population - Costa Rica (%)
Place of birth for the foreign-born population - El Salvador (%)
Place of birth for the foreign-born population - Guatemala (%)
Place of birth for the foreign-born population - Honduras (%)
Place of birth for the foreign-born population - Mexico (%)
Place of birth for the foreign-born population - Nicaragua (%)
Place of birth for the foreign-born population - Panama (%)
Place of birth for the foreign-born population - Other Central America (%)
Place of birth for the foreign-born population - Argentina (%)
Place of birth for the foreign-born population - Bolivia (%)
Place of birth for the foreign-born population - Brazil (%)
Place of birth for the foreign-born population - Chile (%)
Place of birth for the foreign-born population - Colombia (%)
Place of birth for the foreign-born population - Ecuador (%)
Place of birth for the foreign-born population - Guyana (%)
Place of birth for the foreign-born population - Peru (%)
Place of birth for the foreign-born population - Uruguay (%)
Place of birth for the foreign-born population - Venezuela (%)
Place of birth for the foreign-born population - Other South America (%)
Place of birth for the foreign-born population - Canada (%)
Place of birth for the foreign-born population - Other Northern America (%)
Place of birth for the foreign-born population - Other (%)
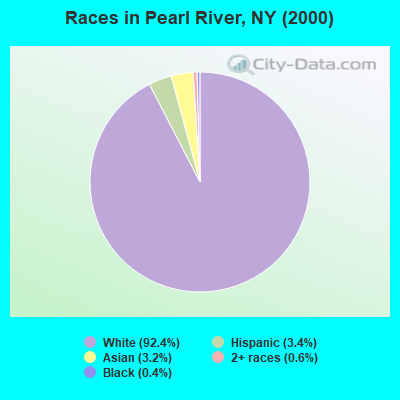
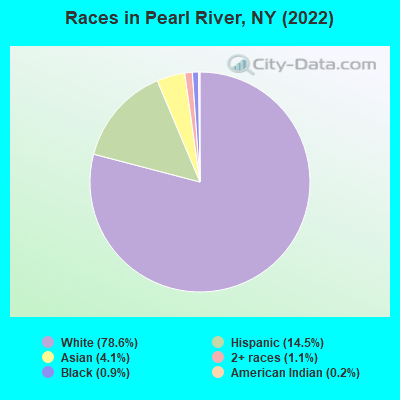
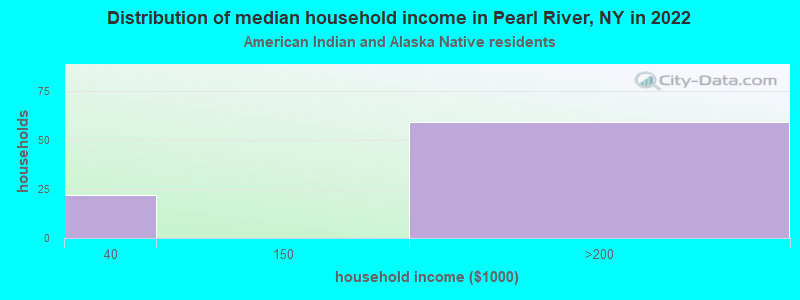
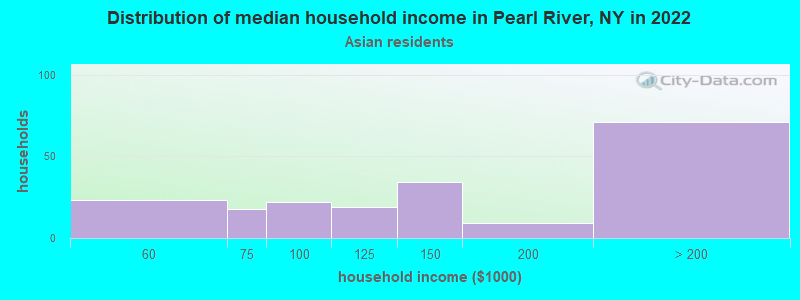
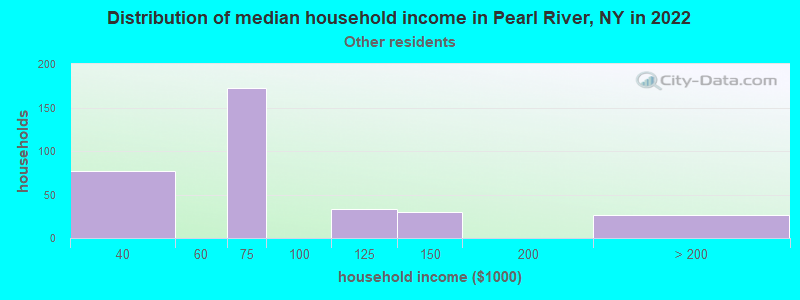
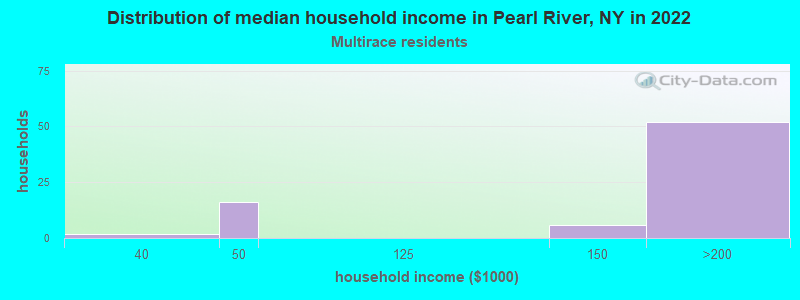
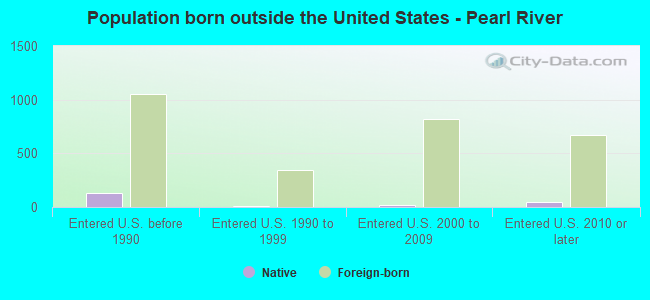
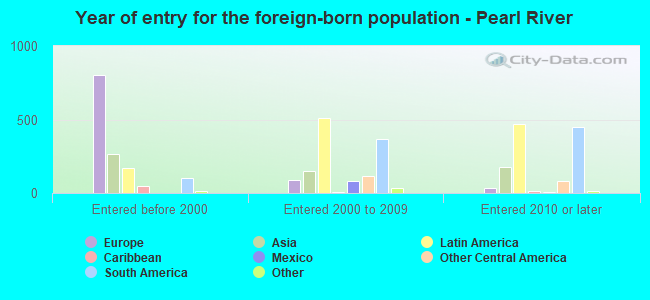
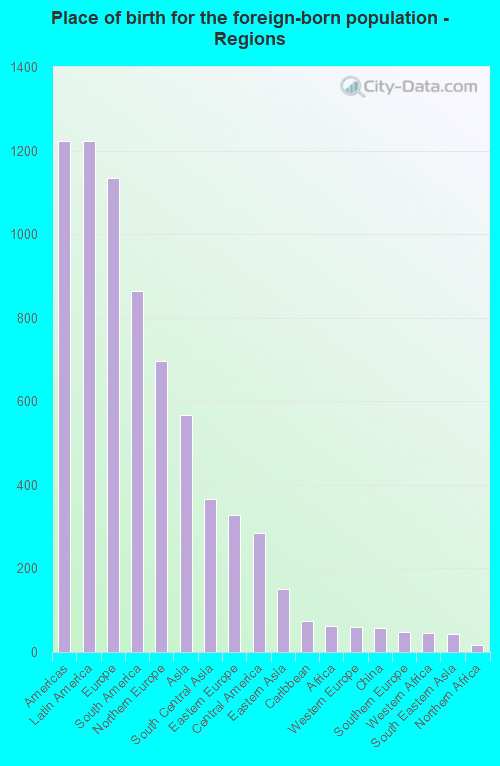
According to 2022 data, the most numerous races in Pearl River, NY are White alone (12,968 residents), Hispanic (2,393 residents), and Black alone (156 residents). 82.8% of Pearl River residents speak English at home. 18.1% of Pearl River, NY residents are foreign-born (7.5% born in Latin America, 7.0% born in Europe, 3.5% born in Asia), which is 21.5% less than the foreign-born rate of 22.0% across the entire state of New York.
Race distribution in Pearl River
2000 2022
11,760,981 62.0% White alone 2,867,583 15.1% Hispanic 2,812,623 14.8% Black alone 1,035,926 5.5% Asian alone 366,116 1.9% Two or more races 75,499 0.4% Other race alone 52,499 0.3% American Indian alone 5,230 0.03% Native Hawaiian and Other
10,408,933 52.9% White alone 3,867,299 19.7% Hispanic 2,633,840 13.4% Black alone 1,776,286 9.0% Asian alone 732,670 3.7% Two or more races 216,110 1.1% Other race alone 35,082 0.2% American Indian alone 6,931 0.04% Native Hawaiian and Other
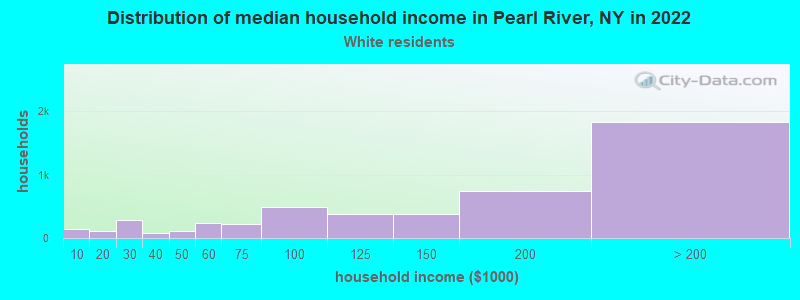
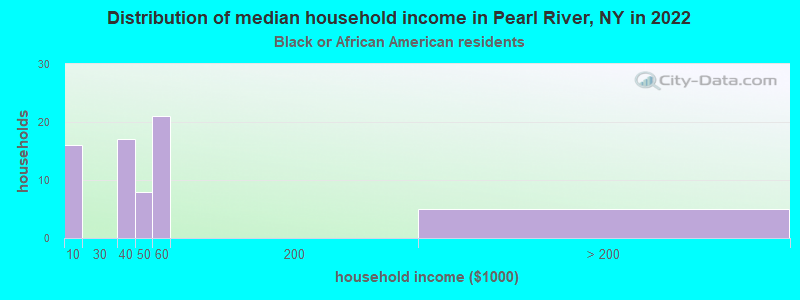
Income and house value in Pearl River Median household income in 2022 $144,136 White non-Hispanic householders$44,725 Black householders$116,409 Asian householders$64,232 Some other race householders$128,562 Two or more races householdersMedian 2022 house value $558,546 White Non-Hispanic householdersover $1,000,000 American Indian or Alaska Native householders $576,356 Asian householdersover $1,000,000 Some other race householders$640,024 Two or more races householders$701,244 Hispanic or Latino householders
Median age by race in Pearl River
42.7 Median age for White residents43.1 42.8 55.8 Median age for Black or African American residents56.5 50.6 70.1 Median age for American Indian / Alaska Native residents80.6 67.1 48.3 Median age for Asian residents49.3 50.2 -463,937,621.4 Median age for Native Hawaiian / Pacific Islander residents-649,572,648.9 -666,666,666.0 29.8 Median age for Other race residents14.4 31.7 31.2 Median age for Two or more races residents12.9 54.5 42.6 Median age for White alone residents42.9 42.8 31.5 Median age for Hispanic or Latino residents33.5 32.3
Owner/renter occupied households by race in Pearl River
House owners and renters - White residents 4,019 80.3% Owner occupied984 19.7% Renter occupiedHouse owners and renters - Black or African American residents 7 14.7% Owner occupied39 85.3% Renter occupiedHouse owners and renters - American Indian / Alaska Native residents 62 100.0% Renter occupiedHouse owners and renters - Asian residents 188 96.6% Owner occupied7 3.4% Renter occupiedHouse owners and renters - Other race residents 31 11.8% Owner occupied231 88.2% Renter occupiedHouse owners and renters - Two or more races residents 68 65.1% Owner occupied37 34.9% Renter occupiedHouse owners and renters - White alone residents 4,003 80.8% Owner occupied951 19.2% Renter occupiedHouse owners and renters - Hispanic or Latino residents 184 33.2% Owner occupied370 66.8% Renter occupied
Language usage in Pearl River
English speakers - Total 82.8% of residents of Pearl River speak English at home.
9.3% of residents speak Spanish at home 743 51.6% Speak English very well698 48.4% Speak English less than very well9.0% of residents speak other language at home 828 59.1% Speak English very well573 40.9% Speak English less than very well
English speakers - Born in the United States 98.4% of residents of Pearl River speak English at home.
3.9% of residents speak Spanish at home 24 21.4% Speak English very well88 78.6% Speak English less than very well2.0% of residents speak other language at home 58 100.0% Speak English very well
English speakers - Native, born elsewhere 77.4% of residents of Pearl River speak English at home.
17.4% of residents speak other language at home 34 100.0% Speak English very well
English speakers - Foreign-born 33.6% of residents of Pearl River speak English at home.
33.1% of residents speak Spanish at home 387 40.4% Speak English very well570 59.6% Speak English less than very well32.6% of residents speak other language at home 448 47.6% Speak English very well493 52.4% Speak English less than very well
White (Caucasian) - Speak only English Native:
97.3% (10,857)Foreign-born:
78.1% (790)
White (Caucasian) - Speak another language Native:
4.6% (517)Foreign-born:
32.2% (326)
Black or African American - Speak only English Native:
99.1% (68)Foreign-born:
41.5% (30)
Asian - Speak only English Native:
50.8% (78)Foreign-born:
23.9% (118)
Asian - Speak another language Native:
48.2% (74)Foreign-born:
78.2% (385)
Other race - Speak only English Native:
48.3% (284)Foreign-born:
0.5% (6)
Other race - Speak another language Native:
53.5% (314)Foreign-born:
100.0% (1,059)
Two or more races - Speak only English Native:
87.7% (222)Foreign-born:
44.6% (33)
Two or more races - Speak another language Native:
16.9% (43)Foreign-born:
63.6% (47)
White alone - Speak only English Native:
94.8% (10,507)Foreign-born:
68.5% (788)
White alone - Speak another language Native:
5.1% (562)Foreign-born:
33.9% (390)
Hispanic or Latino - Speak only English Native:
80.5% (834)Foreign-born:
2.7% (31)
Hispanic or Latino - Speak another language Native:
30.1% (312)Foreign-born:
97.1% (1,107)
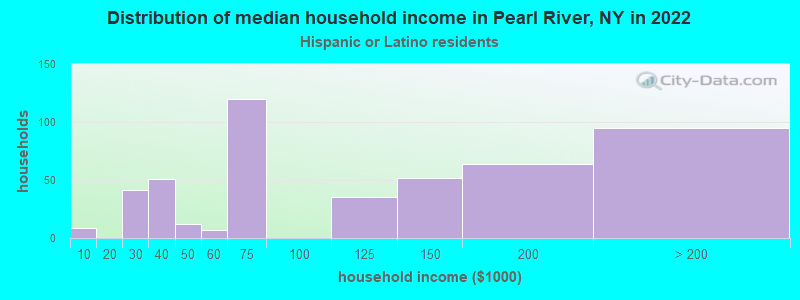
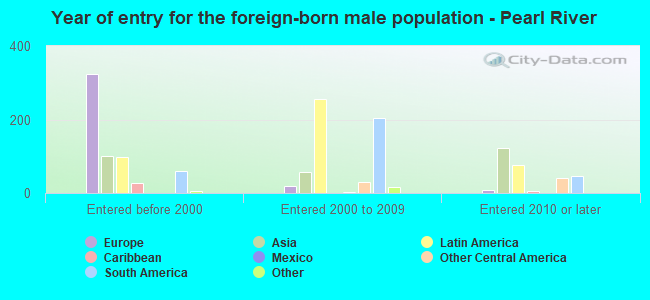
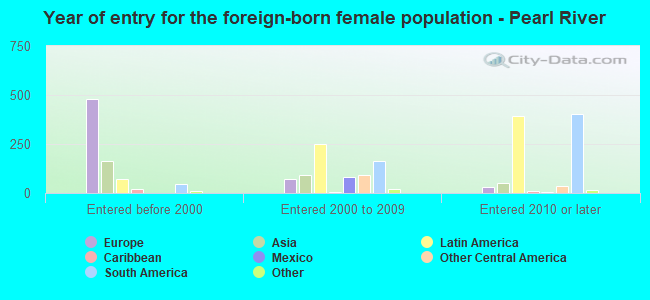
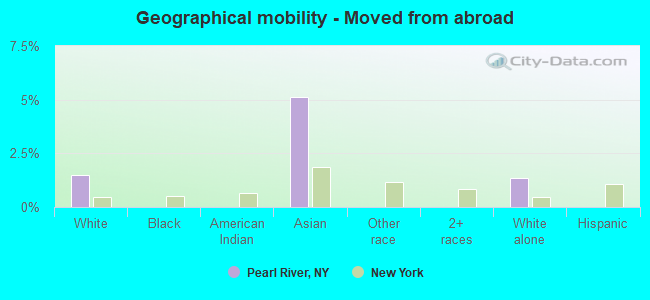
Foreign-born residents in Pearl River 2,990 residents are foreign born (7.5% Latin America , 7.0% Europe , 3.5% Asia ).
This city:
18.1%New York:
22.6%
Marital status for residents in Pearl River Marital status - White (Caucasian) population 15 years and over
Males 30.3% Never married58.1% Now married1.4% Separated4.8% Widowed5.3% DivorcedFemales 25.8% Never married55.7% Now married0.5% Separated11.8% Widowed6.2% DivorcedWomen who gave birth in the past 12 months Now married:
100.0% (106)Unmarried:
0.0% (0)
Women who did not give birth in the past 12 months Now married:
52.7% (1,471)Unmarried:
47.3% (1,321)
Marital status - Black or African American population 15 years and over
Males 41.2% Never married30.4% Now married0.0% Separated19.6% Widowed8.8% DivorcedFemales 9.3% Never married69.8% Now married4.7% Separated16.3% Widowed0.0% DivorcedWomen who gave birth in the past 12 months Now married:
0.0% (0)Unmarried:
100.0% (2)
Women who did not give birth in the past 12 months Now married:
80.0% (7)Unmarried:
20.0% (2)
Marital status - American Indian / Alaska Native population 15 years and over
Males 0.0% Never married100.0% Now married0.0% Separated0.0% Widowed0.0% DivorcedFemales 0.0% Never married81.5% Now married0.0% Separated18.5% Widowed0.0% DivorcedWomen who did not give birth in the past 12 months Now married:
100.0% (26)Unmarried:
0.0% (0)
Marital status - Asian population 15 years and over
Males 25.0% Never married75.0% Now married0.0% Separated0.0% Widowed0.0% DivorcedFemales 19.7% Never married75.5% Now married0.0% Separated0.0% Widowed4.7% DivorcedWomen who gave birth in the past 12 months Now married:
100.0% (6)Unmarried:
0.0% (0)
Women who did not give birth in the past 12 months Now married:
69.5% (121)Unmarried:
30.5% (53)
Marital status - Other race population 15 years and over
Males 42.4% Never married53.3% Now married0.0% Separated0.0% Widowed4.3% DivorcedFemales 2.3% Never married97.7% Now married0.0% Separated0.0% Widowed0.0% DivorcedWomen who did not give birth in the past 12 months Now married:
98.7% (552)Unmarried:
1.3% (7)
Marital status - Two or more races population 15 years and over
Males 63.6% Never married36.4% Now married0.0% Separated0.0% Widowed0.0% DivorcedFemales 10.0% Never married53.3% Now married0.0% Separated15.6% Widowed21.1% DivorcedWomen who did not give birth in the past 12 months Now married:
36.8% (21)Unmarried:
63.2% (36)
Marital status - White alone, not Hispanic / Latino population 15 years and over
Males 30.8% Never married57.4% Now married1.4% Separated4.9% Widowed5.4% DivorcedFemales 24.4% Never married57.1% Now married0.6% Separated11.8% Widowed6.2% DivorcedWomen who gave birth in the past 12 months Now married:
100.0% (109)Unmarried:
0.0% (0)
Women who did not give birth in the past 12 months Now married:
54.9% (1,517)Unmarried:
45.1% (1,244)
Marital status - Hispanic or Latino population 15 years and over
Males 29.2% Never married68.2% Now married0.0% Separated0.0% Widowed2.7% DivorcedFemales 16.4% Never married77.0% Now married0.0% Separated3.8% Widowed2.8% DivorcedWomen who did not give birth in the past 12 months Now married:
78.8% (599)Unmarried:
21.2% (161)
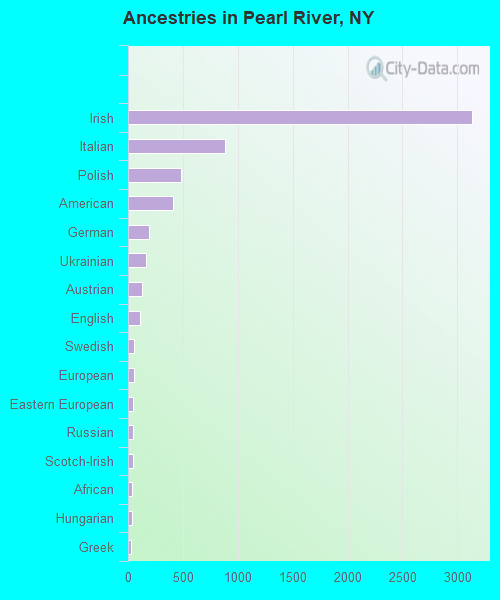
Ancestries in Pearl River
3,132 40.3% Irish886 11.4% Italian480 6.2% Polish413 5.3% American188 2.4% German168 2.2% Ukrainian131 1.7% Austrian112 1.4% English59 0.8% Swedish56 0.7% European47 0.6% Eastern European45 0.6% Russian45 0.6% Scotch-Irish36 0.5% African34 0.4% Hungarian30 0.4% Greek27 0.3% Armenian21 0.3% Egyptian12 0.2% Haitian11 0.1% Scottish10 0.1% Palestinian10 0.1% Lithuanian9 0.1% Trinidadian and Tobagonian8 0.1% British7 0.09% Czechoslovakian6 0.08% Belgian6 0.08% French5 0.06% Norwegian4 0.05% Dutch
Children Nativity (place of birth) in Pearl River
Children under 6 years - Living with two parents Both parents native 749 99.8% Native1 0.2% Foreign-bornBoth parents foreign-born 274 80.7% Native66 19.3% Foreign-bornOne native, one foreign-born parent 105 100.0% NativeChildren under 6 years - Living with one parent Native parent 8 100.0% NativeChildren 6 to 17 years - Living with two parents Both parents native 1,375 98.7% Native18 1.3% Foreign-bornBoth parents foreign-born 596 81.5% Native136 18.5% Foreign-bornOne native, one foreign-born parent 120 100.0% NativeChildren 6 to 17 years - Living with one parent Native parent 181 100.0% NativeForeign-born parent 63 56.9% Native48 43.1% Foreign-born