Races in Pearland, Texas (TX) Detailed Stats
Data:
Races - White alone (%)
Races - White alone (% change since 2000)
Races - Black alone (%)
Races - Black alone (% change since 2000)
Races - American Indian alone (%)
Races - American Indian alone (% change since 2000)
Races - Asian alone (%)
Races - Asian alone (% change since 2000)
Races - Hispanic (%)
Races - Hispanic (% change since 2000)
Races - Native Hawaiian and Other Pacific Islander alone (%)
Races - Native Hawaiian and Other Pacific Islander alone (% change since 2000)
Races - Two or more races(%)
Races - Two or more races(% change since 2000)
Races - Other race alone (%)
Races - Other race alone (% change since 2000)
Racial diversity
Place of birth - Born in state of residence (%)
Place of birth - Born in state of residence (%) - White
Place of birth - Born in state of residence (%) - Black or African American
Place of birth - Born in state of residence (%) - Asian
Place of birth - Born in state of residence (%) - Hispanic or Latino
Place of birth - Born in state of residence (%) - American Indian and Alaska Native
Place of birth - Born in state of residence (%) - Multirace
Place of birth - Born in state of residence (%) - Other Race
Place of birth - Born in other state (%)
Place of birth - Born in other state (%) - White
Place of birth - Born in other state (%) - Black or African American
Place of birth - Born in other state (%) - Asian
Place of birth - Born in other state (%) - Hispanic or Latino
Place of birth - Born in other state (%) - American Indian and Alaska Native
Place of birth - Born in other state (%) - Multirace
Place of birth - Born in other state (%) - Other Race
Place of birth - Native, outside of US (%)
Place of birth - Native, outside of US (%) - White
Place of birth - Native, outside of US (%) - Black or African American
Place of birth - Native, outside of US (%) - Asian
Place of birth - Native, outside of US (%) - Hispanic or Latino
Place of birth - Native, outside of US (%) - American Indian and Alaska Native
Place of birth - Native, outside of US (%) - Multirace
Place of birth - Native, outside of US (%) - Other Race
Place of birth - Foreign born (%)
Place of birth - Foreign born (%) - White
Place of birth - Foreign born (%) - Black or African American
Place of birth - Foreign born (%) - Asian
Place of birth - Foreign born (%) - Hispanic or Latino
Place of birth - Foreign born (%) - American Indian and Alaska Native
Place of birth - Foreign born (%) - Multirace
Place of birth - Foreign born (%) - Other Race
Residents speaking English at home (%)
Residents speaking English at home - Born in the United States (%)
Residents speaking English at home - Native, born elsewhere (%)
Residents speaking English at home - Foreign born (%)
Residents speaking Spanish at home (%)
Residents speaking Spanish at home - Born in the United States (%)
Residents speaking Spanish at home - Native, born elsewhere (%)
Residents speaking Spanish at home - Foreign born (%)
Residents speaking other language at home (%)
Residents speaking other language at home - Born in the United States (%)
Residents speaking other language at home - Native, born elsewhere (%)
Residents speaking other language at home - Foreign born (%)
Marital status - Never married (%)
Marital status - Now married (%)
Marital status - Separated (%)
Marital status - Widowed (%)
Marital status - Divorced (%)
Ancestries Reported - Arab (%)
Ancestries Reported - Czech (%)
Ancestries Reported - Danish (%)
Ancestries Reported - Dutch (%)
Ancestries Reported - English (%)
Ancestries Reported - French (%)
Ancestries Reported - French Canadian (%)
Ancestries Reported - German (%)
Ancestries Reported - Greek (%)
Ancestries Reported - Hungarian (%)
Ancestries Reported - Irish (%)
Ancestries Reported - Italian (%)
Ancestries Reported - Lithuanian (%)
Ancestries Reported - Norwegian (%)
Ancestries Reported - Polish (%)
Ancestries Reported - Portuguese (%)
Ancestries Reported - Russian (%)
Ancestries Reported - Scotch-Irish (%)
Ancestries Reported - Scottish (%)
Ancestries Reported - Slovak (%)
Ancestries Reported - Subsaharan African (%)
Ancestries Reported - Swedish (%)
Ancestries Reported - Swiss (%)
Ancestries Reported - Ukrainian (%)
Ancestries Reported - United States (%)
Ancestries Reported - Welsh (%)
Ancestries Reported - West Indian (%)
Ancestries Reported - Other (%)
Geographical mobility - Same house 1 year ago (%)
Geographical mobility - Same house 1 year ago (%) - White
Geographical mobility - Same house 1 year ago (%) - Black or African American
Geographical mobility - Same house 1 year ago (%) - Asian
Geographical mobility - Same house 1 year ago (%) - Hispanic or Latino
Geographical mobility - Same house 1 year ago (%) - American Indian and Alaska Native
Geographical mobility - Same house 1 year ago (%) - Multirace
Geographical mobility - Same house 1 year ago (%) - Other Race
Geographical mobility - Moved within same county (%)
Geographical mobility - Moved within same county (%) - White
Geographical mobility - Moved within same county (%) - Black or African American
Geographical mobility - Moved within same county (%) - Asian
Geographical mobility - Moved within same county (%) - Hispanic or Latino
Geographical mobility - Moved within same county (%) - American Indian and Alaska Native
Geographical mobility - Moved within same county (%) - Multirace
Geographical mobility - Moved within same county (%) - Other Race
Geographical mobility - Moved from different county within same state (%)
Geographical mobility - Moved from different county within same state (%) - White
Geographical mobility - Moved from different county within same state (%) - Black or African American
Geographical mobility - Moved from different county within same state (%) - Asian
Geographical mobility - Moved from different county within same state (%) - Hispanic or Latino
Geographical mobility - Moved from different county within same state (%) - American Indian and Alaska Native
Geographical mobility - Moved from different county within same state (%) - Multirace
Geographical mobility - Moved from different county within same state (%) - Other Race
Geographical mobility - Moved from different state (%)
Geographical mobility - Moved from different state (%) - White
Geographical mobility - Moved from different state (%) - Black or African American
Geographical mobility - Moved from different state (%) - Asian
Geographical mobility - Moved from different state (%) - Hispanic or Latino
Geographical mobility - Moved from different state (%) - American Indian and Alaska Native
Geographical mobility - Moved from different state (%) - Multirace
Geographical mobility - Moved from different state (%) - Other Race
Geographical mobility - Moved from abroad (%)
Geographical mobility - Moved from abroad (%) - White
Geographical mobility - Moved from abroad (%) - Black or African American
Geographical mobility - Moved from abroad (%) - Asian
Geographical mobility - Moved from abroad (%) - Hispanic or Latino
Geographical mobility - Moved from abroad (%) - American Indian and Alaska Native
Geographical mobility - Moved from abroad (%) - Multirace
Geographical mobility - Moved from abroad (%) - Other Race
Place of birth for the foreign-born population - Ireland (%)
Place of birth for the foreign-born population - Denmark (%)
Place of birth for the foreign-born population - Norway (%)
Place of birth for the foreign-born population - Sweden (%)
Place of birth for the foreign-born population - United Kingdom (%)
Place of birth for the foreign-born population - England (%)
Place of birth for the foreign-born population - Scotland (%)
Place of birth for the foreign-born population - Other Northern Europe (%)
Place of birth for the foreign-born population - Austria (%)
Place of birth for the foreign-born population - Belgium (%)
Place of birth for the foreign-born population - France (%)
Place of birth for the foreign-born population - Germany (%)
Place of birth for the foreign-born population - Netherlands (%)
Place of birth for the foreign-born population - Switzerland (%)
Place of birth for the foreign-born population - Other Western Europe (%)
Place of birth for the foreign-born population - Greece (%)
Place of birth for the foreign-born population - Italy (%)
Place of birth for the foreign-born population - Portugal (%)
Place of birth for the foreign-born population - Spain (%)
Place of birth for the foreign-born population - Other Southern Europe (%)
Place of birth for the foreign-born population - Albania (%)
Place of birth for the foreign-born population - Belarus (%)
Place of birth for the foreign-born population - Bosnia and Herzegovina (%)
Place of birth for the foreign-born population - Bulgaria (%)
Place of birth for the foreign-born population - Croatia (%)
Place of birth for the foreign-born population - Czechoslovakia (%)
Place of birth for the foreign-born population - Hungary (%)
Place of birth for the foreign-born population - Latvia (%)
Place of birth for the foreign-born population - Lithuania (%)
Place of birth for the foreign-born population - North Macedonia (Macedonia) (%)
Place of birth for the foreign-born population - Moldova (%)
Place of birth for the foreign-born population - Poland (%)
Place of birth for the foreign-born population - Romania (%)
Place of birth for the foreign-born population - Russia (%)
Place of birth for the foreign-born population - Serbia (%)
Place of birth for the foreign-born population - Ukraine (%)
Place of birth for the foreign-born population - Other Eastern Europe (%)
Place of birth for the foreign-born population - China (%)
Place of birth for the foreign-born population - Hong Kong (%)
Place of birth for the foreign-born population - Taiwan (%)
Place of birth for the foreign-born population - Japan (%)
Place of birth for the foreign-born population - Korea (%)
Place of birth for the foreign-born population - Other Eastern Asia (%)
Place of birth for the foreign-born population - Afghanistan (%)
Place of birth for the foreign-born population - Bangladesh (%)
Place of birth for the foreign-born population - India (%)
Place of birth for the foreign-born population - Iran (%)
Place of birth for the foreign-born population - Kazakhstan (%)
Place of birth for the foreign-born population - Nepal (%)
Place of birth for the foreign-born population - Pakistan (%)
Place of birth for the foreign-born population - Sri Lanka (%)
Place of birth for the foreign-born population - Uzbekistan (%)
Place of birth for the foreign-born population - Other South Central Asia (%)
Place of birth for the foreign-born population - Burma (%)
Place of birth for the foreign-born population - Cambodia (%)
Place of birth for the foreign-born population - Indonesia (%)
Place of birth for the foreign-born population - Laos (%)
Place of birth for the foreign-born population - Malaysia (%)
Place of birth for the foreign-born population - Philippines (%)
Place of birth for the foreign-born population - Singapore (%)
Place of birth for the foreign-born population - Thailand (%)
Place of birth for the foreign-born population - Vietnam (%)
Place of birth for the foreign-born population - Other South Eastern Asia (%)
Place of birth for the foreign-born population - Armenia (%)
Place of birth for the foreign-born population - Iraq (%)
Place of birth for the foreign-born population - Israel (%)
Place of birth for the foreign-born population - Jordan (%)
Place of birth for the foreign-born population - Kuwait (%)
Place of birth for the foreign-born population - Lebanon (%)
Place of birth for the foreign-born population - Saudi Arabia (%)
Place of birth for the foreign-born population - Syria (%)
Place of birth for the foreign-born population - Turkey (%)
Place of birth for the foreign-born population - Yemen (%)
Place of birth for the foreign-born population - Other Western Asia (%)
Place of birth for the foreign-born population - Eritrea (%)
Place of birth for the foreign-born population - Ethiopia (%)
Place of birth for the foreign-born population - Kenya (%)
Place of birth for the foreign-born population - Somalia (%)
Place of birth for the foreign-born population - Uganda (%)
Place of birth for the foreign-born population - Zimbabwe (%)
Place of birth for the foreign-born population - Other Eastern Africa (%)
Place of birth for the foreign-born population - Cameroon (%)
Place of birth for the foreign-born population - Congo (%)
Place of birth for the foreign-born population - Democratic Republic of Congo (Zaire) (%)
Place of birth for the foreign-born population - Other Middle Africa (%)
Place of birth for the foreign-born population - Egypt (%)
Place of birth for the foreign-born population - Morocco (%)
Place of birth for the foreign-born population - Sudan (%)
Place of birth for the foreign-born population - Other Northern Africa (%)
Place of birth for the foreign-born population - South Africa (%)
Place of birth for the foreign-born population - Other Southern Africa (%)
Place of birth for the foreign-born population - Cabo Verde (%)
Place of birth for the foreign-born population - Ghana (%)
Place of birth for the foreign-born population - Liberia (%)
Place of birth for the foreign-born population - Nigeria (%)
Place of birth for the foreign-born population - Senegal (%)
Place of birth for the foreign-born population - Sierra Leone (%)
Place of birth for the foreign-born population - Other Western Africa (%)
Place of birth for the foreign-born population - Australia (%)
Place of birth for the foreign-born population - New Zealand (%)
Place of birth for the foreign-born population - Fiji (%)
Place of birth for the foreign-born population - Micronesia (%)
Place of birth for the foreign-born population - Bahamas (%)
Place of birth for the foreign-born population - Barbados (%)
Place of birth for the foreign-born population - Cuba (%)
Place of birth for the foreign-born population - Dominica (%)
Place of birth for the foreign-born population - Dominican Republic (%)
Place of birth for the foreign-born population - Grenada (%)
Place of birth for the foreign-born population - Haiti (%)
Place of birth for the foreign-born population - Jamaica (%)
Place of birth for the foreign-born population - St. Vincent and the Grenadines (%)
Place of birth for the foreign-born population - Trinidad and Tobago (%)
Place of birth for the foreign-born population - West Indies (%)
Place of birth for the foreign-born population - Other Caribbean (%)
Place of birth for the foreign-born population - Belize (%)
Place of birth for the foreign-born population - Costa Rica (%)
Place of birth for the foreign-born population - El Salvador (%)
Place of birth for the foreign-born population - Guatemala (%)
Place of birth for the foreign-born population - Honduras (%)
Place of birth for the foreign-born population - Mexico (%)
Place of birth for the foreign-born population - Nicaragua (%)
Place of birth for the foreign-born population - Panama (%)
Place of birth for the foreign-born population - Other Central America (%)
Place of birth for the foreign-born population - Argentina (%)
Place of birth for the foreign-born population - Bolivia (%)
Place of birth for the foreign-born population - Brazil (%)
Place of birth for the foreign-born population - Chile (%)
Place of birth for the foreign-born population - Colombia (%)
Place of birth for the foreign-born population - Ecuador (%)
Place of birth for the foreign-born population - Guyana (%)
Place of birth for the foreign-born population - Peru (%)
Place of birth for the foreign-born population - Uruguay (%)
Place of birth for the foreign-born population - Venezuela (%)
Place of birth for the foreign-born population - Other South America (%)
Place of birth for the foreign-born population - Canada (%)
Place of birth for the foreign-born population - Other Northern America (%)
Place of birth for the foreign-born population - Other (%)
Latest news about races in Pearland, TX collected exclusively by city-data.com from local newspapers, TV, and radio stations
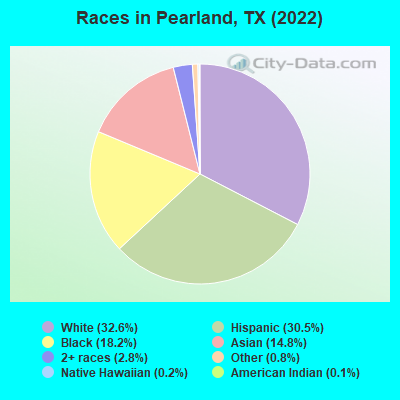
According to 2022 data, the most numerous races in Pearland, TX are Hispanic (38,727 residents), White alone (41,492 residents), and Black alone (23,149 residents). 67.0% of Pearland residents speak English at home. 18.3% of Pearland, TX residents are foreign-born (11.0% born in Asia, 5.5% born in Latin America), which is 7.3% greater than the foreign-born rate of 17.0% across the entire state of Texas.
Race distribution in Pearland
2000 2022
10,933,313 52.4% White alone 6,669,666 32.0% Hispanic 2,364,255 11.3% Black alone 554,445 2.7% Asian alone 230,567 1.1% Two or more races 68,859 0.3% American Indian alone 19,958 0.10% Other race alone 10,757 0.05% Native Hawaiian and Other
12,070,642 40.2% Hispanic 11,683,430 38.9% White alone 3,508,706 11.7% Black alone 1,608,173 5.4% Asian alone 956,560 3.2% Two or more races 125,763 0.4% Other race alone 47,023 0.2% American Indian alone 29,275 0.10% Native Hawaiian and Other
Income and house value in Pearland Median household income in 2022 $121,273 White non-Hispanic householders$107,243 Black householders$181,444 American Indian and Alaska Native householders$104,786 Asian householders$57,714 Some other race householders$101,094 Two or more races householders$81,578 Hispanic or Latino race householdersMedian 2022 house value $342,135 White Non-Hispanic householders$456,278 Black or African American householders$272,300 American Indian or Alaska Native householders $421,067 Asian householders$345,363 Some other race householders$288,731 Two or more races householders$320,128 Hispanic or Latino householders
Median age by race in Pearland
39.8 Median age for White residents39.5 40.4 44.0 Median age for Black or African American residents39.4 49.1 43.7 Median age for American Indian / Alaska Native residents20.8 44.5 40.2 Median age for Asian residents40.2 40.2 5.4 Median age for Native Hawaiian / Pacific Islander residents28.3 -666,666,666.0 31.2 Median age for Other race residents23.9 34.1 25.1 Median age for Two or more races residents26.0 23.9 40.4 Median age for White alone residents39.9 41.0 28.8 Median age for Hispanic or Latino residents26.2 29.3
Owner/renter occupied households by race in Pearland
House owners and renters - White residents 15,639 83.8% Owner occupied3,028 16.2% Renter occupiedHouse owners and renters - Black or African American residents 5,910 66.4% Owner occupied2,991 33.6% Renter occupiedHouse owners and renters - American Indian / Alaska Native residents 78 100.0% Owner occupiedHouse owners and renters - Asian residents 5,225 87.7% Owner occupied734 12.3% Renter occupiedHouse owners and renters - Native Hawaiian / Pacific Islander residents 5 100.0% Owner occupiedHouse owners and renters - Other race residents 2,198 65.7% Owner occupied1,145 34.3% Renter occupiedHouse owners and renters - Two or more races residents 4,312 64.6% Owner occupied2,365 35.4% Renter occupiedHouse owners and renters - White alone residents 13,633 82.7% Owner occupied2,843 17.3% Renter occupiedHouse owners and renters - Hispanic or Latino residents 7,120 67.3% Owner occupied3,453 32.7% Renter occupied
Language usage in Pearland
English speakers - Total 67.0% of residents of Pearland speak English at home.
16.7% of residents speak Spanish at home 14,576 73.3% Speak English very well5,318 26.7% Speak English less than very well16.3% of residents speak other language at home 12,770 65.8% Speak English very well6,646 34.2% Speak English less than very well
English speakers - Born in the United States 86.8% of residents of Pearland speak English at home.
6.1% of residents speak Spanish at home 1,389 90.4% Speak English very well147 9.6% Speak English less than very well7.2% of residents speak other language at home 1,518 83.8% Speak English very well294 16.2% Speak English less than very well
English speakers - Native, born elsewhere 49.4% of residents of Pearland speak English at home.
40.2% of residents speak Spanish at home 471 75.4% Speak English very well154 24.6% Speak English less than very well10.4% of residents speak other language at home 29 17.9% Speak English very well133 82.1% Speak English less than very well
English speakers - Foreign-born 12.0% of residents of Pearland speak English at home.
27.1% of residents speak Spanish at home 3,869 57.8% Speak English very well2,828 42.2% Speak English less than very well60.9% of residents speak other language at home 9,078 60.4% Speak English very well5,945 39.6% Speak English less than very well
White (Caucasian) - Speak only English Native:
94.1% (39,342)Foreign-born:
14.3% (386)
White (Caucasian) - Speak another language Native:
5.9% (2,469)Foreign-born:
85.7% (2,313)
Black or African American - Speak only English Native:
97.8% (22,212)Foreign-born:
23.0% (323)
Black or African American - Speak another language Native:
1.9% (438)Foreign-born:
58.1% (816)
Asian - Speak only English Native:
41.1% (1,687)Foreign-born:
10.6% (1,467)
Asian - Speak another language Native:
58.9% (2,421)Foreign-born:
89.4% (12,398)
Other race - Speak only English Native:
38.4% (2,645)Foreign-born:
25.4% (556)
Other race - Speak another language Native:
61.6% (4,252)Foreign-born:
74.6% (1,629)
Two or more races - Speak only English Native:
58.7% (11,141)Foreign-born:
7.2% (372)
Two or more races - Speak another language Native:
41.3% (7,843)Foreign-born:
92.8% (4,787)
White alone - Speak only English Native:
95.8% (35,250)Foreign-born:
18.0% (386)
White alone - Speak another language Native:
4.2% (1,548)Foreign-born:
82.0% (1,764)
Hispanic or Latino - Speak only English Native:
54.4% (15,000)Foreign-born:
11.6% (890)
Hispanic or Latino - Speak another language Native:
45.6% (12,571)Foreign-born:
88.4% (6,756)
Foreign-born residents in Pearland 23,666 residents are foreign born (11.0% Asia , 5.5% Latin America ).
This city:
18.3%Texas:
17.1%
Marital status for residents in Pearland Marital status - White (Caucasian) population 15 years and over
Males 30.2% Never married59.4% Now married0.0% Separated2.0% Widowed8.4% DivorcedFemales 24.6% Never married53.4% Now married2.5% Separated6.6% Widowed13.0% DivorcedWomen who gave birth in the past 12 months Now married:
100.0% (641)Unmarried:
0.0% (0)
Women who did not give birth in the past 12 months Now married:
48.1% (4,817)Unmarried:
51.9% (5,190)
Marital status - Black or African American population 15 years and over
Males 43.4% Never married45.3% Now married2.8% Separated0.0% Widowed8.5% DivorcedFemales 35.6% Never married42.9% Now married3.7% Separated7.1% Widowed10.7% DivorcedWomen who gave birth in the past 12 months Now married:
51.7% (180)Unmarried:
48.3% (168)
Women who did not give birth in the past 12 months Now married:
35.6% (1,664)Unmarried:
64.4% (3,010)
Marital status - American Indian / Alaska Native population 15 years and over
Males 21.8% Never married78.2% Now married0.0% Separated0.0% Widowed0.0% DivorcedFemales 24.7% Never married64.4% Now married0.0% Separated0.0% Widowed11.0% DivorcedWomen who did not give birth in the past 12 months Now married:
43.1% (85)Unmarried:
56.9% (112)
Marital status - Asian population 15 years and over
Males 25.4% Never married73.2% Now married0.0% Separated0.5% Widowed0.9% DivorcedFemales 19.0% Never married70.9% Now married2.1% Separated5.8% Widowed2.2% DivorcedWomen who gave birth in the past 12 months Now married:
77.5% (145)Unmarried:
22.5% (42)
Women who did not give birth in the past 12 months Now married:
63.8% (2,876)Unmarried:
36.2% (1,633)
Marital status - Other race population 15 years and over
Males 30.4% Never married66.4% Now married0.7% Separated0.0% Widowed2.5% DivorcedFemales 33.5% Never married58.4% Now married0.0% Separated0.8% Widowed7.3% DivorcedWomen who gave birth in the past 12 months Now married:
100.0% (71)Unmarried:
0.0% (0)
Women who did not give birth in the past 12 months Now married:
53.9% (1,242)Unmarried:
46.1% (1,063)
Marital status - Two or more races population 15 years and over
Males 41.4% Never married55.8% Now married0.9% Separated0.9% Widowed0.9% DivorcedFemales 34.9% Never married52.7% Now married2.3% Separated1.0% Widowed9.1% DivorcedWomen who gave birth in the past 12 months Now married:
69.8% (201)Unmarried:
30.2% (87)
Women who did not give birth in the past 12 months Now married:
53.3% (4,065)Unmarried:
46.7% (3,558)
Marital status - White alone, not Hispanic / Latino population 15 years and over
Males 30.7% Never married59.0% Now married0.0% Separated2.2% Widowed8.1% DivorcedFemales 24.9% Never married51.9% Now married2.1% Separated7.5% Widowed13.6% DivorcedWomen who gave birth in the past 12 months Now married:
100.0% (546)Unmarried:
0.0% (0)
Women who did not give birth in the past 12 months Now married:
46.3% (3,871)Unmarried:
53.7% (4,493)
Marital status - Hispanic or Latino population 15 years and over
Males 37.3% Never married58.4% Now married0.6% Separated0.6% Widowed3.1% DivorcedFemales 34.4% Never married53.6% Now married2.2% Separated0.6% Widowed9.2% DivorcedWomen who gave birth in the past 12 months Now married:
83.1% (429)Unmarried:
16.9% (87)
Women who did not give birth in the past 12 months Now married:
50.4% (6,016)Unmarried:
49.6% (5,910)
Ancestries in Pearland
4,156 5.4% English3,413 4.5% American2,814 3.7% German2,675 3.5% Irish809 1.1% European639 0.8% French635 0.8% Italian553 0.7% African450 0.6% Scottish401 0.5% Nigerian352 0.5% Czech330 0.4% Haitian305 0.4% Dutch279 0.4% Polish277 0.4% British264 0.3% Scotch-Irish212 0.3% Austrian212 0.3% Norwegian204 0.3% Greek199 0.3% French Canadian196 0.3% Russian149 0.2% Northern European128 0.2% Hungarian115 0.2% Palestinian104 0.1% Brazilian91 0.1% Eastern European74 0.10% Arab66 0.09% Jamaican64 0.08% Portuguese61 0.08% Lebanese61 0.08% Swedish58 0.08% Egyptian56 0.07% Welsh45 0.06% Maltese40 0.05% Israeli40 0.05% Cajun38 0.05% Iranian38 0.05% Czechoslovakian37 0.05% Ukrainian35 0.05% Latvian34 0.04% Icelander33 0.04% Scandinavian33 0.04% Canadian32 0.04% Lithuanian32 0.04% Ethiopian29 0.04% Croatian27 0.04% Danish24 0.03% Swiss21 0.03% Barbadian16 0.02% Trinidadian and Tobagonian8 0.01% British West Indian
Geographical mobility in Pearland Same house 1 year ago 42,367 90.0% White (Caucasian)20,266 87.8% Black or African American462 75.3% American Indian / Alaska Native18,834 92.7% Asian34 88.4% Native Hawaiian / Pacific Islander5,169 90.1% Other race22,579 84.6% Two or more races37,548 91.7% White alone, not Hispanic / Latino32,397 85.0% Hispanic or LatinoMoved within same county 2,512 5.3% White / Caucasian256 1.1% Black or African American178 0.9% Asian420 7.3% Other race2,135 8.0% Two or more races1,535 3.7% White alone, not Hispanic / Latino2,827 7.4% Hispanic or LatinoMoved within same state 1,874 4.0% White / Caucasian2,370 10.3% Black or African American20 3.3% American Indian / Alaska Native1,123 5.5% Asian139 2.4% Other race1,895 7.1% Two or more races1,556 3.8% White alone, not Hispanic / Latino2,677 7.0% Hispanic or LatinoMoved from different state 256 0.5% White / Caucasian190 0.8% Black or African American152 24.7% American Indian / Alaska Native235 1.2% Asian7 18.3% Native Hawaiian / Pacific Islander10 0.2% Other race90 0.3% Two or more races256 0.6% White alone, not Hispanic / Latino208 0.5% Hispanic or LatinoMoved from abroad 43 0.1% White384 1.9% Asian10 0.2% Other race43 0.1% White alone, not Hispanic / Latino
Children Nativity (place of birth) in Pearland
Children under 6 years - Living with two parents Both parents native 4,277 100.0% NativeBoth parents foreign-born 1,206 96.7% Native41 3.3% Foreign-bornOne native, one foreign-born parent 2,197 100.0% NativeChildren under 6 years - Living with one parent Native parent 1,900 100.0% NativeForeign-born parent 150 100.0% NativeChildren 6 to 17 years - Living with two parents Both parents native 9,085 100.0% NativeBoth parents foreign-born 2,619 66.6% Native1,316 33.4% Foreign-bornOne native, one foreign-born parent 2,481 94.9% Native134 5.1% Foreign-bornChildren 6 to 17 years - Living with one parent Native parent 5,942 100.0% NativeForeign-born parent 895 50.0% Native895 50.0% Foreign-born
Place of birth for residents in Pearland 14,253 Asia7,161 Americas7,055 Latin America6,240 South Eastern Asia5,086 Central America5,040 South Central Asia1,921 Eastern Asia1,458 China1,160 Africa1,158 South America1,086 Europe1,050 Western Asia810 Caribbean545 Eastern Europe462 Middle Africa318 Western Europe305 Eastern Africa266 Western Africa185 Northern Europe107 Northern Africa105 Northern America37 Southern Europe18 Southern Africa5 Oceania5 Australia and New Zealand Subregion4,209 India4,169 Mexico3,281 Philippines2,806 Vietnam1,220 China675 Venezuela674 Pakistan453 Korea419 Cameroon358 Honduras337 El Salvador302 Germany291 Jamaica278 Kuwait255 Nigeria230 Taiwan220 Russia220 Costa Rica206 Syria204 Haiti187 Lebanon141 Brazil141 Saudi Arabia131 Dominican Republic116 Colombia108 Ecuador105 Canada101 United Kingdom100 Cuba100 Nepal99 United Arab Emirates98 Egypt95 Eritrea93 Ethiopia83 England81 Peru80 Hungary59 Cambodia55 Bangladesh53 Trinidad and Tobago49 Kenya46 Ukraine45 Jordan43 Iraq42 Democratic Republic of Congo (Zaire)42 Malaysia38 Israel37 Greece34 Argentina32 Albania26 Zimbabwe22 Romania22 Indonesia19 Uganda19 Barbados18 South Africa16 Czechoslovakia15 France14 Burma (Myanmar)11 Latvia9 Grenada9 Algeria9 Japan9 Tanzania9 Thailand7 Hong Kong5 Australia5 Singapore
Grandparents responsible for own grandchildren in Pearland
Grandparents (30 to 59 years) White / Caucasian 66 31.1% Responsible for grandchildren145 68.9% Not responsible for grandchildrenBlack or African American 129 92.5% Responsible for grandchildren10 7.5% Not responsible for grandchildrenAmerican Indian / Alaska Native 9 14.0% Responsible for grandchildren58 86.0% Not responsible for grandchildrenAsian 4 2.4% Responsible for grandchildren149 97.6% Not responsible for grandchildrenOther race 127 100.0% Not responsible for grandchildrenTwo or more races 38 100.0% Not responsible for grandchildrenWhite alone, not Hispanic / Latino 92 31.5% Responsible for grandchildren200 68.5% Not responsible for grandchildrenHispanic or Latino 139 100.0% Not responsible for grandchildrenGrandparents (60 years and over) White / Caucasian 140 32.0% Responsible for grandchildren298 68.0% Not responsible for grandchildrenBlack or African American 128 43.4% Responsible for grandchildren166 56.6% Not responsible for grandchildrenAmerican Indian / Alaska Native 64 100.0% Not responsible for grandchildrenAsian 29 2.5% Responsible for grandchildren1,125 97.5% Not responsible for grandchildrenOther race 7 100.0% Not responsible for grandchildrenTwo or more races 41 100.0% Not responsible for grandchildrenWhite alone, not Hispanic / Latino 182 35.7% Responsible for grandchildren327 64.3% Not responsible for grandchildrenHispanic or Latino 96 100.0% Not responsible for grandchildren