Races in Pekin, Illinois (IL) Detailed Stats
Data:
Races - White alone (%)
Races - White alone (% change since 2000)
Races - Black alone (%)
Races - Black alone (% change since 2000)
Races - American Indian alone (%)
Races - American Indian alone (% change since 2000)
Races - Asian alone (%)
Races - Asian alone (% change since 2000)
Races - Hispanic (%)
Races - Hispanic (% change since 2000)
Races - Native Hawaiian and Other Pacific Islander alone (%)
Races - Native Hawaiian and Other Pacific Islander alone (% change since 2000)
Races - Two or more races(%)
Races - Two or more races(% change since 2000)
Races - Other race alone (%)
Races - Other race alone (% change since 2000)
Racial diversity
Place of birth - Born in state of residence (%)
Place of birth - Born in state of residence (%) - White
Place of birth - Born in state of residence (%) - Black or African American
Place of birth - Born in state of residence (%) - Asian
Place of birth - Born in state of residence (%) - Hispanic or Latino
Place of birth - Born in state of residence (%) - American Indian and Alaska Native
Place of birth - Born in state of residence (%) - Multirace
Place of birth - Born in state of residence (%) - Other Race
Place of birth - Born in other state (%)
Place of birth - Born in other state (%) - White
Place of birth - Born in other state (%) - Black or African American
Place of birth - Born in other state (%) - Asian
Place of birth - Born in other state (%) - Hispanic or Latino
Place of birth - Born in other state (%) - American Indian and Alaska Native
Place of birth - Born in other state (%) - Multirace
Place of birth - Born in other state (%) - Other Race
Place of birth - Native, outside of US (%)
Place of birth - Native, outside of US (%) - White
Place of birth - Native, outside of US (%) - Black or African American
Place of birth - Native, outside of US (%) - Asian
Place of birth - Native, outside of US (%) - Hispanic or Latino
Place of birth - Native, outside of US (%) - American Indian and Alaska Native
Place of birth - Native, outside of US (%) - Multirace
Place of birth - Native, outside of US (%) - Other Race
Place of birth - Foreign born (%)
Place of birth - Foreign born (%) - White
Place of birth - Foreign born (%) - Black or African American
Place of birth - Foreign born (%) - Asian
Place of birth - Foreign born (%) - Hispanic or Latino
Place of birth - Foreign born (%) - American Indian and Alaska Native
Place of birth - Foreign born (%) - Multirace
Place of birth - Foreign born (%) - Other Race
Residents speaking English at home (%)
Residents speaking English at home - Born in the United States (%)
Residents speaking English at home - Native, born elsewhere (%)
Residents speaking English at home - Foreign born (%)
Residents speaking Spanish at home (%)
Residents speaking Spanish at home - Born in the United States (%)
Residents speaking Spanish at home - Native, born elsewhere (%)
Residents speaking Spanish at home - Foreign born (%)
Residents speaking other language at home (%)
Residents speaking other language at home - Born in the United States (%)
Residents speaking other language at home - Native, born elsewhere (%)
Residents speaking other language at home - Foreign born (%)
Marital status - Never married (%)
Marital status - Now married (%)
Marital status - Separated (%)
Marital status - Widowed (%)
Marital status - Divorced (%)
Ancestries Reported - Arab (%)
Ancestries Reported - Czech (%)
Ancestries Reported - Danish (%)
Ancestries Reported - Dutch (%)
Ancestries Reported - English (%)
Ancestries Reported - French (%)
Ancestries Reported - French Canadian (%)
Ancestries Reported - German (%)
Ancestries Reported - Greek (%)
Ancestries Reported - Hungarian (%)
Ancestries Reported - Irish (%)
Ancestries Reported - Italian (%)
Ancestries Reported - Lithuanian (%)
Ancestries Reported - Norwegian (%)
Ancestries Reported - Polish (%)
Ancestries Reported - Portuguese (%)
Ancestries Reported - Russian (%)
Ancestries Reported - Scotch-Irish (%)
Ancestries Reported - Scottish (%)
Ancestries Reported - Slovak (%)
Ancestries Reported - Subsaharan African (%)
Ancestries Reported - Swedish (%)
Ancestries Reported - Swiss (%)
Ancestries Reported - Ukrainian (%)
Ancestries Reported - United States (%)
Ancestries Reported - Welsh (%)
Ancestries Reported - West Indian (%)
Ancestries Reported - Other (%)
Geographical mobility - Same house 1 year ago (%)
Geographical mobility - Same house 1 year ago (%) - White
Geographical mobility - Same house 1 year ago (%) - Black or African American
Geographical mobility - Same house 1 year ago (%) - Asian
Geographical mobility - Same house 1 year ago (%) - Hispanic or Latino
Geographical mobility - Same house 1 year ago (%) - American Indian and Alaska Native
Geographical mobility - Same house 1 year ago (%) - Multirace
Geographical mobility - Same house 1 year ago (%) - Other Race
Geographical mobility - Moved within same county (%)
Geographical mobility - Moved within same county (%) - White
Geographical mobility - Moved within same county (%) - Black or African American
Geographical mobility - Moved within same county (%) - Asian
Geographical mobility - Moved within same county (%) - Hispanic or Latino
Geographical mobility - Moved within same county (%) - American Indian and Alaska Native
Geographical mobility - Moved within same county (%) - Multirace
Geographical mobility - Moved within same county (%) - Other Race
Geographical mobility - Moved from different county within same state (%)
Geographical mobility - Moved from different county within same state (%) - White
Geographical mobility - Moved from different county within same state (%) - Black or African American
Geographical mobility - Moved from different county within same state (%) - Asian
Geographical mobility - Moved from different county within same state (%) - Hispanic or Latino
Geographical mobility - Moved from different county within same state (%) - American Indian and Alaska Native
Geographical mobility - Moved from different county within same state (%) - Multirace
Geographical mobility - Moved from different county within same state (%) - Other Race
Geographical mobility - Moved from different state (%)
Geographical mobility - Moved from different state (%) - White
Geographical mobility - Moved from different state (%) - Black or African American
Geographical mobility - Moved from different state (%) - Asian
Geographical mobility - Moved from different state (%) - Hispanic or Latino
Geographical mobility - Moved from different state (%) - American Indian and Alaska Native
Geographical mobility - Moved from different state (%) - Multirace
Geographical mobility - Moved from different state (%) - Other Race
Geographical mobility - Moved from abroad (%)
Geographical mobility - Moved from abroad (%) - White
Geographical mobility - Moved from abroad (%) - Black or African American
Geographical mobility - Moved from abroad (%) - Asian
Geographical mobility - Moved from abroad (%) - Hispanic or Latino
Geographical mobility - Moved from abroad (%) - American Indian and Alaska Native
Geographical mobility - Moved from abroad (%) - Multirace
Geographical mobility - Moved from abroad (%) - Other Race
Place of birth for the foreign-born population - Ireland (%)
Place of birth for the foreign-born population - Denmark (%)
Place of birth for the foreign-born population - Norway (%)
Place of birth for the foreign-born population - Sweden (%)
Place of birth for the foreign-born population - United Kingdom (%)
Place of birth for the foreign-born population - England (%)
Place of birth for the foreign-born population - Scotland (%)
Place of birth for the foreign-born population - Other Northern Europe (%)
Place of birth for the foreign-born population - Austria (%)
Place of birth for the foreign-born population - Belgium (%)
Place of birth for the foreign-born population - France (%)
Place of birth for the foreign-born population - Germany (%)
Place of birth for the foreign-born population - Netherlands (%)
Place of birth for the foreign-born population - Switzerland (%)
Place of birth for the foreign-born population - Other Western Europe (%)
Place of birth for the foreign-born population - Greece (%)
Place of birth for the foreign-born population - Italy (%)
Place of birth for the foreign-born population - Portugal (%)
Place of birth for the foreign-born population - Spain (%)
Place of birth for the foreign-born population - Other Southern Europe (%)
Place of birth for the foreign-born population - Albania (%)
Place of birth for the foreign-born population - Belarus (%)
Place of birth for the foreign-born population - Bosnia and Herzegovina (%)
Place of birth for the foreign-born population - Bulgaria (%)
Place of birth for the foreign-born population - Croatia (%)
Place of birth for the foreign-born population - Czechoslovakia (%)
Place of birth for the foreign-born population - Hungary (%)
Place of birth for the foreign-born population - Latvia (%)
Place of birth for the foreign-born population - Lithuania (%)
Place of birth for the foreign-born population - North Macedonia (Macedonia) (%)
Place of birth for the foreign-born population - Moldova (%)
Place of birth for the foreign-born population - Poland (%)
Place of birth for the foreign-born population - Romania (%)
Place of birth for the foreign-born population - Russia (%)
Place of birth for the foreign-born population - Serbia (%)
Place of birth for the foreign-born population - Ukraine (%)
Place of birth for the foreign-born population - Other Eastern Europe (%)
Place of birth for the foreign-born population - China (%)
Place of birth for the foreign-born population - Hong Kong (%)
Place of birth for the foreign-born population - Taiwan (%)
Place of birth for the foreign-born population - Japan (%)
Place of birth for the foreign-born population - Korea (%)
Place of birth for the foreign-born population - Other Eastern Asia (%)
Place of birth for the foreign-born population - Afghanistan (%)
Place of birth for the foreign-born population - Bangladesh (%)
Place of birth for the foreign-born population - India (%)
Place of birth for the foreign-born population - Iran (%)
Place of birth for the foreign-born population - Kazakhstan (%)
Place of birth for the foreign-born population - Nepal (%)
Place of birth for the foreign-born population - Pakistan (%)
Place of birth for the foreign-born population - Sri Lanka (%)
Place of birth for the foreign-born population - Uzbekistan (%)
Place of birth for the foreign-born population - Other South Central Asia (%)
Place of birth for the foreign-born population - Burma (%)
Place of birth for the foreign-born population - Cambodia (%)
Place of birth for the foreign-born population - Indonesia (%)
Place of birth for the foreign-born population - Laos (%)
Place of birth for the foreign-born population - Malaysia (%)
Place of birth for the foreign-born population - Philippines (%)
Place of birth for the foreign-born population - Singapore (%)
Place of birth for the foreign-born population - Thailand (%)
Place of birth for the foreign-born population - Vietnam (%)
Place of birth for the foreign-born population - Other South Eastern Asia (%)
Place of birth for the foreign-born population - Armenia (%)
Place of birth for the foreign-born population - Iraq (%)
Place of birth for the foreign-born population - Israel (%)
Place of birth for the foreign-born population - Jordan (%)
Place of birth for the foreign-born population - Kuwait (%)
Place of birth for the foreign-born population - Lebanon (%)
Place of birth for the foreign-born population - Saudi Arabia (%)
Place of birth for the foreign-born population - Syria (%)
Place of birth for the foreign-born population - Turkey (%)
Place of birth for the foreign-born population - Yemen (%)
Place of birth for the foreign-born population - Other Western Asia (%)
Place of birth for the foreign-born population - Eritrea (%)
Place of birth for the foreign-born population - Ethiopia (%)
Place of birth for the foreign-born population - Kenya (%)
Place of birth for the foreign-born population - Somalia (%)
Place of birth for the foreign-born population - Uganda (%)
Place of birth for the foreign-born population - Zimbabwe (%)
Place of birth for the foreign-born population - Other Eastern Africa (%)
Place of birth for the foreign-born population - Cameroon (%)
Place of birth for the foreign-born population - Congo (%)
Place of birth for the foreign-born population - Democratic Republic of Congo (Zaire) (%)
Place of birth for the foreign-born population - Other Middle Africa (%)
Place of birth for the foreign-born population - Egypt (%)
Place of birth for the foreign-born population - Morocco (%)
Place of birth for the foreign-born population - Sudan (%)
Place of birth for the foreign-born population - Other Northern Africa (%)
Place of birth for the foreign-born population - South Africa (%)
Place of birth for the foreign-born population - Other Southern Africa (%)
Place of birth for the foreign-born population - Cabo Verde (%)
Place of birth for the foreign-born population - Ghana (%)
Place of birth for the foreign-born population - Liberia (%)
Place of birth for the foreign-born population - Nigeria (%)
Place of birth for the foreign-born population - Senegal (%)
Place of birth for the foreign-born population - Sierra Leone (%)
Place of birth for the foreign-born population - Other Western Africa (%)
Place of birth for the foreign-born population - Australia (%)
Place of birth for the foreign-born population - New Zealand (%)
Place of birth for the foreign-born population - Fiji (%)
Place of birth for the foreign-born population - Micronesia (%)
Place of birth for the foreign-born population - Bahamas (%)
Place of birth for the foreign-born population - Barbados (%)
Place of birth for the foreign-born population - Cuba (%)
Place of birth for the foreign-born population - Dominica (%)
Place of birth for the foreign-born population - Dominican Republic (%)
Place of birth for the foreign-born population - Grenada (%)
Place of birth for the foreign-born population - Haiti (%)
Place of birth for the foreign-born population - Jamaica (%)
Place of birth for the foreign-born population - St. Vincent and the Grenadines (%)
Place of birth for the foreign-born population - Trinidad and Tobago (%)
Place of birth for the foreign-born population - West Indies (%)
Place of birth for the foreign-born population - Other Caribbean (%)
Place of birth for the foreign-born population - Belize (%)
Place of birth for the foreign-born population - Costa Rica (%)
Place of birth for the foreign-born population - El Salvador (%)
Place of birth for the foreign-born population - Guatemala (%)
Place of birth for the foreign-born population - Honduras (%)
Place of birth for the foreign-born population - Mexico (%)
Place of birth for the foreign-born population - Nicaragua (%)
Place of birth for the foreign-born population - Panama (%)
Place of birth for the foreign-born population - Other Central America (%)
Place of birth for the foreign-born population - Argentina (%)
Place of birth for the foreign-born population - Bolivia (%)
Place of birth for the foreign-born population - Brazil (%)
Place of birth for the foreign-born population - Chile (%)
Place of birth for the foreign-born population - Colombia (%)
Place of birth for the foreign-born population - Ecuador (%)
Place of birth for the foreign-born population - Guyana (%)
Place of birth for the foreign-born population - Peru (%)
Place of birth for the foreign-born population - Uruguay (%)
Place of birth for the foreign-born population - Venezuela (%)
Place of birth for the foreign-born population - Other South America (%)
Place of birth for the foreign-born population - Canada (%)
Place of birth for the foreign-born population - Other Northern America (%)
Place of birth for the foreign-born population - Other (%)
Latest news about races in Pekin, IL collected exclusively by city-data.com from local newspapers, TV, and radio stations
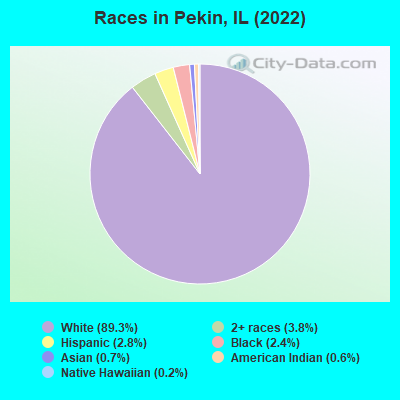
According to 2022 data, the most numerous races in Pekin, IL are White alone (28,358 residents), Hispanic (901 residents), and Black alone (751 residents). 96.6% of Pekin residents speak English at home. 1.7% of Pekin, IL residents are foreign-born , which is 730.6% less than the foreign-born rate of 14.0% across the entire state of Illinois.
Race distribution in Pekin
2000 2022
8,424,140 67.8% White alone 1,856,152 14.9% Black alone 1,530,262 12.3% Hispanic 419,916 3.4% Asian alone 153,996 1.2% Two or more races 13,479 0.1% Other race alone 18,232 0.1% American Indian alone 3,116 0.03% Native Hawaiian and Other
7,356,301 58.5% White alone 2,299,726 18.3% Hispanic 1,660,423 13.2% Black alone 747,296 5.9% Asian alone 458,599 3.6% Two or more races 45,386 0.4% Other race alone 10,405 0.08% American Indian alone 3,896 0.03% Native Hawaiian and Other
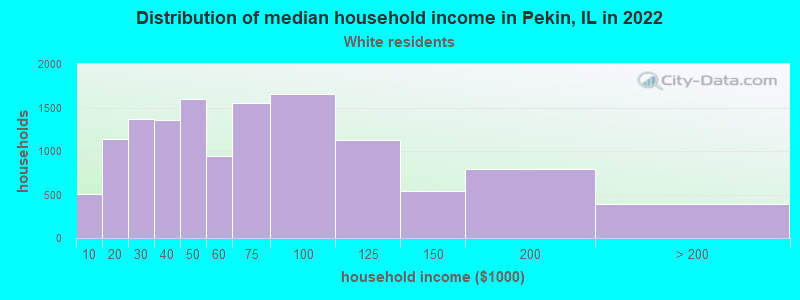
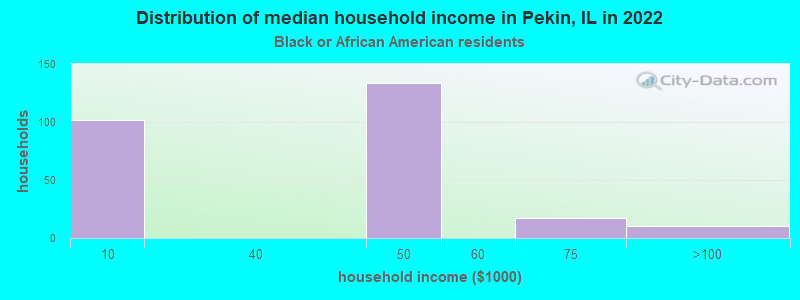
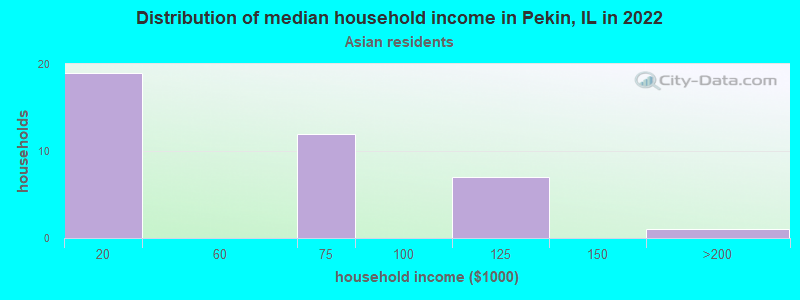
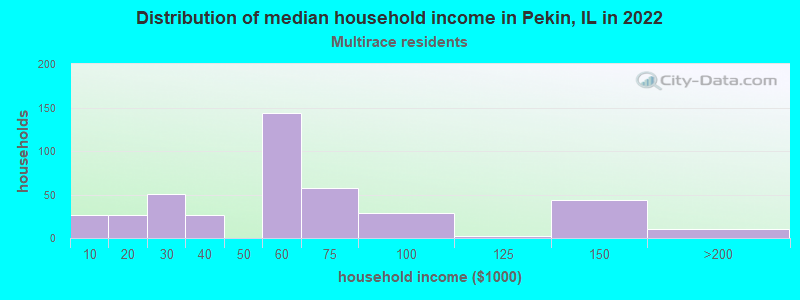
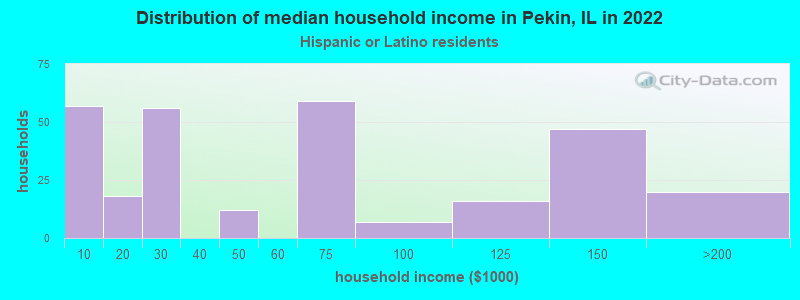
Income and house value in Pekin Median household income in 2022 $52,881 White non-Hispanic householders$44,107 Black householders$50,180 Two or more races householdersMedian 2022 house value $113,613 White Non-Hispanic householders$120,489 American Indian or Alaska Native householders $168,177 Asian householders$142,016 Some other race householders$96,272 Two or more races householders$103,447 Hispanic or Latino householders
Median age by race in Pekin
43.2 Median age for White residents39.5 46.8 39.3 Median age for Black or African American residents42.8 29.4 34.0 Median age for American Indian / Alaska Native residents26.4 41.8 45.4 Median age for Asian residents33.9 46.1 -593,236,714.4 Median age for Native Hawaiian / Pacific Islander residents-666,666,666.0 -576,015,108.0 67.7 Median age for Other race residents49.1 41.8 19.9 Median age for Two or more races residents18.2 26.9 43.6 Median age for White alone residents39.8 47.2 35.3 Median age for Hispanic or Latino residents48.9 27.3
Owner/renter occupied households by race in Pekin
House owners and renters - White residents 8,968 70.3% Owner occupied3,792 29.7% Renter occupiedHouse owners and renters - Black or African American residents 270 100.0% Renter occupiedHouse owners and renters - Asian residents 47 100.0% Owner occupiedHouse owners and renters - Native Hawaiian / Pacific Islander residents 25 100.0% Owner occupiedHouse owners and renters - Other race residents 8 100.0% Owner occupiedHouse owners and renters - Two or more races residents 332 82.6% Owner occupied70 17.4% Renter occupiedHouse owners and renters - White alone residents 8,789 70.2% Owner occupied3,736 29.8% Renter occupiedHouse owners and renters - Hispanic or Latino residents 298 83.4% Owner occupied59 16.6% Renter occupied
Language usage in Pekin
English speakers - Total 96.6% of residents of Pekin speak English at home.
1.9% of residents speak Spanish at home 408 70.6% Speak English very well170 29.4% Speak English less than very well1.6% of residents speak other language at home 449 92.6% Speak English very well36 7.4% Speak English less than very well
English speakers - Born in the United States 94.9% of residents of Pekin speak English at home.
1.4% of residents speak Spanish at home 53 66.2% Speak English very well27 33.8% Speak English less than very well1.1% of residents speak other language at home 64 100.0% Speak English very well
English speakers - Native, born elsewhere 55.9% of residents of Pekin speak English at home.
21.4% of residents speak Spanish at home 7 22.6% Speak English very well24 77.4% Speak English less than very well
English speakers - Foreign-born 13.7% of residents of Pekin speak English at home.
24.6% of residents speak Spanish at home 84 63.2% Speak English very well49 36.8% Speak English less than very well63.5% of residents speak other language at home 309 90.1% Speak English very well34 9.9% Speak English less than very well
White (Caucasian) - Speak only English Native:
98.7% (26,918)Foreign-born:
11.9% (22)
White (Caucasian) - Speak another language Native:
1.2% (335)Foreign-born:
93.1% (169)
Black or African American - Speak another language Native:
4.0% (32)Foreign-born:
95.1% (16)
Asian - Speak only English Native:
100.0% (35)Foreign-born:
1.4% (2)
Native Hawaiian / Pacific Islander - Speak only English Native:
100.0% (33)Foreign-born:
79.6% (33)
Two or more races - Speak another language Native:
5.8% (75)Foreign-born:
100.0% (132)
White alone - Speak only English Native:
99.3% (26,605)Foreign-born:
18.6% (31)
White alone - Speak another language Native:
0.7% (195)Foreign-born:
87.6% (148)
Hispanic or Latino - Speak another language Native:
38.2% (262)Foreign-born:
100.0% (144)
Foreign-born residents in Pekin 535 residents are foreign born
This city:
1.7%Illinois:
14.1%
Marital status for residents in Pekin Marital status - White (Caucasian) population 15 years and over
Males 38.2% Never married44.3% Now married1.5% Separated2.6% Widowed13.4% DivorcedFemales 26.8% Never married39.0% Now married1.1% Separated16.2% Widowed16.8% DivorcedWomen who gave birth in the past 12 months Now married:
45.7% (196)Unmarried:
54.3% (232)
Women who did not give birth in the past 12 months Now married:
39.5% (2,283)Unmarried:
60.5% (3,492)
Marital status - Black or African American population 15 years and over
Males 72.4% Never married20.9% Now married0.0% Separated0.0% Widowed6.7% DivorcedFemales 12.7% Never married11.1% Now married69.0% Separated2.4% Widowed4.8% DivorcedWomen who gave birth in the past 12 months Now married:
0.0% (0)Unmarried:
94.6% (1)
Women who did not give birth in the past 12 months Now married:
83.2% (89)Unmarried:
16.8% (18)
Marital status - American Indian / Alaska Native population 15 years and over
Males 66.2% Never married0.0% Now married10.8% Separated0.0% Widowed23.1% DivorcedFemales 37.8% Never married0.0% Now married0.0% Separated0.0% Widowed62.2% DivorcedWomen who did not give birth in the past 12 months Now married:
0.0% (0)Unmarried:
100.0% (62)
Marital status - Asian population 15 years and over
Males 68.9% Never married29.7% Now married0.0% Separated1.4% Widowed0.0% DivorcedFemales 45.4% Never married30.9% Now married0.0% Separated0.0% Widowed23.7% DivorcedWomen who gave birth in the past 12 months Now married:
100.0% (2)Unmarried:
0.0% (0)
Women who did not give birth in the past 12 months Now married:
0.0% (0)Unmarried:
100.0% (68)
Marital status - Other race population 15 years and over
Males 100.0% Never married0.0% Now married0.0% Separated0.0% Widowed0.0% DivorcedFemales 25.0% Never married50.0% Now married0.0% Separated0.0% Widowed25.0% DivorcedWomen who gave birth in the past 12 months Now married:
100.0% (14)Unmarried:
0.0% (0)
Women who did not give birth in the past 12 months Now married:
0.0% (0)Unmarried:
100.0% (7)
Marital status - Two or more races population 15 years and over
Males 61.5% Never married24.4% Now married9.1% Separated1.1% Widowed3.9% DivorcedFemales 30.2% Never married37.4% Now married6.3% Separated0.9% Widowed25.1% DivorcedWomen who did not give birth in the past 12 months Now married:
24.2% (54)Unmarried:
75.8% (168)
Marital status - White alone, not Hispanic / Latino population 15 years and over
Males 37.1% Never married45.0% Now married1.6% Separated2.6% Widowed13.7% DivorcedFemales 26.7% Never married38.8% Now married1.2% Separated16.3% Widowed17.0% DivorcedWomen who gave birth in the past 12 months Now married:
45.7% (195)Unmarried:
54.3% (231)
Women who did not give birth in the past 12 months Now married:
39.1% (2,192)Unmarried:
60.9% (3,417)
Marital status - Hispanic or Latino population 15 years and over
Males 67.1% Never married22.4% Now married7.7% Separated0.9% Widowed1.9% DivorcedFemales 34.8% Never married44.1% Now married3.0% Separated7.8% Widowed10.4% DivorcedWomen who gave birth in the past 12 months Now married:
100.0% (12)Unmarried:
0.0% (0)
Women who did not give birth in the past 12 months Now married:
52.8% (106)Unmarried:
47.2% (95)
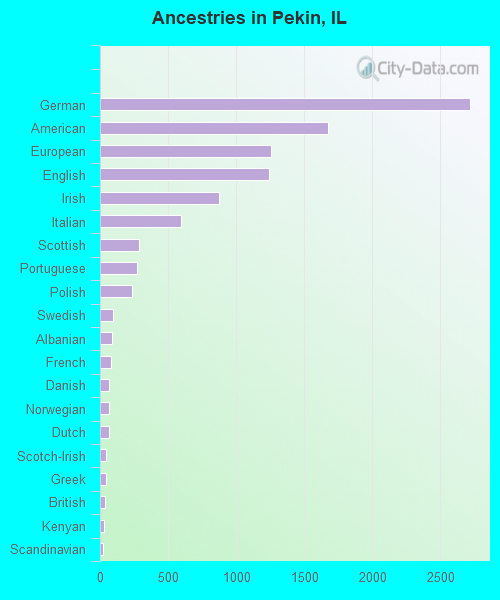
Ancestries in Pekin
2,722 22.2% German1,673 13.6% American1,257 10.2% European1,239 10.1% English872 7.1% Irish598 4.9% Italian284 2.3% Scottish272 2.2% Portuguese238 1.9% Polish99 0.8% Swedish85 0.7% Albanian80 0.7% French67 0.5% Danish66 0.5% Norwegian64 0.5% Dutch45 0.4% Scotch-Irish42 0.3% Greek34 0.3% British28 0.2% Kenyan25 0.2% Scandinavian23 0.2% Ukrainian22 0.2% Hungarian19 0.2% Northern European17 0.1% Czech15 0.1% African14 0.1% Belgian13 0.1% Austrian12 0.10% French Canadian12 0.10% Slovene12 0.10% Welsh11 0.09% Croatian9 0.07% Eastern European6 0.05% Romanian6 0.05% Slovak3 0.02% Russian
Geographical mobility in Pekin Same house 1 year ago 24,164 84.7% White (Caucasian)618 71.5% Black or African American110 69.4% American Indian / Alaska Native150 86.0% Asian57 100.0% Native Hawaiian / Pacific Islander47 67.1% Other race1,320 82.7% Two or more races23,737 84.9% White alone, not Hispanic / Latino639 75.8% Hispanic or LatinoMoved within same county 2,666 9.3% White / Caucasian30 3.5% Black or African American23 13.3% Asian151 9.4% Two or more races2,660 9.5% White alone, not Hispanic / Latino66 7.8% Hispanic or LatinoMoved within same state 915 3.2% White / Caucasian178 20.6% Black or African American14 8.6% American Indian / Alaska Native28 39.0% Other race110 6.9% Two or more races875 3.1% White alone, not Hispanic / Latino79 9.4% Hispanic or LatinoMoved from different state 643 2.3% White / Caucasian65 7.6% Black or African American35 22.2% American Indian / Alaska Native591 2.1% White alone, not Hispanic / Latino8 0.9% Hispanic or LatinoMoved from abroad 261 0.9% White88 0.3% White alone, not Hispanic / Latino69 8.2% Hispanic or Latino
Children Nativity (place of birth) in Pekin
Children under 6 years - Living with two parents Both parents native 886 100.0% NativeOne native, one foreign-born parent 3 100.0% NativeChildren under 6 years - Living with one parent Native parent 948 100.0% NativeChildren 6 to 17 years - Living with two parents Both parents native 2,487 100.0% NativeBoth parents foreign-born 33 100.0% NativeOne native, one foreign-born parent 10 100.0% NativeChildren 6 to 17 years - Living with one parent Native parent 1,427 100.0% NativeForeign-born parent 12 49.8% Native12 50.2% Foreign-born
Grandparents responsible for own grandchildren in Pekin
Grandparents (30 to 59 years) White / Caucasian 153 75.3% Responsible for grandchildren50 24.7% Not responsible for grandchildrenTwo or more races 13 20.5% Responsible for grandchildren52 79.5% Not responsible for grandchildrenWhite alone, not Hispanic / Latino 169 73.2% Responsible for grandchildren62 26.8% Not responsible for grandchildrenHispanic or Latino 9 22.4% Responsible for grandchildren31 77.6% Not responsible for grandchildrenGrandparents (60 years and over) White / Caucasian 97 33.6% Responsible for grandchildren191 66.4% Not responsible for grandchildrenWhite alone, not Hispanic / Latino 97 34.5% Responsible for grandchildren184 65.5% Not responsible for grandchildren