Races in Pelham, New York (NY) Detailed Stats
Data:
Races - White alone (%)
Races - White alone (% change since 2000)
Races - Black alone (%)
Races - Black alone (% change since 2000)
Races - American Indian alone (%)
Races - American Indian alone (% change since 2000)
Races - Asian alone (%)
Races - Asian alone (% change since 2000)
Races - Hispanic (%)
Races - Hispanic (% change since 2000)
Races - Native Hawaiian and Other Pacific Islander alone (%)
Races - Native Hawaiian and Other Pacific Islander alone (% change since 2000)
Races - Two or more races(%)
Races - Two or more races(% change since 2000)
Races - Other race alone (%)
Races - Other race alone (% change since 2000)
Racial diversity
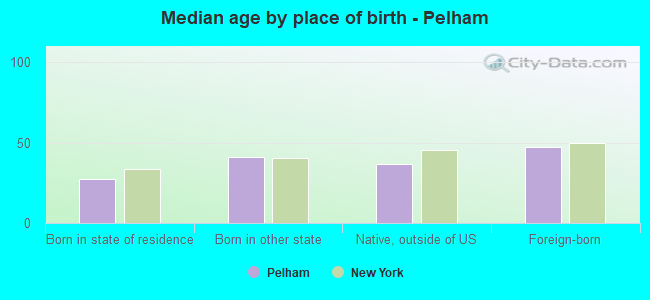
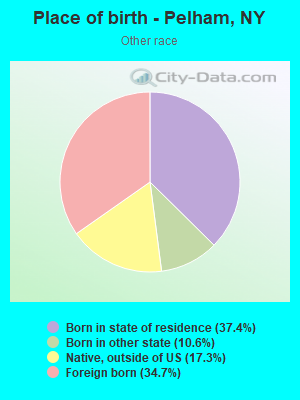
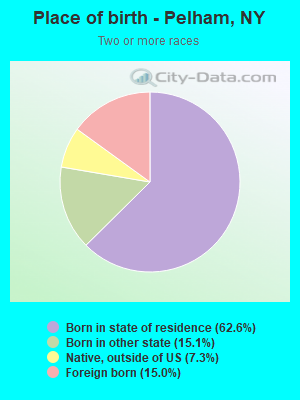
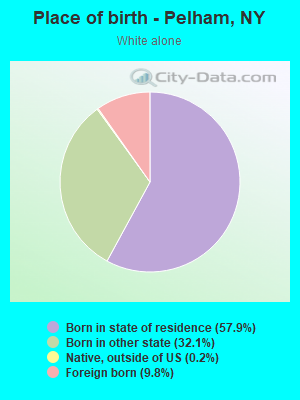
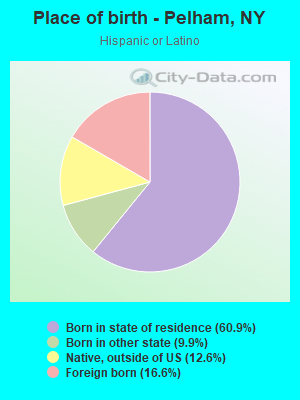
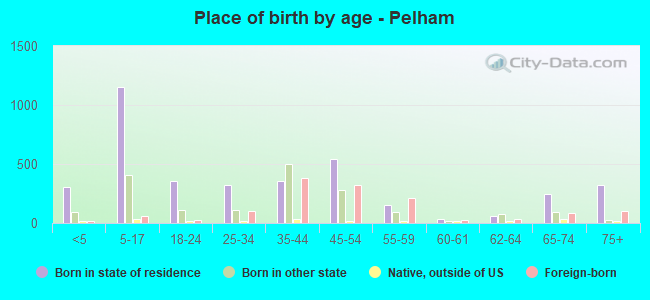
Place of birth - Born in state of residence (%)
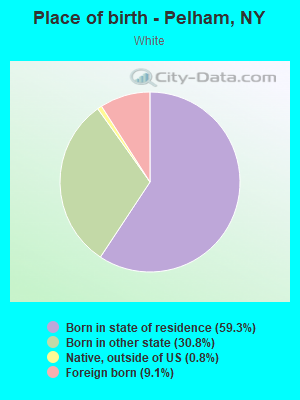
Place of birth - Born in state of residence (%) - White
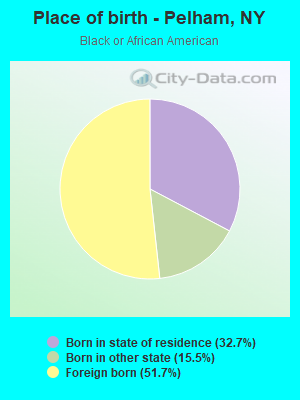
Place of birth - Born in state of residence (%) - Black or African American
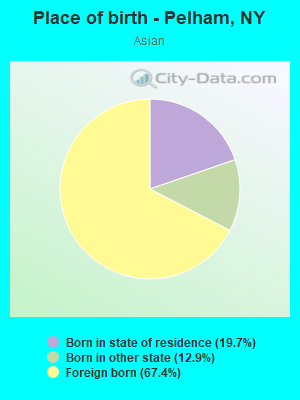
Place of birth - Born in state of residence (%) - Asian
Place of birth - Born in state of residence (%) - Hispanic or Latino
Place of birth - Born in state of residence (%) - American Indian and Alaska Native
Place of birth - Born in state of residence (%) - Multirace
Place of birth - Born in state of residence (%) - Other Race
Place of birth - Born in other state (%)
Place of birth - Born in other state (%) - White
Place of birth - Born in other state (%) - Black or African American
Place of birth - Born in other state (%) - Asian
Place of birth - Born in other state (%) - Hispanic or Latino
Place of birth - Born in other state (%) - American Indian and Alaska Native
Place of birth - Born in other state (%) - Multirace
Place of birth - Born in other state (%) - Other Race
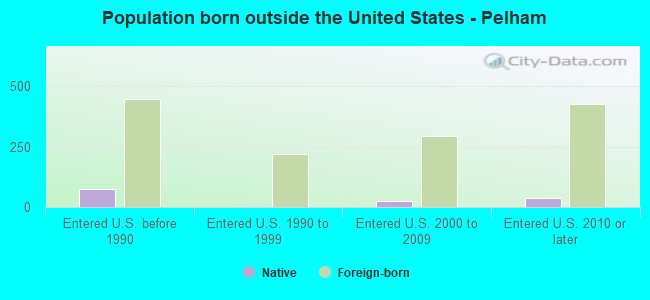
Place of birth - Native, outside of US (%)
Place of birth - Native, outside of US (%) - White
Place of birth - Native, outside of US (%) - Black or African American
Place of birth - Native, outside of US (%) - Asian
Place of birth - Native, outside of US (%) - Hispanic or Latino
Place of birth - Native, outside of US (%) - American Indian and Alaska Native
Place of birth - Native, outside of US (%) - Multirace
Place of birth - Native, outside of US (%) - Other Race
Place of birth - Foreign born (%)
Place of birth - Foreign born (%) - White
Place of birth - Foreign born (%) - Black or African American
Place of birth - Foreign born (%) - Asian
Place of birth - Foreign born (%) - Hispanic or Latino
Place of birth - Foreign born (%) - American Indian and Alaska Native
Place of birth - Foreign born (%) - Multirace
Place of birth - Foreign born (%) - Other Race
Residents speaking English at home (%)
Residents speaking English at home - Born in the United States (%)
Residents speaking English at home - Native, born elsewhere (%)
Residents speaking English at home - Foreign born (%)
Residents speaking Spanish at home (%)
Residents speaking Spanish at home - Born in the United States (%)
Residents speaking Spanish at home - Native, born elsewhere (%)
Residents speaking Spanish at home - Foreign born (%)
Residents speaking other language at home (%)
Residents speaking other language at home - Born in the United States (%)
Residents speaking other language at home - Native, born elsewhere (%)
Residents speaking other language at home - Foreign born (%)
Marital status - Never married (%)
Marital status - Now married (%)
Marital status - Separated (%)
Marital status - Widowed (%)
Marital status - Divorced (%)
Ancestries Reported - Arab (%)
Ancestries Reported - Czech (%)
Ancestries Reported - Danish (%)
Ancestries Reported - Dutch (%)
Ancestries Reported - English (%)
Ancestries Reported - French (%)
Ancestries Reported - French Canadian (%)
Ancestries Reported - German (%)
Ancestries Reported - Greek (%)
Ancestries Reported - Hungarian (%)
Ancestries Reported - Irish (%)
Ancestries Reported - Italian (%)
Ancestries Reported - Lithuanian (%)
Ancestries Reported - Norwegian (%)
Ancestries Reported - Polish (%)
Ancestries Reported - Portuguese (%)
Ancestries Reported - Russian (%)
Ancestries Reported - Scotch-Irish (%)
Ancestries Reported - Scottish (%)
Ancestries Reported - Slovak (%)
Ancestries Reported - Subsaharan African (%)
Ancestries Reported - Swedish (%)
Ancestries Reported - Swiss (%)
Ancestries Reported - Ukrainian (%)
Ancestries Reported - United States (%)
Ancestries Reported - Welsh (%)
Ancestries Reported - West Indian (%)
Ancestries Reported - Other (%)
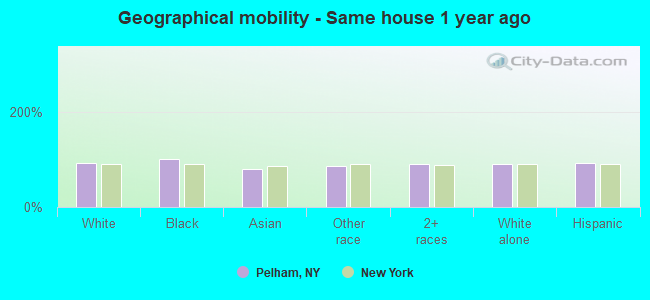
Geographical mobility - Same house 1 year ago (%)
Geographical mobility - Same house 1 year ago (%) - White
Geographical mobility - Same house 1 year ago (%) - Black or African American
Geographical mobility - Same house 1 year ago (%) - Asian
Geographical mobility - Same house 1 year ago (%) - Hispanic or Latino
Geographical mobility - Same house 1 year ago (%) - American Indian and Alaska Native
Geographical mobility - Same house 1 year ago (%) - Multirace
Geographical mobility - Same house 1 year ago (%) - Other Race
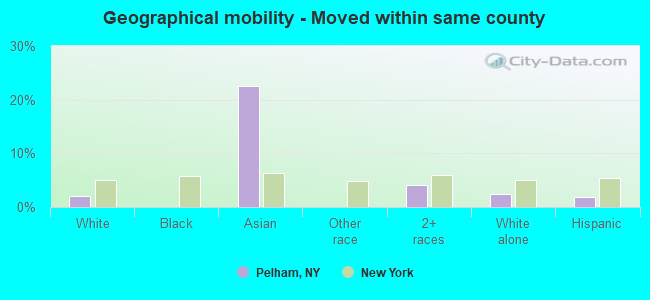
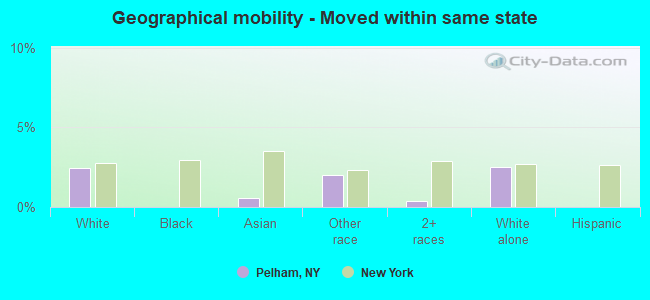
Geographical mobility - Moved within same county (%)
Geographical mobility - Moved within same county (%) - White
Geographical mobility - Moved within same county (%) - Black or African American
Geographical mobility - Moved within same county (%) - Asian
Geographical mobility - Moved within same county (%) - Hispanic or Latino
Geographical mobility - Moved within same county (%) - American Indian and Alaska Native
Geographical mobility - Moved within same county (%) - Multirace
Geographical mobility - Moved within same county (%) - Other Race
Geographical mobility - Moved from different county within same state (%)
Geographical mobility - Moved from different county within same state (%) - White
Geographical mobility - Moved from different county within same state (%) - Black or African American
Geographical mobility - Moved from different county within same state (%) - Asian
Geographical mobility - Moved from different county within same state (%) - Hispanic or Latino
Geographical mobility - Moved from different county within same state (%) - American Indian and Alaska Native
Geographical mobility - Moved from different county within same state (%) - Multirace
Geographical mobility - Moved from different county within same state (%) - Other Race
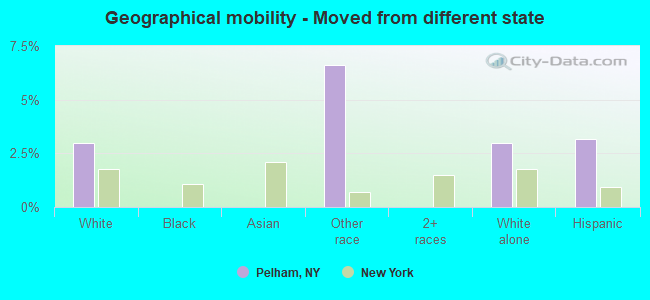
Geographical mobility - Moved from different state (%)
Geographical mobility - Moved from different state (%) - White
Geographical mobility - Moved from different state (%) - Black or African American
Geographical mobility - Moved from different state (%) - Asian
Geographical mobility - Moved from different state (%) - Hispanic or Latino
Geographical mobility - Moved from different state (%) - American Indian and Alaska Native
Geographical mobility - Moved from different state (%) - Multirace
Geographical mobility - Moved from different state (%) - Other Race
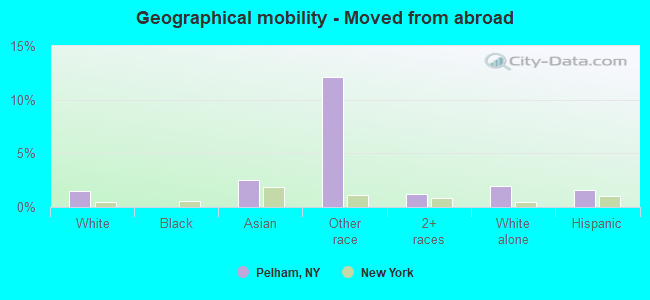
Geographical mobility - Moved from abroad (%)
Geographical mobility - Moved from abroad (%) - White
Geographical mobility - Moved from abroad (%) - Black or African American
Geographical mobility - Moved from abroad (%) - Asian
Geographical mobility - Moved from abroad (%) - Hispanic or Latino
Geographical mobility - Moved from abroad (%) - American Indian and Alaska Native
Geographical mobility - Moved from abroad (%) - Multirace
Geographical mobility - Moved from abroad (%) - Other Race
Place of birth for the foreign-born population - Ireland (%)
Place of birth for the foreign-born population - Denmark (%)
Place of birth for the foreign-born population - Norway (%)
Place of birth for the foreign-born population - Sweden (%)
Place of birth for the foreign-born population - United Kingdom (%)
Place of birth for the foreign-born population - England (%)
Place of birth for the foreign-born population - Scotland (%)
Place of birth for the foreign-born population - Other Northern Europe (%)
Place of birth for the foreign-born population - Austria (%)
Place of birth for the foreign-born population - Belgium (%)
Place of birth for the foreign-born population - France (%)
Place of birth for the foreign-born population - Germany (%)
Place of birth for the foreign-born population - Netherlands (%)
Place of birth for the foreign-born population - Switzerland (%)
Place of birth for the foreign-born population - Other Western Europe (%)
Place of birth for the foreign-born population - Greece (%)
Place of birth for the foreign-born population - Italy (%)
Place of birth for the foreign-born population - Portugal (%)
Place of birth for the foreign-born population - Spain (%)
Place of birth for the foreign-born population - Other Southern Europe (%)
Place of birth for the foreign-born population - Albania (%)
Place of birth for the foreign-born population - Belarus (%)
Place of birth for the foreign-born population - Bosnia and Herzegovina (%)
Place of birth for the foreign-born population - Bulgaria (%)
Place of birth for the foreign-born population - Croatia (%)
Place of birth for the foreign-born population - Czechoslovakia (%)
Place of birth for the foreign-born population - Hungary (%)
Place of birth for the foreign-born population - Latvia (%)
Place of birth for the foreign-born population - Lithuania (%)
Place of birth for the foreign-born population - North Macedonia (Macedonia) (%)
Place of birth for the foreign-born population - Moldova (%)
Place of birth for the foreign-born population - Poland (%)
Place of birth for the foreign-born population - Romania (%)
Place of birth for the foreign-born population - Russia (%)
Place of birth for the foreign-born population - Serbia (%)
Place of birth for the foreign-born population - Ukraine (%)
Place of birth for the foreign-born population - Other Eastern Europe (%)
Place of birth for the foreign-born population - China (%)
Place of birth for the foreign-born population - Hong Kong (%)
Place of birth for the foreign-born population - Taiwan (%)
Place of birth for the foreign-born population - Japan (%)
Place of birth for the foreign-born population - Korea (%)
Place of birth for the foreign-born population - Other Eastern Asia (%)
Place of birth for the foreign-born population - Afghanistan (%)
Place of birth for the foreign-born population - Bangladesh (%)
Place of birth for the foreign-born population - India (%)
Place of birth for the foreign-born population - Iran (%)
Place of birth for the foreign-born population - Kazakhstan (%)
Place of birth for the foreign-born population - Nepal (%)
Place of birth for the foreign-born population - Pakistan (%)
Place of birth for the foreign-born population - Sri Lanka (%)
Place of birth for the foreign-born population - Uzbekistan (%)
Place of birth for the foreign-born population - Other South Central Asia (%)
Place of birth for the foreign-born population - Burma (%)
Place of birth for the foreign-born population - Cambodia (%)
Place of birth for the foreign-born population - Indonesia (%)
Place of birth for the foreign-born population - Laos (%)
Place of birth for the foreign-born population - Malaysia (%)
Place of birth for the foreign-born population - Philippines (%)
Place of birth for the foreign-born population - Singapore (%)
Place of birth for the foreign-born population - Thailand (%)
Place of birth for the foreign-born population - Vietnam (%)
Place of birth for the foreign-born population - Other South Eastern Asia (%)
Place of birth for the foreign-born population - Armenia (%)
Place of birth for the foreign-born population - Iraq (%)
Place of birth for the foreign-born population - Israel (%)
Place of birth for the foreign-born population - Jordan (%)
Place of birth for the foreign-born population - Kuwait (%)
Place of birth for the foreign-born population - Lebanon (%)
Place of birth for the foreign-born population - Saudi Arabia (%)
Place of birth for the foreign-born population - Syria (%)
Place of birth for the foreign-born population - Turkey (%)
Place of birth for the foreign-born population - Yemen (%)
Place of birth for the foreign-born population - Other Western Asia (%)
Place of birth for the foreign-born population - Eritrea (%)
Place of birth for the foreign-born population - Ethiopia (%)
Place of birth for the foreign-born population - Kenya (%)
Place of birth for the foreign-born population - Somalia (%)
Place of birth for the foreign-born population - Uganda (%)
Place of birth for the foreign-born population - Zimbabwe (%)
Place of birth for the foreign-born population - Other Eastern Africa (%)
Place of birth for the foreign-born population - Cameroon (%)
Place of birth for the foreign-born population - Congo (%)
Place of birth for the foreign-born population - Democratic Republic of Congo (Zaire) (%)
Place of birth for the foreign-born population - Other Middle Africa (%)
Place of birth for the foreign-born population - Egypt (%)
Place of birth for the foreign-born population - Morocco (%)
Place of birth for the foreign-born population - Sudan (%)
Place of birth for the foreign-born population - Other Northern Africa (%)
Place of birth for the foreign-born population - South Africa (%)
Place of birth for the foreign-born population - Other Southern Africa (%)
Place of birth for the foreign-born population - Cabo Verde (%)
Place of birth for the foreign-born population - Ghana (%)
Place of birth for the foreign-born population - Liberia (%)
Place of birth for the foreign-born population - Nigeria (%)
Place of birth for the foreign-born population - Senegal (%)
Place of birth for the foreign-born population - Sierra Leone (%)
Place of birth for the foreign-born population - Other Western Africa (%)
Place of birth for the foreign-born population - Australia (%)
Place of birth for the foreign-born population - New Zealand (%)
Place of birth for the foreign-born population - Fiji (%)
Place of birth for the foreign-born population - Micronesia (%)
Place of birth for the foreign-born population - Bahamas (%)
Place of birth for the foreign-born population - Barbados (%)
Place of birth for the foreign-born population - Cuba (%)
Place of birth for the foreign-born population - Dominica (%)
Place of birth for the foreign-born population - Dominican Republic (%)
Place of birth for the foreign-born population - Grenada (%)
Place of birth for the foreign-born population - Haiti (%)
Place of birth for the foreign-born population - Jamaica (%)
Place of birth for the foreign-born population - St. Vincent and the Grenadines (%)
Place of birth for the foreign-born population - Trinidad and Tobago (%)
Place of birth for the foreign-born population - West Indies (%)
Place of birth for the foreign-born population - Other Caribbean (%)
Place of birth for the foreign-born population - Belize (%)
Place of birth for the foreign-born population - Costa Rica (%)
Place of birth for the foreign-born population - El Salvador (%)
Place of birth for the foreign-born population - Guatemala (%)
Place of birth for the foreign-born population - Honduras (%)
Place of birth for the foreign-born population - Mexico (%)
Place of birth for the foreign-born population - Nicaragua (%)
Place of birth for the foreign-born population - Panama (%)
Place of birth for the foreign-born population - Other Central America (%)
Place of birth for the foreign-born population - Argentina (%)
Place of birth for the foreign-born population - Bolivia (%)
Place of birth for the foreign-born population - Brazil (%)
Place of birth for the foreign-born population - Chile (%)
Place of birth for the foreign-born population - Colombia (%)
Place of birth for the foreign-born population - Ecuador (%)
Place of birth for the foreign-born population - Guyana (%)
Place of birth for the foreign-born population - Peru (%)
Place of birth for the foreign-born population - Uruguay (%)
Place of birth for the foreign-born population - Venezuela (%)
Place of birth for the foreign-born population - Other South America (%)
Place of birth for the foreign-born population - Canada (%)
Place of birth for the foreign-born population - Other Northern America (%)
Place of birth for the foreign-born population - Other (%)
Latest news about races in Pelham, NY collected exclusively by city-data.com from local newspapers, TV, and radio stations
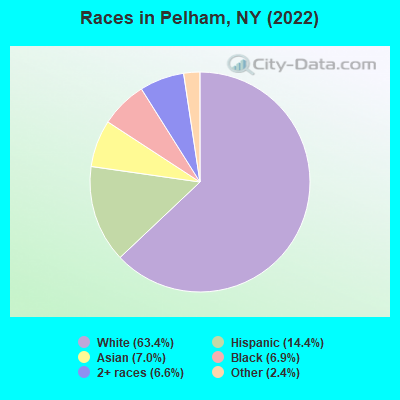
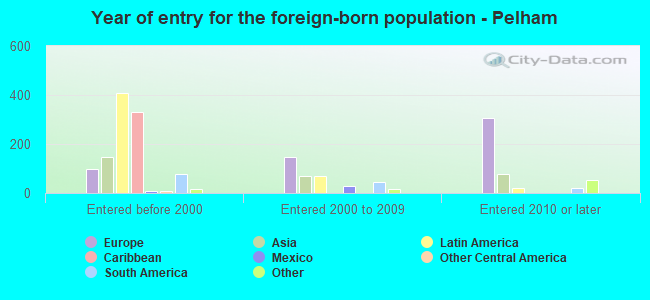
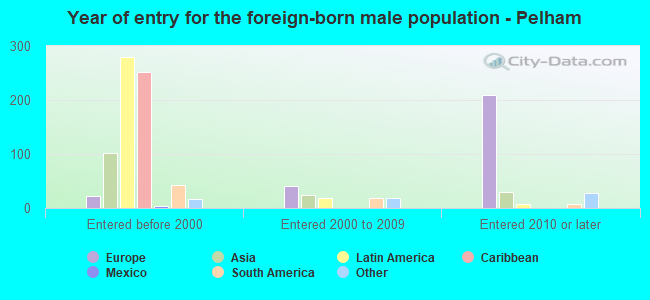
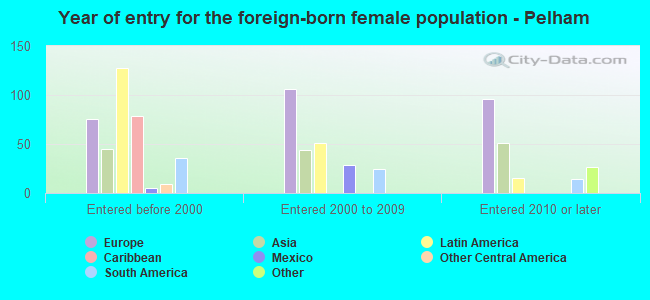
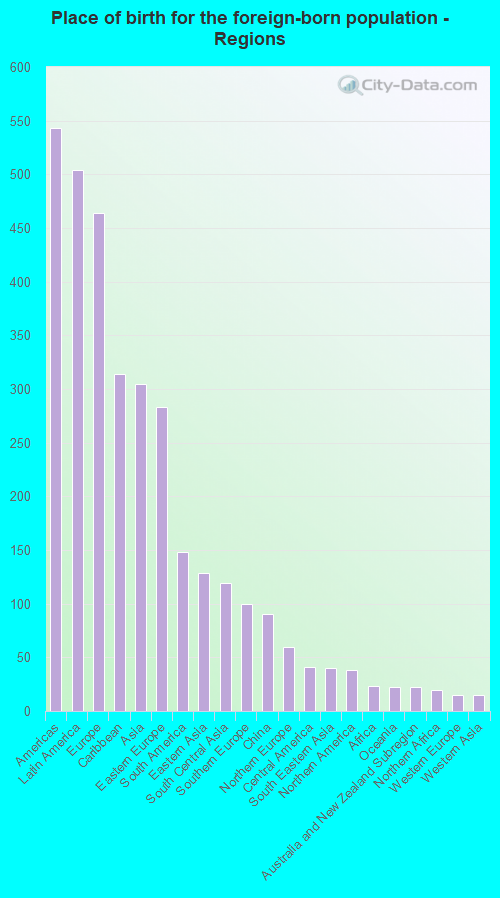
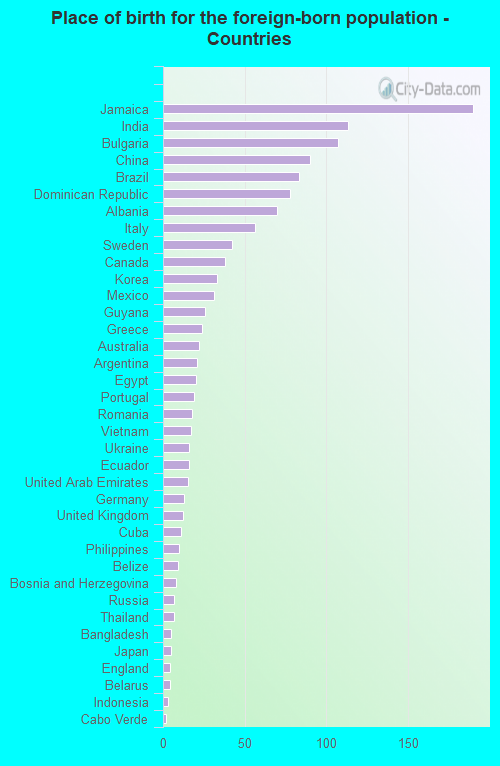
According to 2022 data, the most numerous races in Pelham, NY are White alone (4,569 residents), Hispanic (1,036 residents), and Black alone (494 residents). 78.3% of Pelham residents speak English at home. 18.9% of Pelham, NY residents are foreign-born (7.0% born in Latin America, 6.5% born in Europe, 4.2% born in Asia), which is 16.6% less than the foreign-born rate of 22.0% across the entire state of New York.
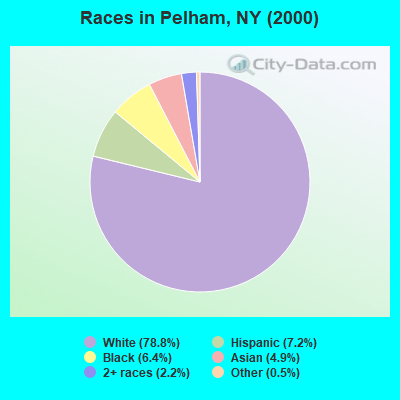
Race distribution in Pelham
2000 2022
11,760,981 62.0% White alone 2,867,583 15.1% Hispanic 2,812,623 14.8% Black alone 1,035,926 5.5% Asian alone 366,116 1.9% Two or more races 75,499 0.4% Other race alone 52,499 0.3% American Indian alone 5,230 0.03% Native Hawaiian and Other
10,408,933 52.9% White alone 3,867,299 19.7% Hispanic 2,633,840 13.4% Black alone 1,776,286 9.0% Asian alone 732,670 3.7% Two or more races 216,110 1.1% Other race alone 35,082 0.2% American Indian alone 6,931 0.04% Native Hawaiian and Other
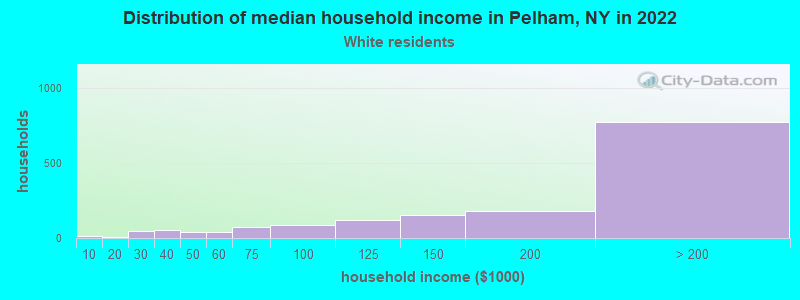
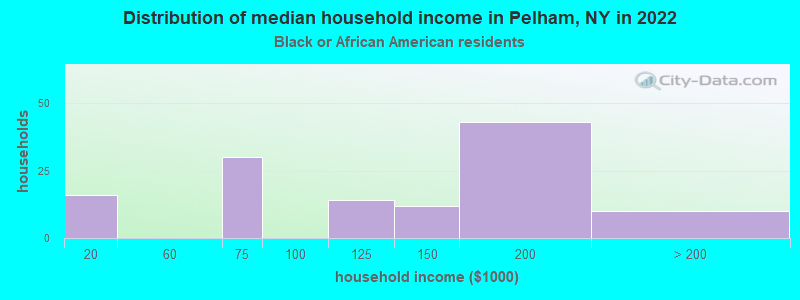
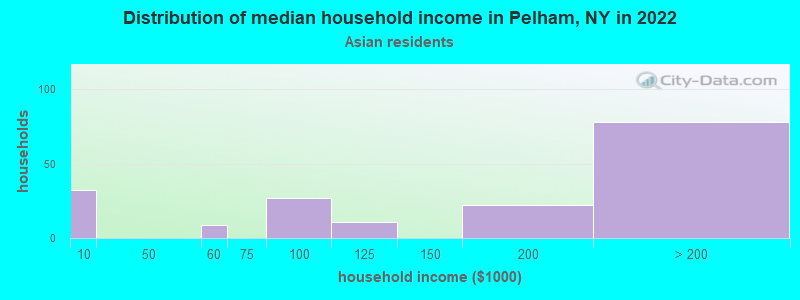
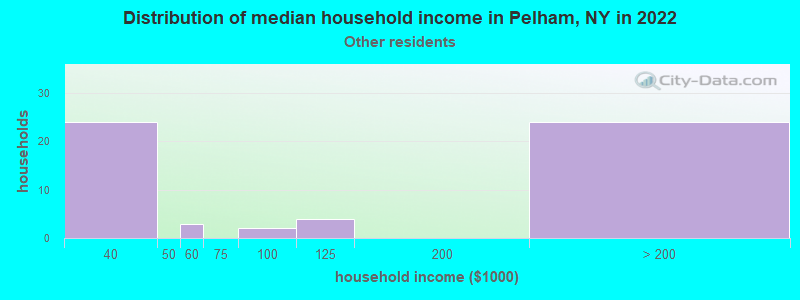
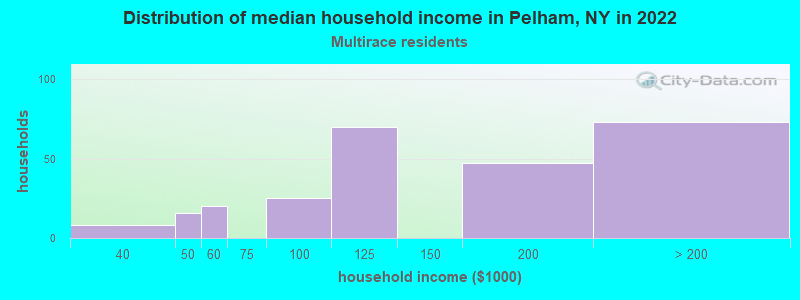
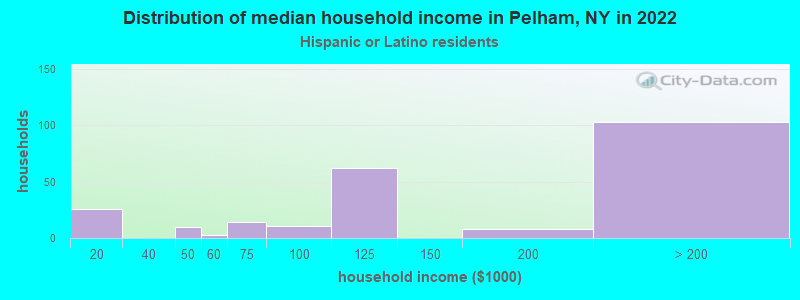
Income and house value in Pelham Median household income in 2022 $170,604 White non-Hispanic householders$129,538 Black householders$183,322 Asian householders$129,353 Two or more races householdersMedian 2022 house value $916,826 White Non-Hispanic householders$621,994 Black or African American householders $672,425 Asian householders$948,379 Some other race householders$655,873 Two or more races householders$948,379 Hispanic or Latino householders
Median age by race in Pelham
41.1 Median age for White residents37.1 43.1 45.5 Median age for Black or African American residents58.4 35.6 -641,441,440.8 Median age for American Indian / Alaska Native residents-664,804,468.6 -554,999,999.4 42.2 Median age for Asian residents48.8 40.4 -487,992,314.6 Median age for Native Hawaiian / Pacific Islander residents-477,502,295.2 -666,666,666.0 26.7 Median age for Other race residents26.7 48.0 23.8 Median age for Two or more races residents19.1 38.9 40.6 Median age for White alone residents36.7 43.5 27.2 Median age for Hispanic or Latino residents23.7 38.0
Owner/renter occupied households by race in Pelham
House owners and renters - White residents 1,223 77.4% Owner occupied357 22.6% Renter occupiedHouse owners and renters - Black or African American residents 90 60.8% Owner occupied58 39.2% Renter occupiedHouse owners and renters - Asian residents 140 74.8% Owner occupied47 25.2% Renter occupiedHouse owners and renters - Other race residents 23 40.5% Owner occupied33 59.5% Renter occupiedHouse owners and renters - Two or more races residents 134 49.4% Owner occupied137 50.6% Renter occupiedHouse owners and renters - White alone residents 1,201 76.9% Owner occupied361 23.1% Renter occupiedHouse owners and renters - Hispanic or Latino residents 121 48.4% Owner occupied129 51.6% Renter occupied
Language usage in Pelham
English speakers - Total 78.3% of residents of Pelham speak English at home.
7.9% of residents speak Spanish at home 471 87.9% Speak English very well65 12.1% Speak English less than very well13.6% of residents speak other language at home 616 66.7% Speak English very well308 33.3% Speak English less than very well
English speakers - Born in the United States 96.1% of residents of Pelham speak English at home.
2.5% of residents speak Spanish at home 30 68.2% Speak English very well14 31.8% Speak English less than very well2.3% of residents speak other language at home 33 82.5% Speak English very well7 17.5% Speak English less than very well
English speakers - Native, born elsewhere 4.5% of residents of Pelham speak English at home.
105.3% of residents speak Spanish at home 132 94.3% Speak English very well8 5.7% Speak English less than very well10.5% of residents speak other language at home 14 100.0% Speak English very well
English speakers - Foreign-born 42.4% of residents of Pelham speak English at home.
10.0% of residents speak Spanish at home 116 84.1% Speak English very well22 15.9% Speak English less than very well49.1% of residents speak other language at home 413 61.1% Speak English very well263 38.9% Speak English less than very well
White (Caucasian) - Speak only English Native:
96.6% (3,901)Foreign-born:
34.6% (147)
White (Caucasian) - Speak another language Native:
4.7% (189)Foreign-born:
64.6% (274)
Black or African American - Speak only English Native:
76.3% (188)Foreign-born:
82.1% (233)
Black or African American - Speak another language Native:
20.0% (49)Foreign-born:
19.7% (56)
Asian - Speak only English Native:
60.1% (75)Foreign-born:
45.5% (156)
Asian - Speak another language Native:
39.8% (50)Foreign-born:
56.4% (193)
Other race - Speak another language Native:
76.8% (111)Foreign-born:
96.8% (77)
Two or more races - Speak only English Native:
71.2% (637)Foreign-born:
18.1% (34)
Two or more races - Speak another language Native:
29.3% (262)Foreign-born:
81.3% (152)
White alone - Speak only English Native:
97.2% (3,798)Foreign-born:
28.2% (126)
White alone - Speak another language Native:
3.2% (124)Foreign-born:
69.9% (314)
Hispanic or Latino - Speak only English Native:
56.0% (452)Foreign-born:
16.0% (28)
Hispanic or Latino - Speak another language Native:
40.9% (330)Foreign-born:
85.9% (150)
Foreign-born residents in Pelham 1,360 residents are foreign born (7.0% Latin America , 6.5% Europe , 4.2% Asia ).
This city:
18.9%New York:
22.6%
Marital status for residents in Pelham Marital status - White (Caucasian) population 15 years and over
Males 36.5% Never married58.3% Now married0.0% Separated0.8% Widowed4.4% DivorcedFemales 20.9% Never married63.4% Now married4.7% Separated7.9% Widowed3.2% DivorcedWomen who gave birth in the past 12 months Now married:
100.0% (77)Unmarried:
0.0% (0)
Women who did not give birth in the past 12 months Now married:
56.6% (462)Unmarried:
43.4% (355)
Marital status - Black or African American population 15 years and over
Males 75.8% Never married24.2% Now married0.0% Separated0.0% Widowed0.0% DivorcedFemales 46.3% Never married24.4% Now married7.9% Separated0.0% Widowed21.3% DivorcedWomen who did not give birth in the past 12 months Now married:
33.9% (38)Unmarried:
66.1% (74)
Marital status - Asian population 15 years and over
Males 0.0% Never married96.4% Now married0.0% Separated3.6% Widowed0.0% DivorcedFemales 28.4% Never married66.2% Now married0.0% Separated5.3% Widowed0.0% DivorcedWomen who did not give birth in the past 12 months Now married:
62.1% (103)Unmarried:
37.9% (63)
Marital status - Other race population 15 years and over
Males 51.5% Never married48.5% Now married0.0% Separated0.0% Widowed0.0% DivorcedFemales 36.4% Never married63.6% Now married0.0% Separated0.0% Widowed0.0% DivorcedWomen who did not give birth in the past 12 months Now married:
55.6% (23)Unmarried:
44.4% (18)
Marital status - Two or more races population 15 years and over
Males 48.3% Never married51.7% Now married0.0% Separated0.0% Widowed0.0% DivorcedFemales 45.5% Never married51.5% Now married0.0% Separated0.0% Widowed3.0% DivorcedWomen who did not give birth in the past 12 months Now married:
40.7% (124)Unmarried:
59.3% (181)
Marital status - White alone, not Hispanic / Latino population 15 years and over
Males 34.1% Never married60.2% Now married0.0% Separated0.8% Widowed4.8% DivorcedFemales 19.7% Never married64.3% Now married4.6% Separated8.4% Widowed3.0% DivorcedWomen who gave birth in the past 12 months Now married:
100.0% (82)Unmarried:
0.0% (0)
Women who did not give birth in the past 12 months Now married:
59.0% (473)Unmarried:
41.0% (329)
Marital status - Hispanic or Latino population 15 years and over
Males 64.5% Never married35.5% Now married0.0% Separated0.0% Widowed0.0% DivorcedFemales 47.8% Never married45.7% Now married2.2% Separated0.0% Widowed4.3% DivorcedWomen who did not give birth in the past 12 months Now married:
36.4% (99)Unmarried:
63.6% (173)
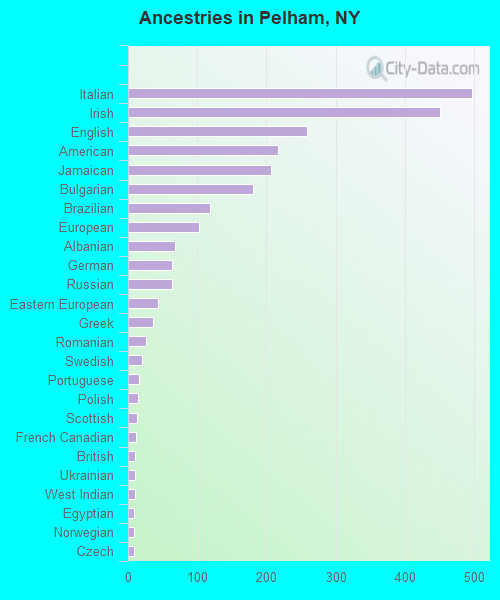
Ancestries in Pelham
497 14.6% Italian451 13.2% Irish259 7.6% English217 6.4% American207 6.1% Jamaican180 5.3% Bulgarian118 3.5% Brazilian102 3.0% European68 2.0% Albanian63 1.8% German63 1.8% Russian43 1.3% Eastern European36 1.1% Greek26 0.8% Romanian20 0.6% Swedish16 0.5% Portuguese15 0.4% Polish13 0.4% Scottish11 0.3% French Canadian10 0.3% British10 0.3% Ukrainian10 0.3% West Indian9 0.3% Egyptian9 0.3% Norwegian8 0.2% Czech7 0.2% French7 0.2% Welsh6 0.2% Australian5 0.1% Dutch4 0.1% Yugoslavian3 0.09% Lithuanian2 0.06% Scotch-Irish2 0.06% Hungarian
Children Nativity (place of birth) in Pelham
Children under 6 years - Living with two parents Both parents native 205 100.0% NativeBoth parents foreign-born 79 100.0% NativeOne native, one foreign-born parent 162 100.0% NativeChildren under 6 years - Living with one parent Native parent 19 100.0% NativeChildren 6 to 17 years - Living with two parents Both parents native 930 100.0% NativeBoth parents foreign-born 118 71.6% Native47 28.4% Foreign-bornOne native, one foreign-born parent 250 100.0% NativeChildren 6 to 17 years - Living with one parent Native parent 120 100.0% NativeForeign-born parent 165 51.2% Native158 48.8% Foreign-born